ES Thursday 10-24-13
Two videos today which point out all the basic levels from varying viewpoints........I think that 46 is going to be the critical spot ..I also have 42.50 - 43.50, 1740.50 and then below is 37.50 - 38.50..further above is 49.25 and 51.50
yes...you put a volume profile on that ......most times this profile will be the same as the day session only profile because most VOLUME is in the day session....then you run a one minute or less TIME profile ( price at time equals value).....this will give you some nice POC's and also you can get a value area high and low off one minute data ....u can also see the low time spots ......quite often many of your lines from the two methods will end up being close by so I create zones from them
and since I make most of my money early on , these lines are static and donot need to change...we donot need to worry about developing value areas etc unless you like to trade outside the first two hours or so....the more data that gets displayed on my screen gives more more information whicta
and since I make most of my money early on , these lines are static and donot need to change...we donot need to worry about developing value areas etc unless you like to trade outside the first two hours or so....the more data that gets displayed on my screen gives more more information whicta
Originally posted by daddywolf
so merge the overnight session...into Wed day session... and I have a 24hr market profile for the Thursday day session. correct?
i hope most realize that this mornings video is a way to find good numbers...I donot think it should completely replace your work you do with finding bell curves and buying/selling tails etc.....I was trying to present a way to have good numbers without much discretion.......they will work and work well on their own but it's always best to confirm with some visual and not just lines created by software......that's why i suggest you look at the price action to see WHY the lines are placed there by your software too
sounding even more like a precher today but look how they are ping ponging off the lines ...I think the 49 that nick and I were mentioning are coming...it's one thing to have lines on your chart but actually trading them can be really tough ( tuff)
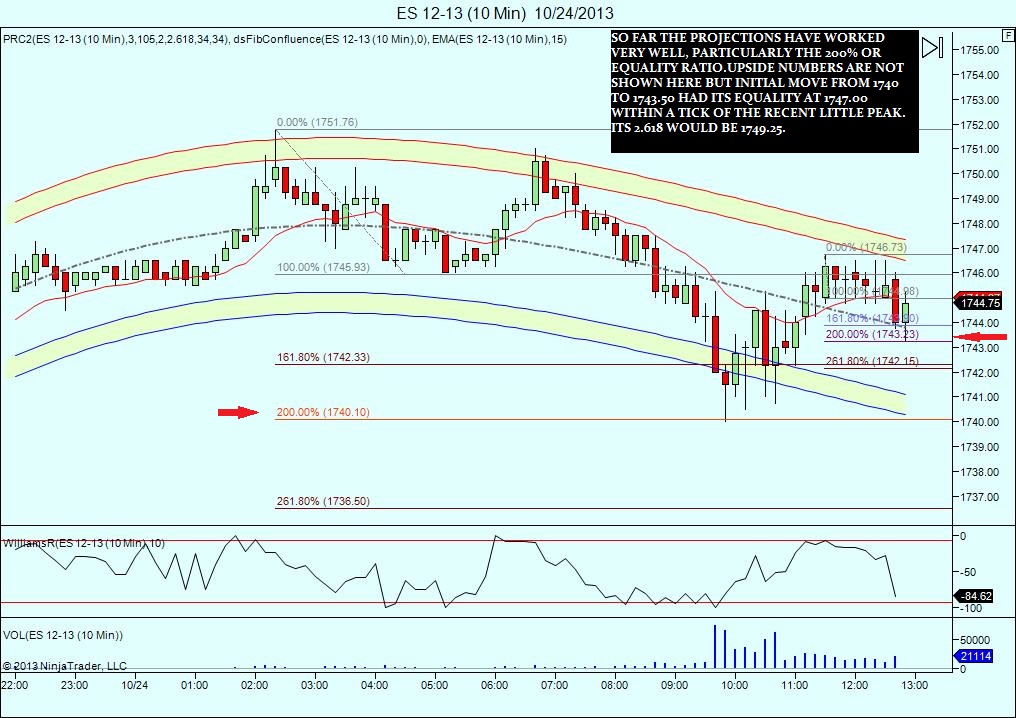
From a different perspective, here is what i have been watching and trading today...
Click image for original size
....
nice kool..I'm wondering when 1.5 the IB is gonna print.....? nice confluence with other methods and yours..thanks for posting it
the force is in balance...here's the 49 prior acceptance area i mentioned earlier...see u all tomorrow
Originally posted by BruceM... you should see 49.25 print... then ...?..i exited my long at 1748.00 just to bee ahead of it
nice kool..I'm wondering when 1.5 the IB is gonna print.....? nice confluence with other methods and yours..thanks for posting it
Emini Day Trading /
Daily Notes /
Forecast /
Economic Events /
Search /
Terms and Conditions /
Disclaimer /
Books /
Online Books /
Site Map /
Contact /
Privacy Policy /
Links /
About /
Day Trading Forum /
Investment Calculators /
Pivot Point Calculator /
Market Profile Generator /
Fibonacci Calculator /
Mailing List /
Advertise Here /
Articles /
Financial Terms /
Brokers /
Software /
Holidays /
Stock Split Calendar /
Mortgage Calculator /
Donate
Copyright © 2004-2023, MyPivots. All rights reserved.
Copyright © 2004-2023, MyPivots. All rights reserved.