ES Monday 9-8-14
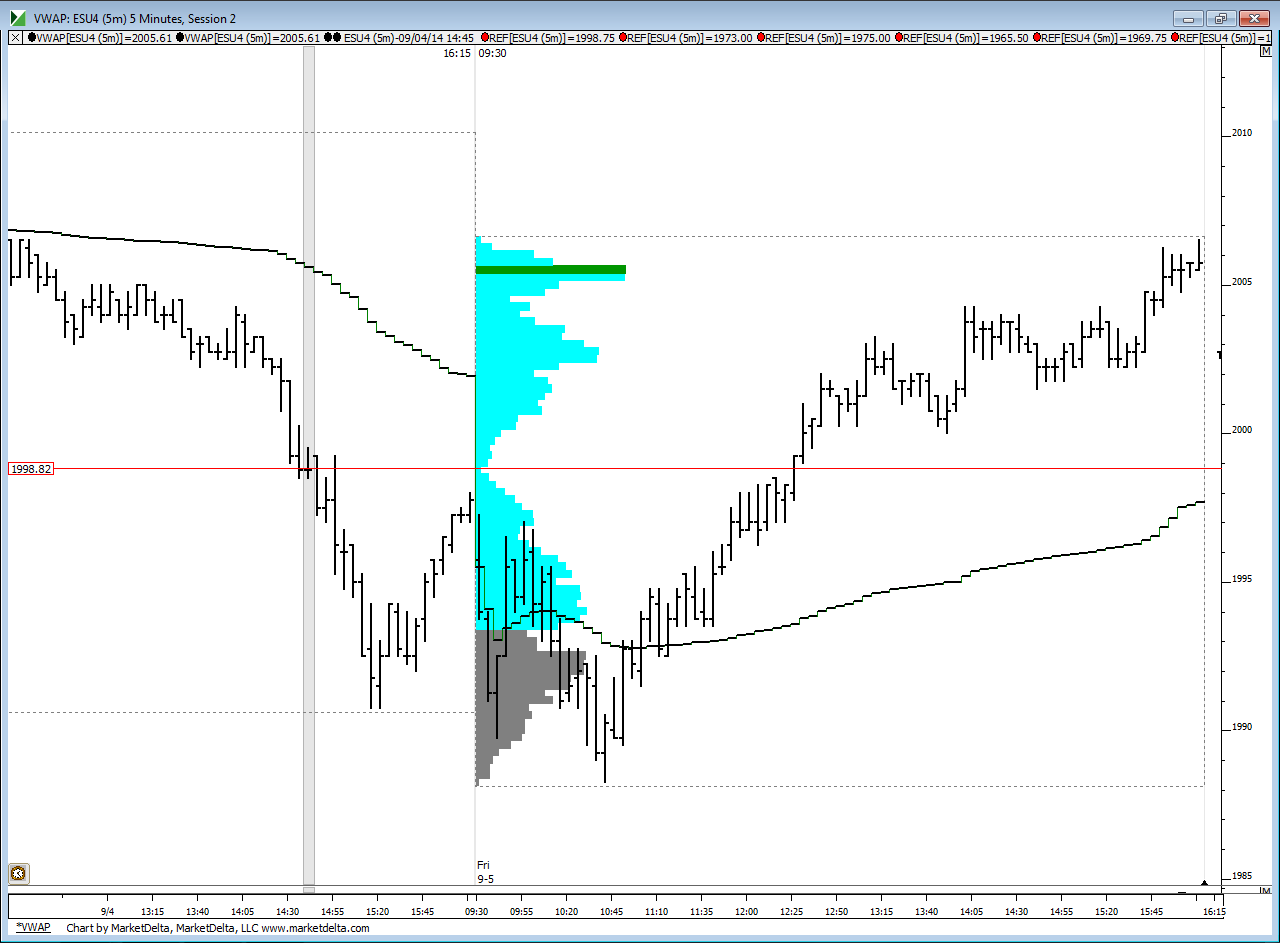
Here' how I see it today....those standard deviation bands when I changed the multiplier are suppose to show a spot where the market should NOT trade too by fridays close...the first screen I showed were the bands just for today...hope that's clear
I just added this chart in...you can see the low volume spot at around 1999 that separates the two distributions we had on Friday........so this goes well with our 2000 area anyway but in general you can use 1999- 2001 as thee critical area to watch today for clues of direction
I just added this chart in...you can see the low volume spot at around 1999 that separates the two distributions we had on Friday........so this goes well with our 2000 area anyway but in general you can use 1999- 2001 as thee critical area to watch today for clues of direction
Click image for original size
I started small O/N longs at 2002.25...will use 2004 area as a target...plan will be more aggressive on longs if they push out O/N low in RTH ...current O/N midpoint is 2004.25 !!
ideally we'd like them to keep this above 03.50 - 04.50 now but they may do the fake out down....that would set up a new buying opportunity if they run out that O/N low first today...otherwise i"m hoping we go pop to 07 - 08 on this trade before small runners get clipped ..... in this crappy volatility it could take a while
nice early morning action there Bruce
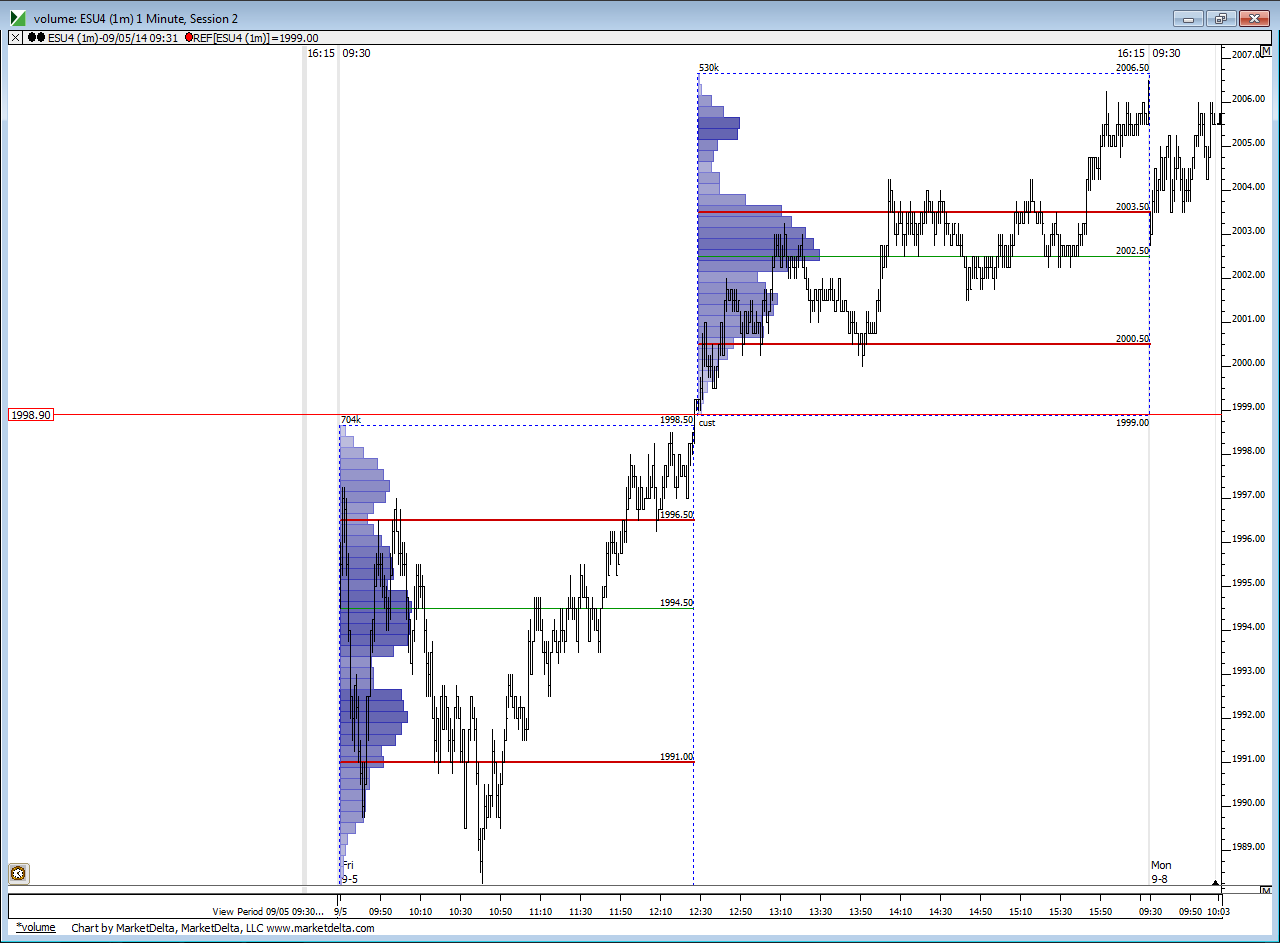
here's something I have been messing with when I do ongoing bell curve research....this is a time chart and I drew two separate TIME profiles using my one minute bars for fridays session because it was a double distribution day...so I have two different value areas based on TIME for each distribution.....note how the top one had a VA high of 03.50 and a poc of 02.50.....and look at the price action to the right of it so far today.....it capped the decline....so far...I chose these areas because the distributions where separated by that LVN at 1999.....so that was the transition point where one distribution ended and the next one began
Click image for original size
thanks Sharks.....in many ways it was gift because that strength From friday was to supposed to carry over early on...so an open lower was almost an automatic buy for mel
Originally posted by sharks57
nice early morning action there Bruce
took a quick short in here around 2005.25 delta was dropping off and momentum waning looking for 2003.25 little late on the post sorry.
Nice hit Sharks
starting new and smaller longs at 2000.75..this really needs to get above 2002.50 otherwise we may be dropping down to lower edge near that 1998.50 -1999.50
targeting 2002.50..that is breakout from first 30 minute bar
Thx bKay, Yes but got off the train a little early. See a single print on Fridays chart if I'm reading that right could be a target to the downside.
just small pieces for me but I'm all out now....we are at developing vwap now too...
Originally posted by sharks57
Looks like you have a solid trade off that 99.50 area Bruce
Emini Day Trading /
Daily Notes /
Forecast /
Economic Events /
Search /
Terms and Conditions /
Disclaimer /
Books /
Online Books /
Site Map /
Contact /
Privacy Policy /
Links /
About /
Day Trading Forum /
Investment Calculators /
Pivot Point Calculator /
Market Profile Generator /
Fibonacci Calculator /
Mailing List /
Advertise Here /
Articles /
Financial Terms /
Brokers /
Software /
Holidays /
Stock Split Calendar /
Mortgage Calculator /
Donate
Copyright © 2004-2023, MyPivots. All rights reserved.
Copyright © 2004-2023, MyPivots. All rights reserved.