14 April 2005 pre-market comments
quote:A rare day indeed - back to back trend days.
We see trend days about 20% of the time and back-to-back trend days are rare.
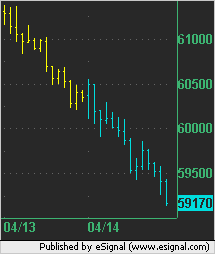
Here is a chart showing the ER2 as 30 minute bars over the last two days during RTH. Yellow shows 13 April and cyan shows today (14 April).
Click image for original size
quote:
the previous trading session had been a WS7
what is a WS7? and is it explained anywhere in the M.O.M book?
thx
WS stands for Wide Spread and is basically the opposite of Narrow Range or NR. These are explained in the Notes to the Daily Notes. A WS is when the day's range (high - low) is wider than the previous day's range. An NR is when the day's range is narrower. It's usually one or the other but sometimes the ranges (obviously) are the same from day to day and then it's neither.
WS7 is when the day was the widest (w.r.t. range) in the last 7 days.
WS7 is when the day was the widest (w.r.t. range) in the last 7 days.
These comments relate to the Daily Notes page on 14 April 2005.
Yesterday was a Narrow Range (NR) which means that the range (high – low) was narrower than the range for the previous trading session. This was expected as the previous trading session had been a WS7. Don't let this NR fool you though: If you look at the RANGE % you will see that the range of the ER2 is 2.1% and marked in yellow showing that it was higher than usual.
All the equity indices had Inside Days (ID) except for the NQ which put in a new 40 day low. Oil put in a new 20 day low while the bonds put in a new 20 day high.
The Trend % for yesterday shows us that we had a trend day for the equity indices and oil but not for bonds or the euro. The Trend % is a pathetically simple calculation that a 5-year-old could do if it wasn’t illegal to make your children do your pre-market preparation for you. It measures the absolute difference between the open and close as a percentage of the day’s range. The color codes on the Daily Notes page then mark these numbers in green if they are in the top 1/3 and red in the bottom 1/3 to give you a quick visual of how trendy the previous day was. We see trend days about 20% of the time and back-to-back trend days are rare.
Feel free to post your comments and questions here...
Emini Day Trading /
Daily Notes /
Forecast /
Economic Events /
Search /
Terms and Conditions /
Disclaimer /
Books /
Online Books /
Site Map /
Contact /
Privacy Policy /
Links /
About /
Day Trading Forum /
Investment Calculators /
Pivot Point Calculator /
Market Profile Generator /
Fibonacci Calculator /
Mailing List /
Advertise Here /
Articles /
Financial Terms /
Brokers /
Software /
Holidays /
Stock Split Calendar /
Mortgage Calculator /
Donate
Copyright © 2004-2023, MyPivots. All rights reserved.
Copyright © 2004-2023, MyPivots. All rights reserved.