Range Extension
I answered a question recently about Range Extension and how to tell if it was going to be a normal variation day to one side or end up being a neutral day with RE on both sides. (I think that the question was along those lines.)
My answer is that I think that the nature or character of the RE tells us a lot about what the market wants to do. If the RE is a spike outside the Initial Balance (IB) and we return to the area in the IB quickly then we can see that there's very little new business in that area and responsive market action has killed off the initiative action.
If, on the other hand, the market lingers in this area outside the IB and we see volume here then we are being told that the market is accepting these new prices and that the initiative players may be overwhelming the responsive traders.
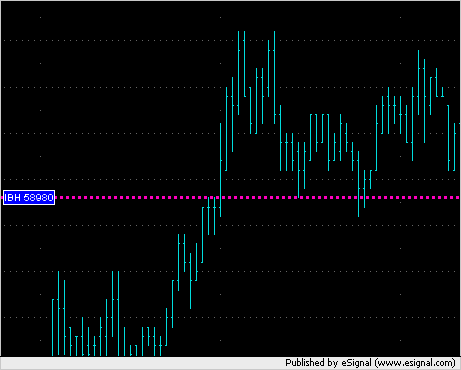
Here is a portion of the 1 minute chart from today's action in the ER2:
The pink dotted line marks the IB high (IBH) and we can see the ER2 cross the line for the first time today and then spend a lot of time above the IBH and show acceptance in this RE area. It is my opinion that this type of action creates an RE with a character which is very different from an RE which is a spike met by responsive action. For that reason we cannot look at only the MP chart but also need to look at other charts to determine the nature of some of the MP behavior and patterns.
My answer is that I think that the nature or character of the RE tells us a lot about what the market wants to do. If the RE is a spike outside the Initial Balance (IB) and we return to the area in the IB quickly then we can see that there's very little new business in that area and responsive market action has killed off the initiative action.
If, on the other hand, the market lingers in this area outside the IB and we see volume here then we are being told that the market is accepting these new prices and that the initiative players may be overwhelming the responsive traders.
Here is a portion of the 1 minute chart from today's action in the ER2:
Click image for original size
The pink dotted line marks the IB high (IBH) and we can see the ER2 cross the line for the first time today and then spend a lot of time above the IBH and show acceptance in this RE area. It is my opinion that this type of action creates an RE with a character which is very different from an RE which is a spike met by responsive action. For that reason we cannot look at only the MP chart but also need to look at other charts to determine the nature of some of the MP behavior and patterns.
Emini Day Trading /
Daily Notes /
Forecast /
Economic Events /
Search /
Terms and Conditions /
Disclaimer /
Books /
Online Books /
Site Map /
Contact /
Privacy Policy /
Links /
About /
Day Trading Forum /
Investment Calculators /
Pivot Point Calculator /
Market Profile Generator /
Fibonacci Calculator /
Mailing List /
Advertise Here /
Articles /
Financial Terms /
Brokers /
Software /
Holidays /
Stock Split Calendar /
Mortgage Calculator /
Donate
Copyright © 2004-2023, MyPivots. All rights reserved.
Copyright © 2004-2023, MyPivots. All rights reserved.