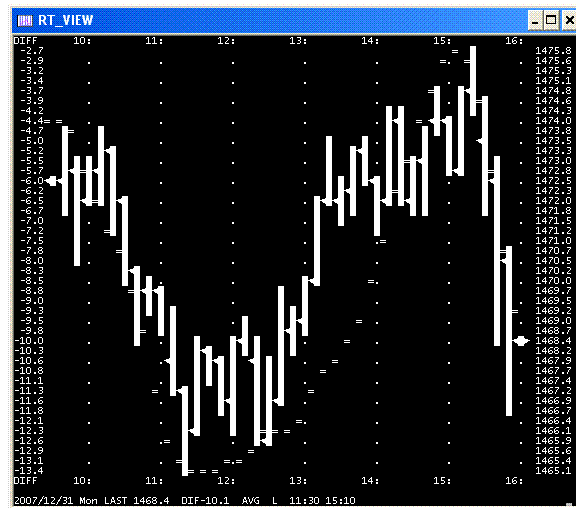
I used alt-printscrn to capture my daily intraday predicts+actual SP plot and then the windows accessory "paint" to paste the clipboard results and then saved my very first gif file a little while ago.
Below chart shows my own predictor program NAILED the intraday movement of SP index on monday 31 dec and goes a long way in confirming that price movement can be VALIDLY predicted using historical data (at least it was monday)..
dave in cocoa beach florida
DA
davegemini
Rep: 100
Posts: 107
Hmmm, so far I'm batting 00 in 08
In the future,
I will refrain from posting any day hilo time prediction thats showing a trade window less that 5 hrs. I expect that will limit my predict charts to about 1/week. Hopefully that will raise my batting average.
In the future,
I will refrain from posting any day hilo time prediction thats showing a trade window less that 5 hrs. I expect that will limit my predict charts to about 1/week. Hopefully that will raise my batting average.
RO
roofer
Rep: 3,689
Posts: 3,574
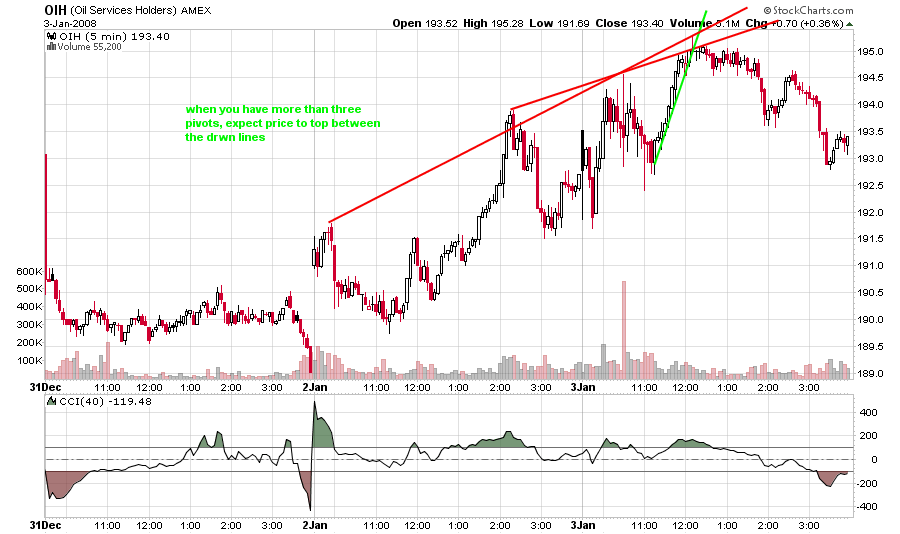
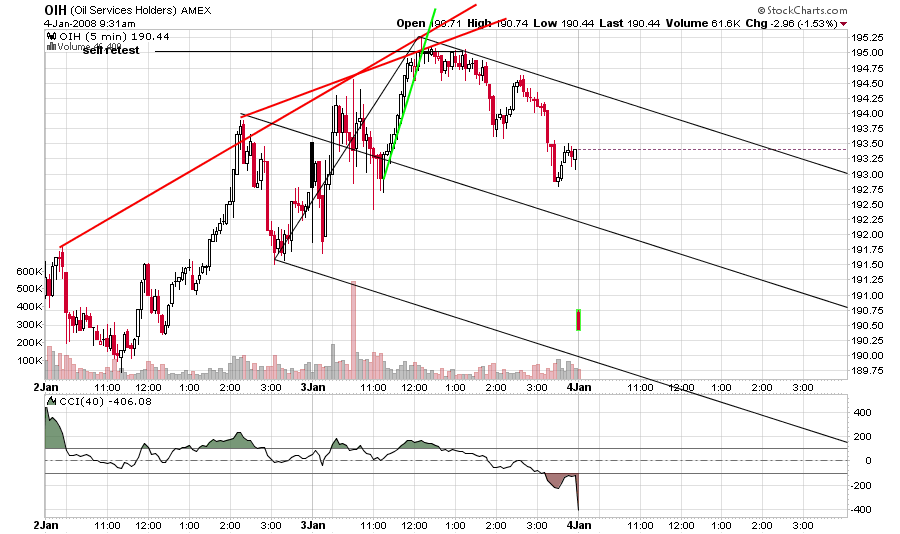
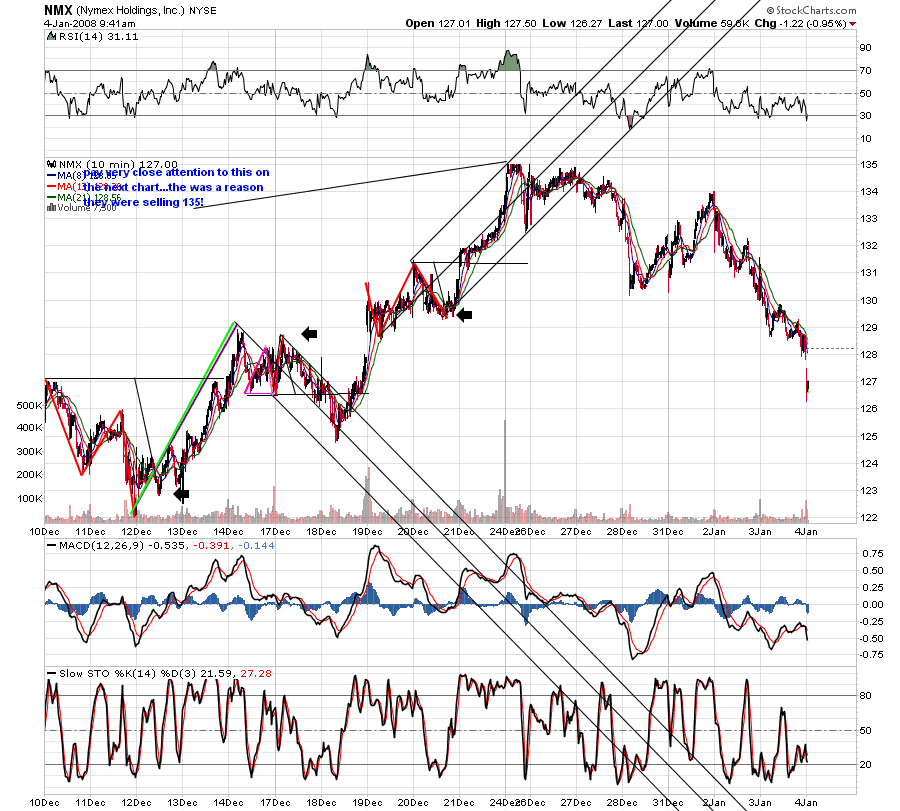
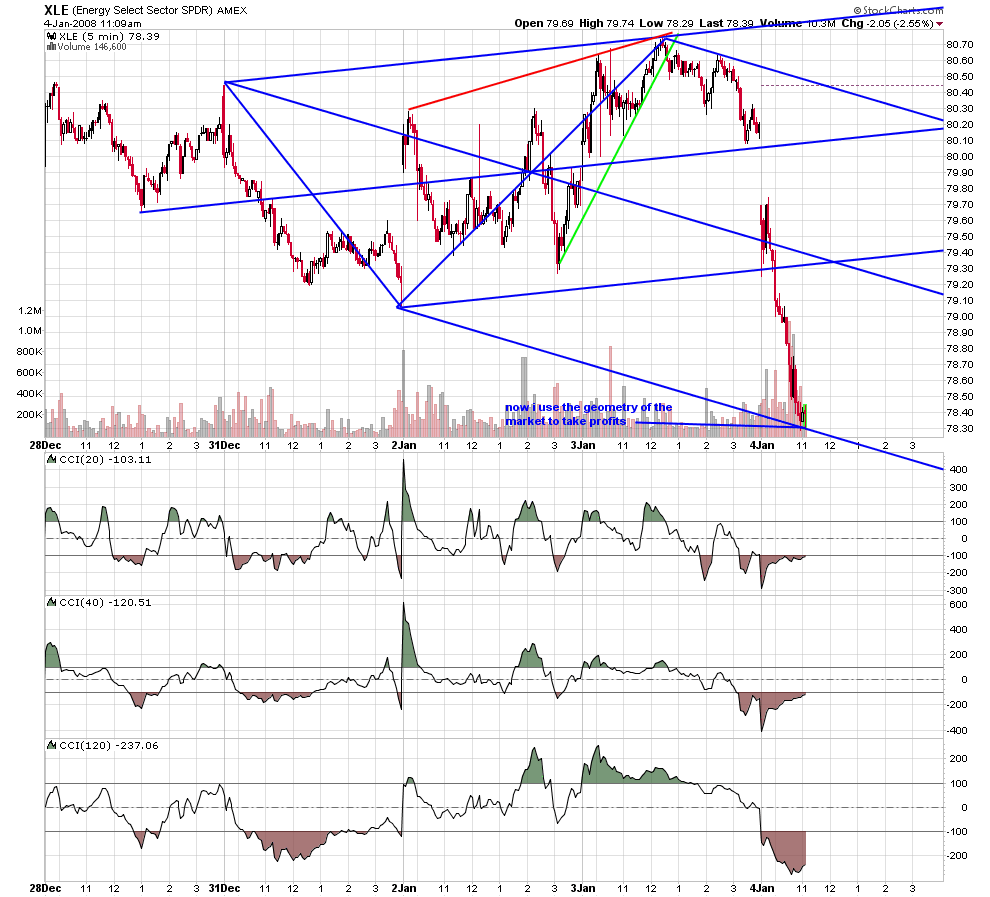
no forcasts just what is. i never know what is going to happen next. but here are two example from yesterdays trading that result from mapping the market in a different way. price at a line from medianline set is important... confluent with red spike line... we go to work... break of green trend line.. trade is on.from the kane traders.