Fading the Value Area
When trading fades off of the value area, do you guys wait for some sort of reversal signal such as a doji before you go ahead with the trade, or do you just have resting limit orders ready to fire off as soon as it hits the level? Also, is there some sort of limit as to how many times to trade off the same S/R level within a given day or should I just trade it as many times as it presents itself?
Thanks again
Thanks again
Hi Brandon,
I prefer to use some kind of Volume thrust with a tick extreme in this kind of volatility. There are many who teach to just go in at the level and use a fixed stop. I've seen anywhere from 1.5 to 4 points but I think this is not valid in high volatility. This would also depend on your profit target and risk levels.
When you see Volume/time coming into the market ahead of a value area level it will quite often signal that the level will hold as many participants have tried to "front-run" the level. You can then look to the TICK indicator for that last thrust of buyers or sellers.
Thursday was a good example as we where rallying higher up into the 48 area but never reached the VA high ( up at 1351 area)...The R1 area was up there and the folks who use twice the IB range as a target where up at that same point...then you had a volume and tick thrust...
Today on Friday you had higher volume and more time spent below the Value area highs...then they took out the overnight highs up at 1342 with a huge volume thrust and a Tick of 1300.....within 4 minutes we were back below the Value area high at 1339
This same thing happened on the lows today...we got a huge volume and Tick thrust below the Value area low and that was the low for the day...so little time spent below the 1325 number. Basically all the volume has run out and there isn't enough to push the market lower in this case.
I've been babbling about this stuff on another thread but interest seems down so I thought I'd take the opportunity to ramble here...lol
Anyway, That's how I see it. Good trades to you.
Bruce
Hey, thanks for the reply Bruce. I'm not sure I understand what you mean by volume thrust and tick extreme, and not even sure what a tick indicator is. Also, what do you mean by Volume/time coming into the market ahead of the Value Area?
I'm looking at Friday's chart, and I see the low you're talking about which, on the 30-min, probed below the VA, was rejected, and closed near its high, and ended up being a buying tail for the day. I also see volume peak on that bar. I have a feeling you're talking about a tick chart rather than a 30-min, but am I on the right track as to what you're saying? Mind Over Markets mentions extremes and excesses, but I don't recall it mentioning tick extremes.
This sounds like important stuff so ramble on all you want to me I'll be taking notes. If you could recommend a book or links that could help shed some light on this for me, I'd sure appreciate it. I'd also be very interested to read over the thread you mentioned if you could please drop me a link to that.
Thanks for your help
Brandon,
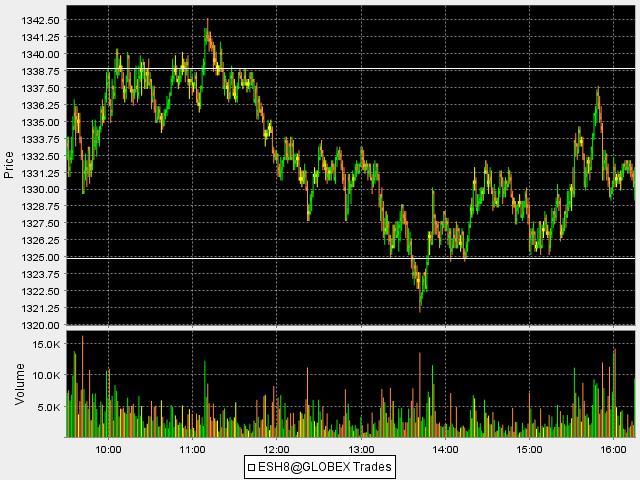
here is the one minute from Friday with a horizontal line snapped at the VA high and low.....Notice the volume surge when we break those lines at 11:08 on the highs and 13:42 on the lows.....How much time is spent beyond those levels once broken? Not much!!!
Now you need to bring up the Tick chart.( this is not volume ..this is $Tick on most feeds ).....here is a quick link for an explaination.
If some one has time perhaps they can post the chart...I'm short on time today..
http://www.daytradingit.com/tick.html
you will see that we hit + 1300 when we attempted to break that VA high and we hit minus 1150 when we broke the VA low....these lows and highs worked the same way on Friday...
The key is to watch volume spikes with Tick spikes....at your key price levels....this concept will work with any entry area that you have defined as an area of interest....
You will notice that we had a volume spike and a minus 900 reading on the TICK at 9:42...this is what I used to get long for the gap fill....on the upside...I had a key number of 1331.....look how that volume spike acted as support briefly when we came back down to it.....then it was resistance (the 1331 area)
Hope that helps...so for monday based on Volume only we have
1337
1330.50
1322 - 1323.75
as key levels if we are trading inside the range of fridays bar..
Bruce
Click image for original size
Thanks for the explanation Bruce. This looks like a very handy indicator indeed. The logic behind this makes sense and I'm anxious to try it out. So the $Tick just tracks the NYSE and can be used on the S&P correct, or is there one that tracks the stocks on the S&P? Are there any other indicators you use? I've been studying price only but wouldn't mind implementing some worthwhile indicators into my strategy.
I appreciate your help
I appreciate your help
Emini Day Trading /
Daily Notes /
Forecast /
Economic Events /
Search /
Terms and Conditions /
Disclaimer /
Books /
Online Books /
Site Map /
Contact /
Privacy Policy /
Links /
About /
Day Trading Forum /
Investment Calculators /
Pivot Point Calculator /
Market Profile Generator /
Fibonacci Calculator /
Mailing List /
Advertise Here /
Articles /
Financial Terms /
Brokers /
Software /
Holidays /
Stock Split Calendar /
Mortgage Calculator /
Donate
Copyright © 2004-2023, MyPivots. All rights reserved.
Copyright © 2004-2023, MyPivots. All rights reserved.