On the upside !!
Yesterday was a 90% down volume day so on the upside I'm watching the following areas...
ES
1290.75 - 92.75
1297.50 - 1299.75
1307.50
For the NQ I just have one big zone at
1872.50 - 1879
on YM
11522 -11527
11580 - 11600
11650 - 11675
Hope fully we'll get a retest on upside to see what happens
I'm not in the doom and gloom mode..my secret magic bullet indicator tells me that a correction to the upside will unfold but we still need to get through those key areas....as usual the volume, Ticks and number off the open print will guide the way
Good luck today
Bruce
with an open price of 85.25 the plus 4 - 5.5 get us into the first resitance zone...so if we can get a volume spike and tick extreme then we may have a good short
with the spike down and the low tick reading I was forced to take the long signal at the minus 4 area...1285 which is opening range low..would be ideal retest area..this is a harder trade as we have tested the VA low already on the upside...still we had a minus 900 and minus 800 tick reading and volume spike..
EDIT: I added the 1285 retest info
EDIT: I added the 1285 retest info
best for me is the 1286.25...volume spike in here but no high tick....not sticking around as that was high volume on open range and at Opening range high....hope all could see that one in action...scary sometimes when so much gloom an opinions in the market
hey bruce. how do you feel about a short around the 1292 area? its todays pivot and close to overnight high?
I shorted the plus 4 and plus 5.5 and covered at 87.50 and have nothing working...I may have been a bit early to cover but my thinking is this:
The first trade using this method is usually the better trade so any additional trade is higher risk....in this case we run the risk of having support develop first at the low...
Looking at the setup...:
We rally into a key number zone ( in the ES and NQ) with high ticks and that big volume spike...nothing more needs to be said...you either take the trade or don't
Unfortunately this never came..at least not yet..not sure I would like to see a new high to fade into that 92 area...
For me I like the key numbers ( these are generated from yesterdays high volume areas)and the open numbers ( adding plus 4 and 5.5 to the open of 1285.25)...it is certainly possible that the big volume spike were folks front running that pivot number...
I would prefer to take the trade the first time....an additional test would make me a bit leary......follow the volume and ticks and it may help...be careful
Sorry I can't be of more help
Bruce
quote:
Originally posted by ksaieh
hey bruce. how do you feel about a short around the 1292 area? its todays pivot and close to overnight high?
Many times you will see a high volume bar at the open...this makes sense but I only use that as a guide on exits...on this chart if you omit the first minute then you can see the high volume spikes....at the current highs and lows of the day..the trick is to fiqure out if someone is exiting or entering agressively...so the addition of the Ticks helps although the numbers based off the open print can work on their own.
Most won't use this method because it isn't very fancy and traders like to complicate things. They just don't believe in the method so it probably won't work for them.
Most won't use this method because it isn't very fancy and traders like to complicate things. They just don't believe in the method so it probably won't work for them.
Click image for original size
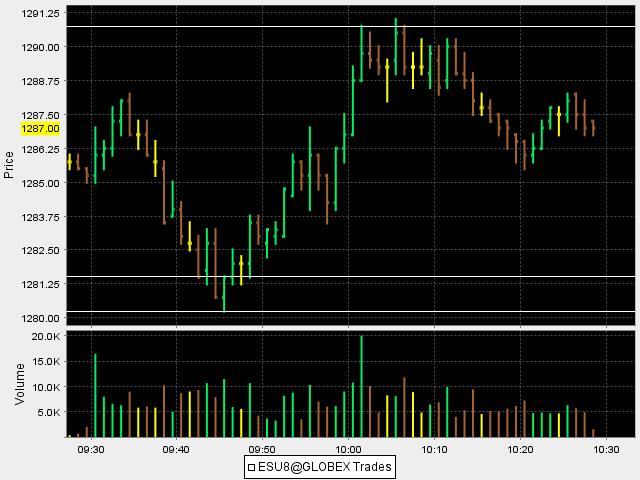
additional concern about the possible 92 short is that we will be above the high volume bars of the day, above the open, above the VA low and they might try to get the plus 8 - 10 points off the open on upside
the dow is the weakest as I type....this should lead to choppy trade until that gets resolved...it's certainly possible that they could all rollover after testing the resitance zones but the dow is breaking the 60 minute low but not the ES or NQ so I would expect an additional rally attempt..we also hit a minus 1100 ticks on downside....
quote:
Originally posted by BruceM
Many times you will see a high volume bar at the open...this makes sense but I only use that as a guide on exits...on this chart if you omit the first minute then you can see the high volume spikes....at the current highs and lows of the day..the trick is to fiqure out if someone is exiting or entering agressively...so the addition of the Ticks helps although the numbers based off the open print can work on their own.
Most won't use this method because it isn't very fancy and traders like to complicate things. They just don't believe in the method so it probably won't work for them.
Volume reading is both above all the most validating, and the farthest lagging of all indicators, imho. Charles Dow even claimed that when seeing value in the markets (or a stock), if volume doesn't confirm the movement (a confirmation in an attempt on a stage or change of trend within $INDU and $TRAN), then it is just noise from daily flucuations (perhaps from a solitary, but over-agressive investor).
The best indication, but it can only be used in hindsight, is whether or not a large spike is exhaustion; and seeing that the chart given dropped by 50% while going higher, and sellers promptly gained control, it was just that. The question is for how long will sellers have the edge.
My super duper but highly lethal and secretive indicating ace-in-the-hole claims the markets will lay down and consolidate and the breakout will be strong, but short-lived, to the upside; to precisely the same areas you've mentioned. We'll breach 1297, but sellers will hold 1300. Then, we're onto the last stage of the bear trend. 1250 is as good as violated and won.
I'm expecting this market to roll over from up at the 1267 area. On Friday the cash dow was the leader while the Nasdaq tanked big and the S&P cash was barely at breakeven....The days that follow this type of divergence are usually the better days to fade gaps up in price...I beleive there trying to run longs in and we may even see an outside bar to the downside today on the S&P futures.....that's my daily prediction....lol
Emini Day Trading /
Daily Notes /
Forecast /
Economic Events /
Search /
Terms and Conditions /
Disclaimer /
Books /
Online Books /
Site Map /
Contact /
Privacy Policy /
Links /
About /
Day Trading Forum /
Investment Calculators /
Pivot Point Calculator /
Market Profile Generator /
Fibonacci Calculator /
Mailing List /
Advertise Here /
Articles /
Financial Terms /
Brokers /
Software /
Holidays /
Stock Split Calendar /
Mortgage Calculator /
Donate
Copyright © 2004-2023, MyPivots. All rights reserved.
Copyright © 2004-2023, MyPivots. All rights reserved.