My Elliot Count
Been all over it:
Click image for original size

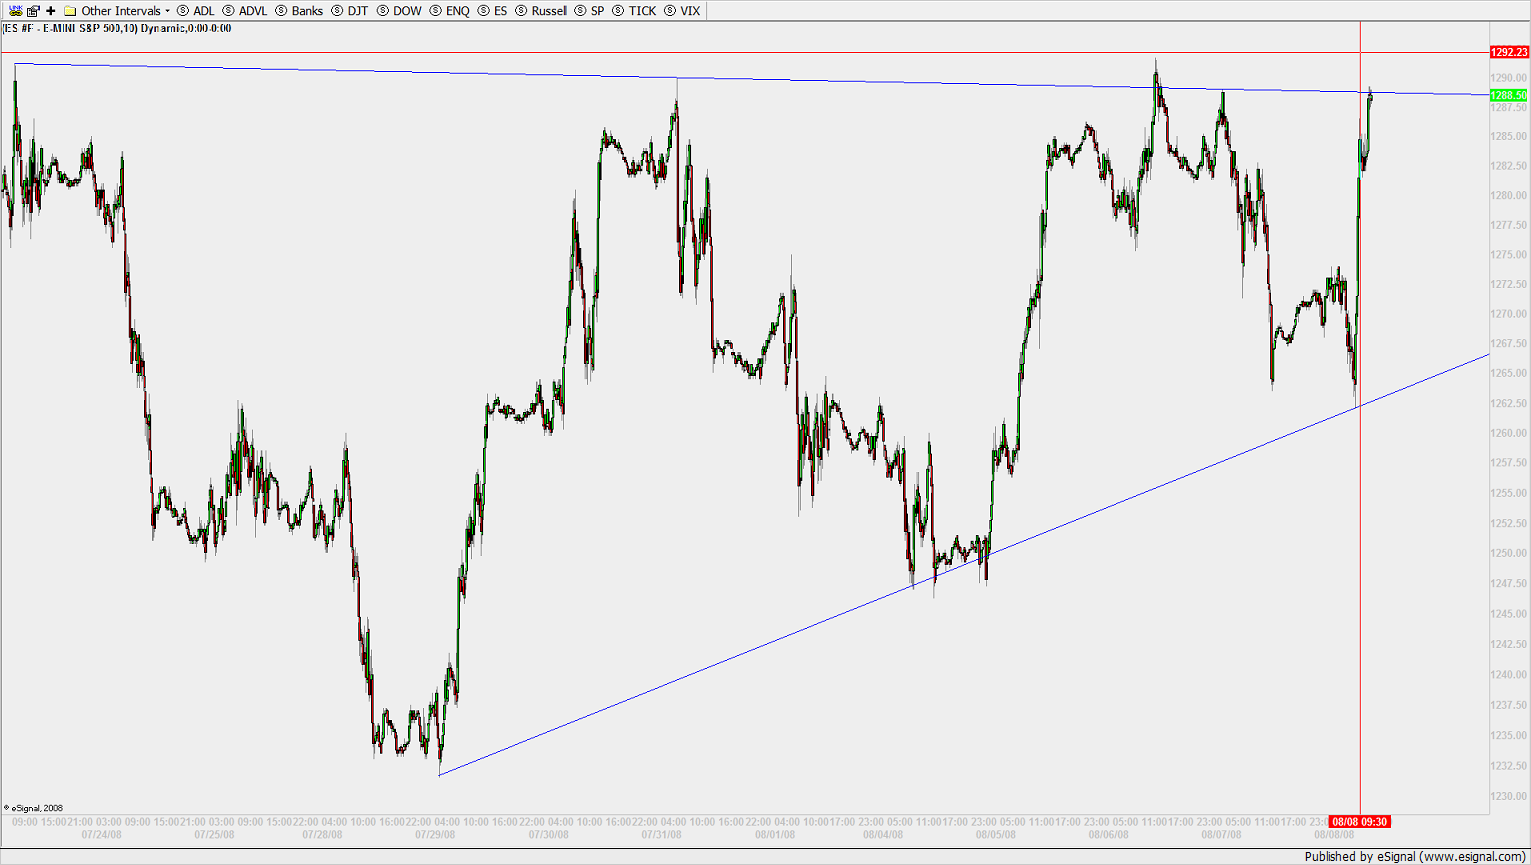
I didn't have my channel at the base high enough on C/1 Wave of 2. Mechanical entries and/or exits sparked this last bounce, coupled with it being the end of session. It's not holding up too bad in after hours either. I'm going to go out on a limb here and call this impulse 2. The 240 minute shows buyers having made support out of: the 55 EMA, 144 EMA, 200 DWMA (leading two bars) and the 60 shows a clear definition of a regular ABC having bottomed. The 10 minute's DWMA confirms the ascending triangle breakout setup sloped at 45° and 10 points from 47 and 57.
I'm GTC long ES 1267.75, 1% initial stop targeting 1299 (377 EMA). I'll gladly be wrong here for the potential reward. The momentum continuation divergence looks good; the bounce happened to the tick at .618 of 1247 and if it gets by me I know the trend baseline entries waiting at 57 likely will put me at a decent price at the first minor pullback. I'll gauge strength then.
I'm liking it.
Bear, bull, bear, bull...the bear, for now:
Click image for original size
Great analysis - thanks!
Emini Day Trading /
Daily Notes /
Forecast /
Economic Events /
Search /
Terms and Conditions /
Disclaimer /
Books /
Online Books /
Site Map /
Contact /
Privacy Policy /
Links /
About /
Day Trading Forum /
Investment Calculators /
Pivot Point Calculator /
Market Profile Generator /
Fibonacci Calculator /
Mailing List /
Advertise Here /
Articles /
Financial Terms /
Brokers /
Software /
Holidays /
Stock Split Calendar /
Mortgage Calculator /
Donate
Copyright © 2004-2023, MyPivots. All rights reserved.
Copyright © 2004-2023, MyPivots. All rights reserved.