rrrr
Our analysis, our strategizing setups, planning entries and exits are ever-evolving and if comparing one subset of analysis to one another, rarely do they not contradict. So in saying I should add a bit of a disclaimer here: my thinking outloud, my calls, whether they are a product of hard work or simply pure, unadulterated luck; my bias of setups gleaned perhaps having too much vested interest in analysis; on any given day my analysis is subject to change pursuant of additional analysis. I'm not a professional trader and while I do make a very good living at it my intention here is only to offer ideas of probability, comradrery with fellow traders and yes to be taught some things I may not be aware I lack. Tact is probably one of them.
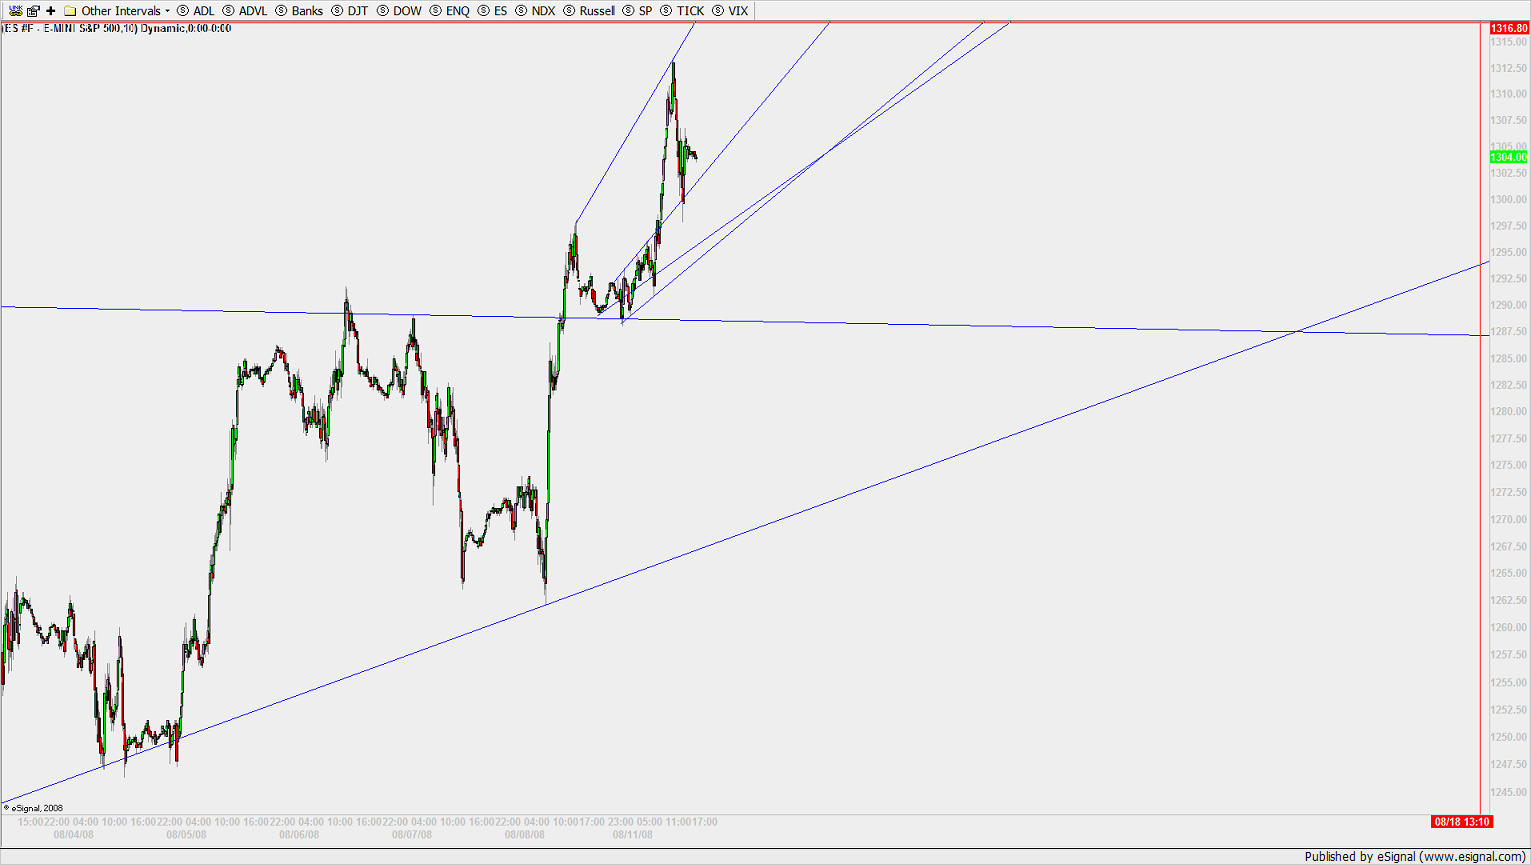
At any rate, I've made some pretty damn good calls in my short time here, whether you regarded them as interesting for entertainment purposes or perhaps have traded a few of them, I rather it be the former.
I came across an alternative to my perma-bear outlook.
This bull run while seeming to struggle at the beginning, has made a new trend line off of the 2nd impulse 1st wave thrust I called. Not only that the correction of the channels in the C wave before the 1st began has proven to point in offering buying support on this 4th wave and ABC off of the 5th that should have absolutely killed half of this run in one session.
The other thing I came across after the close was an alternate wave count in the daily that could justify this run. Admittedly there's some semblance of confusion among Ellioticians pertaining how many waves a bear market correction is supposed to have. Purists name three, and a bull five; but purists remain comfortably oblivious in ignoring the fact that we, to include Elliot in his time, never have known anything other than the bull.
There are 5 complete waves from last October, a failed thrust on a second impulse and a correction having begun from 1200 that in essence is but the 1st impulse's 2nd wave pullback, or it could be a bull market. The problem with this, despite contradicting the theory, lest from October was a double zig-zag ABC, is in distinguishing whether or not the 1st thrust of the 2nd impulse wave was an A wave irregular correction, if it's a bear B wave regular correction that could end like any second, or if we're in the market's 2nd impulse bull thrust, in which case would lead to new market highs. If it's a B wave irregular correction of a double-zig zag correction from October, we could run up to 1441 this run, and back down to 1200 the next.
To say it's confusing would be too patently obvious of an understatement. On top of that, I have in the daily a continuation sell signal that fired off with precision when and how I knew it would, but went dead.
Quite honestly, the way I see it now, I wouldn't hold anything longer than a half of a measured minor swing in an intraday chart for atleast two years. I personally don't trust the FED designed bottom to hold. It didn't in May. It didn't under Greenspan either.
All I know is I'm scalping. What's funny is that what I call scalping most of you probably call swing. Anyway, thanks for reading.
At any rate, I've made some pretty damn good calls in my short time here, whether you regarded them as interesting for entertainment purposes or perhaps have traded a few of them, I rather it be the former.
I came across an alternative to my perma-bear outlook.
This bull run while seeming to struggle at the beginning, has made a new trend line off of the 2nd impulse 1st wave thrust I called. Not only that the correction of the channels in the C wave before the 1st began has proven to point in offering buying support on this 4th wave and ABC off of the 5th that should have absolutely killed half of this run in one session.
Click image for original size
The other thing I came across after the close was an alternate wave count in the daily that could justify this run. Admittedly there's some semblance of confusion among Ellioticians pertaining how many waves a bear market correction is supposed to have. Purists name three, and a bull five; but purists remain comfortably oblivious in ignoring the fact that we, to include Elliot in his time, never have known anything other than the bull.
There are 5 complete waves from last October, a failed thrust on a second impulse and a correction having begun from 1200 that in essence is but the 1st impulse's 2nd wave pullback, or it could be a bull market. The problem with this, despite contradicting the theory, lest from October was a double zig-zag ABC, is in distinguishing whether or not the 1st thrust of the 2nd impulse wave was an A wave irregular correction, if it's a bear B wave regular correction that could end like any second, or if we're in the market's 2nd impulse bull thrust, in which case would lead to new market highs. If it's a B wave irregular correction of a double-zig zag correction from October, we could run up to 1441 this run, and back down to 1200 the next.
To say it's confusing would be too patently obvious of an understatement. On top of that, I have in the daily a continuation sell signal that fired off with precision when and how I knew it would, but went dead.
Quite honestly, the way I see it now, I wouldn't hold anything longer than a half of a measured minor swing in an intraday chart for atleast two years. I personally don't trust the FED designed bottom to hold. It didn't in May. It didn't under Greenspan either.
All I know is I'm scalping. What's funny is that what I call scalping most of you probably call swing. Anyway, thanks for reading.
Emini Day Trading /
Daily Notes /
Forecast /
Economic Events /
Search /
Terms and Conditions /
Disclaimer /
Books /
Online Books /
Site Map /
Contact /
Privacy Policy /
Links /
About /
Day Trading Forum /
Investment Calculators /
Pivot Point Calculator /
Market Profile Generator /
Fibonacci Calculator /
Mailing List /
Advertise Here /
Articles /
Financial Terms /
Brokers /
Software /
Holidays /
Stock Split Calendar /
Mortgage Calculator /
Donate
Copyright © 2004-2023, MyPivots. All rights reserved.
Copyright © 2004-2023, MyPivots. All rights reserved.