Identifying consolidation periods
Hi all,
I have little (= understatement, ) trouble identifying consalidation periods on candle stick charts.
How do you guys regonize the beginning and end of one best ?
Thanks
I have little (= understatement, ) trouble identifying consalidation periods on candle stick charts.
How do you guys regonize the beginning and end of one best ?
Thanks
u start with trendlines ,you might use weekly,then daily then hourly then 30 min,then 15,then 5,u see where there is supp and res,then you see where it was stuck in a range for several bars,that is your congestion area,you can scalp for small profits with tight stops or wait for it to move away from the area
On the candlestick chart you will see longer shadows and alternating colors from one candle to the next. Candle bodies will have a lot of overlap from one candle to the next. This all indicates price has become caught in a range as neither the buy side nor the sell side can take control of price direction.
In a slightly bigger picture sense, you will need to learn the basic consolidation price patterns. Triangles, Flags and trading ranges are the basic patterns to learn. Generally volume will contract as price consolidates.
In terms of the traditional technical indicators: Moving averages tend to flatten out and collapse inward towards each other as price swings narrow around the moving averages. Bollinger bands will narrow and collapse inward back toward a flat middle band. The MACD indicator it will move back towards the zero line. The ADX indicator will trend down below the 20 level. These are all basic indications of price consolidation.
Good explaination pt emini. One of the ways to trade this region is to enter the reverse of what the MACD indicates. If you get a bullish cross from the cross of the fast and slow moving averages on the MACD, go short and viceversa. The zero line cross by the MACD has no significance. But remember Profit can be very narrow and never place buy/sell market orders as the slippage will get you. So better is to join bid/ask.
You can use a regression channel indicator with width 1.5 and 2.0. If the band is less than 2pts, the risk/ratio is not attractive to put your effort.
Even scalpers will look for at least 2pts.
Even scalpers will look for at least 2pts.
Lordalfa, the standard setting for the linear regression bands is 150/1/2. Now do you suggest we change them to 150/1.5/2 or some other setting??? Also do we use it on a 1 min chart??? This will generate 5 lines. A center line and two lines on the top and two below. Now how do we decide the 2 point distance. Do we use use the first line on top and first line below, or the second line.....
Yes 5 lines.
Depends if the slope is down or up.
Sloping down, short is safer. Sloping up, long. Short sell at in between top band. Long buy at in between low band.
Only used this when I see a channel formed. Otherwise, doesn't help much. If the band of opportunity is small, I'll not even trade.
Depends if the slope is down or up.
Sloping down, short is safer. Sloping up, long. Short sell at in between top band. Long buy at in between low band.
Only used this when I see a channel formed. Otherwise, doesn't help much. If the band of opportunity is small, I'll not even trade.
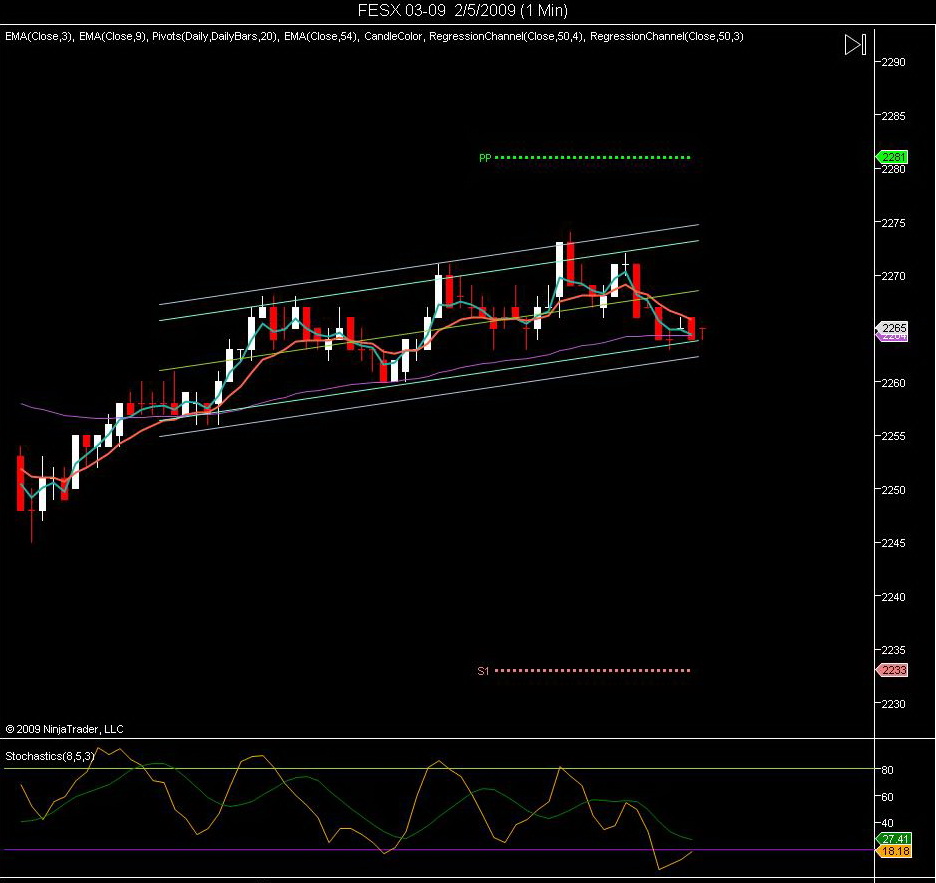
This is for the FESX.
I doubled the width to 3 and 4.
1.5 and 2 did not look good on the FESX. The window of opportunity is too small for the trade.
Short signals.
Channel must slope down
Price in between top white and cyan band.
Stochastics 8,5,3 pierce or touches 80.
Long
Channel must slope up
Price in between low white and cyan band.
Stochastics 8,5,3 pierce or touches 20.
In this chart. You go long.
Click image for original size
Yes I see what you mean, I also observed that you are using a setting of 50/3/4 instead of 150/1.5/2. This is like a moving stochastic on the chart. Do you trade the Emini S&P, if yes what settings do you recommend for it???
Emini Day Trading /
Daily Notes /
Forecast /
Economic Events /
Search /
Terms and Conditions /
Disclaimer /
Books /
Online Books /
Site Map /
Contact /
Privacy Policy /
Links /
About /
Day Trading Forum /
Investment Calculators /
Pivot Point Calculator /
Market Profile Generator /
Fibonacci Calculator /
Mailing List /
Advertise Here /
Articles /
Financial Terms /
Brokers /
Software /
Holidays /
Stock Split Calendar /
Mortgage Calculator /
Donate
Copyright © 2004-2023, MyPivots. All rights reserved.
Copyright © 2004-2023, MyPivots. All rights reserved.