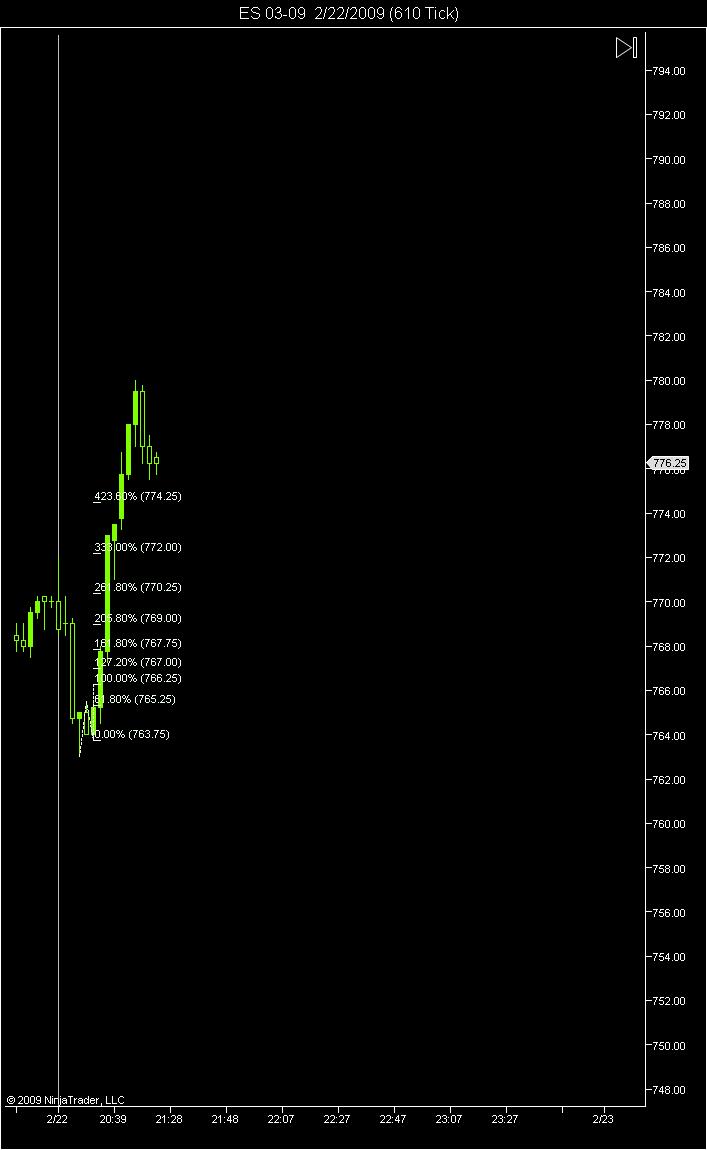
Charts 2-22-09
3 hours into Globex open
61.8% retrace to the tick of the down leg since Thu high of 797.00
Click image for original size
61.8% retrace to the tick of the down leg since Thu high of 797.00
Click image for original size
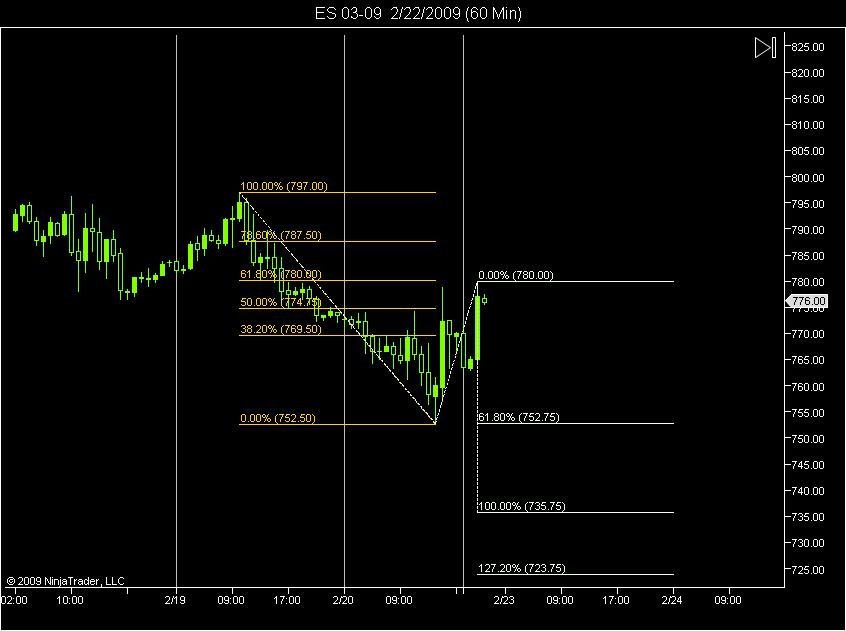
Click image for original size

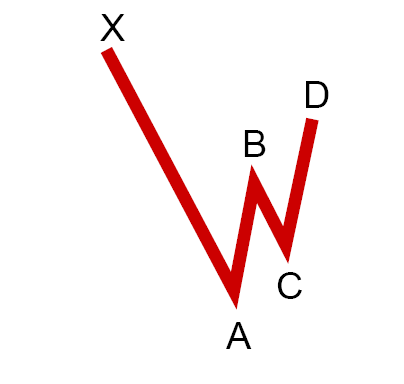
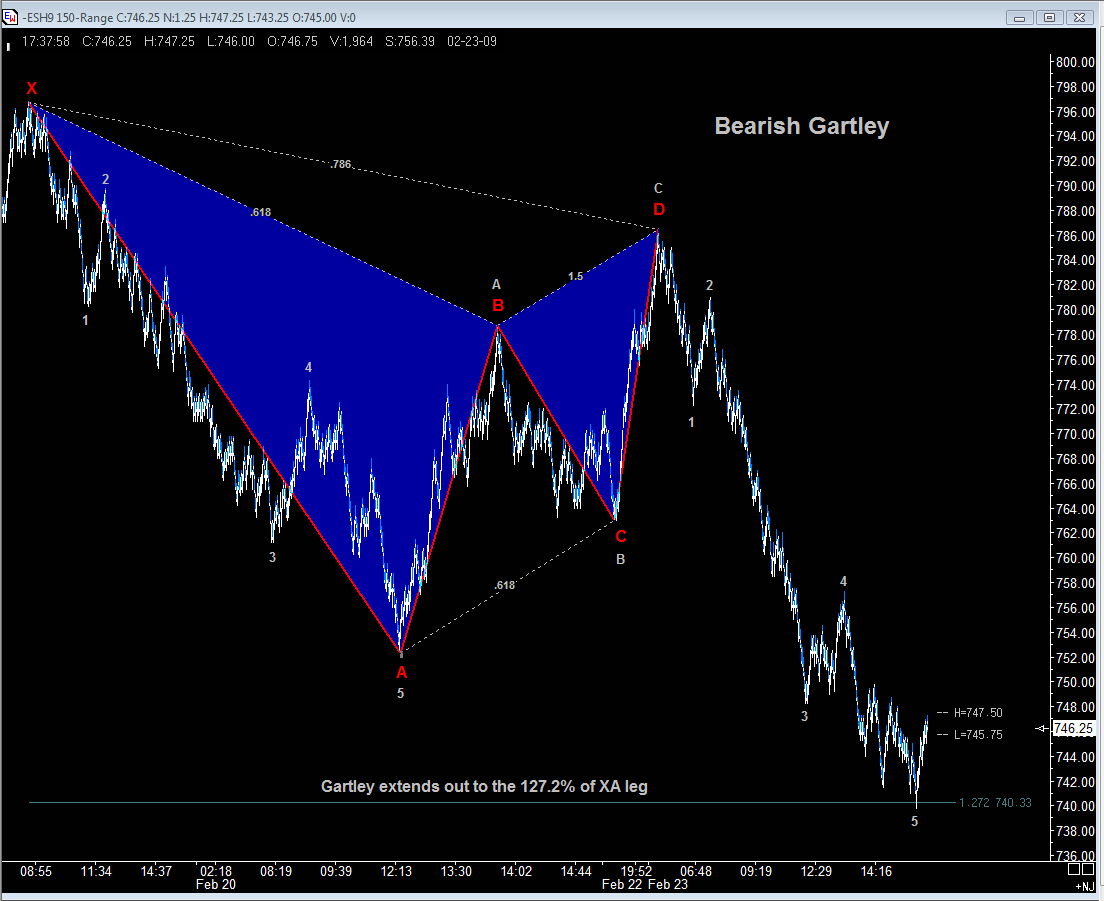
Bearish Gartley?
Click image for original size
Click image for original size
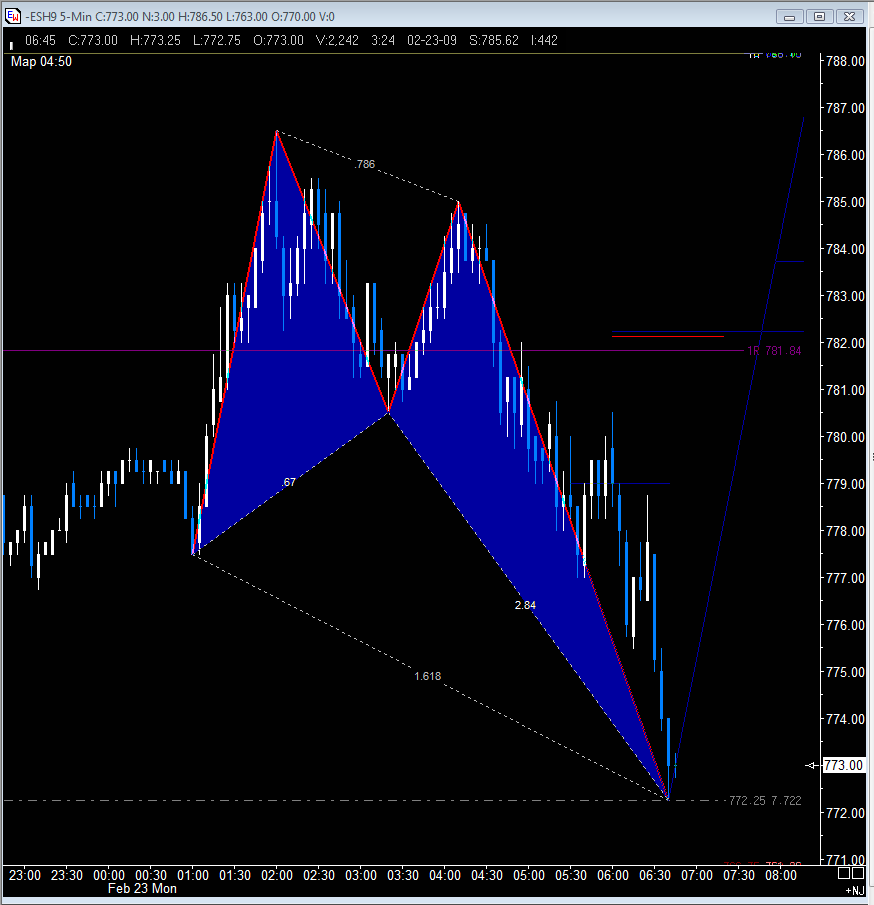
yes LA...Gartley and the confluence zone was hit. Above is Bullish Crab on 5m.
Click image for original size
Sorry my retracement was drawn in reverse. It is short of 1 tick to 61.8% retrace.
If you were short since 0520 to 0530, you have made a lot.
Really weak market. Really FUBAR.
Really weak market. Really FUBAR.
Click image for original size
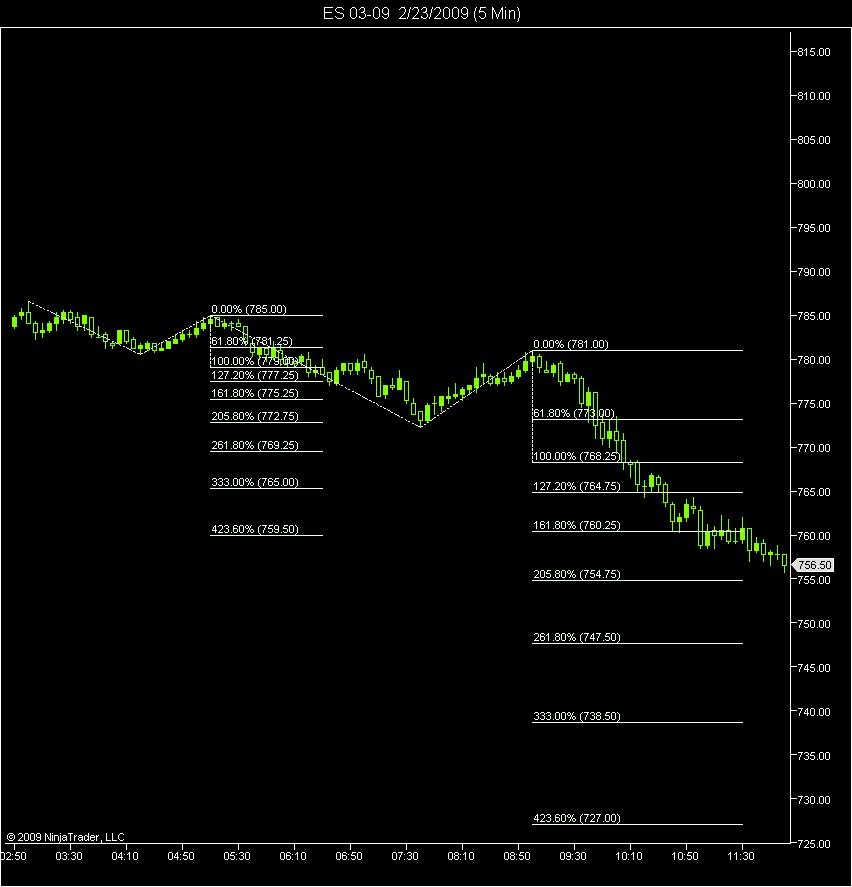
Here is how this Bearish Gartley from the above post has played out so far. I have also included the current wave count from this chart period (1 1/2 point range). The count is unusually clean and easy to spot.
Click image for original size
Biggest loser last night as I tried to look for that long. -18. PT got crushed too. The winners are those who didn't take the trade. The biggest winner is palmer at +17. He went short I think.
The bottom didn't come and maybe it did at pit close.
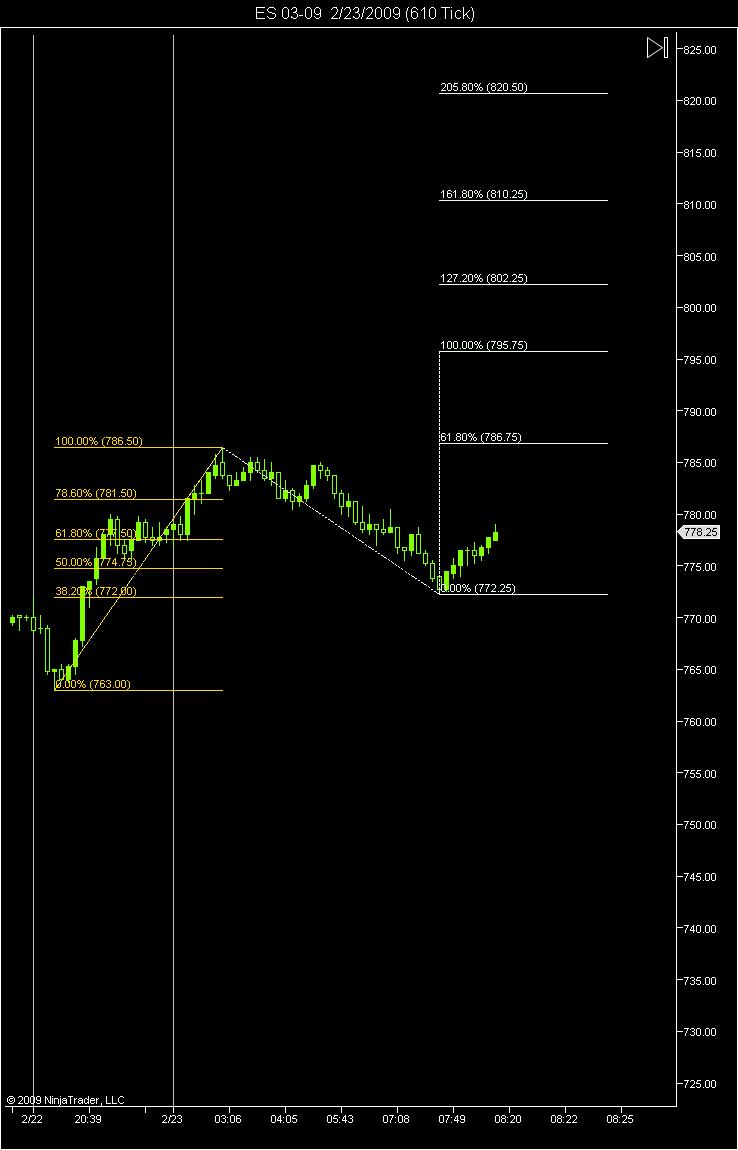
Could we be seeing another bearish Gartley pattern coming up? Looks like a new X-A leg. How much retrace are we looking at to form B?
The bottom didn't come and maybe it did at pit close.
Could we be seeing another bearish Gartley pattern coming up? Looks like a new X-A leg. How much retrace are we looking at to form B?
Emini Day Trading /
Daily Notes /
Forecast /
Economic Events /
Search /
Terms and Conditions /
Disclaimer /
Books /
Online Books /
Site Map /
Contact /
Privacy Policy /
Links /
About /
Day Trading Forum /
Investment Calculators /
Pivot Point Calculator /
Market Profile Generator /
Fibonacci Calculator /
Mailing List /
Advertise Here /
Articles /
Financial Terms /
Brokers /
Software /
Holidays /
Stock Split Calendar /
Mortgage Calculator /
Donate
Copyright © 2004-2023, MyPivots. All rights reserved.
Copyright © 2004-2023, MyPivots. All rights reserved.