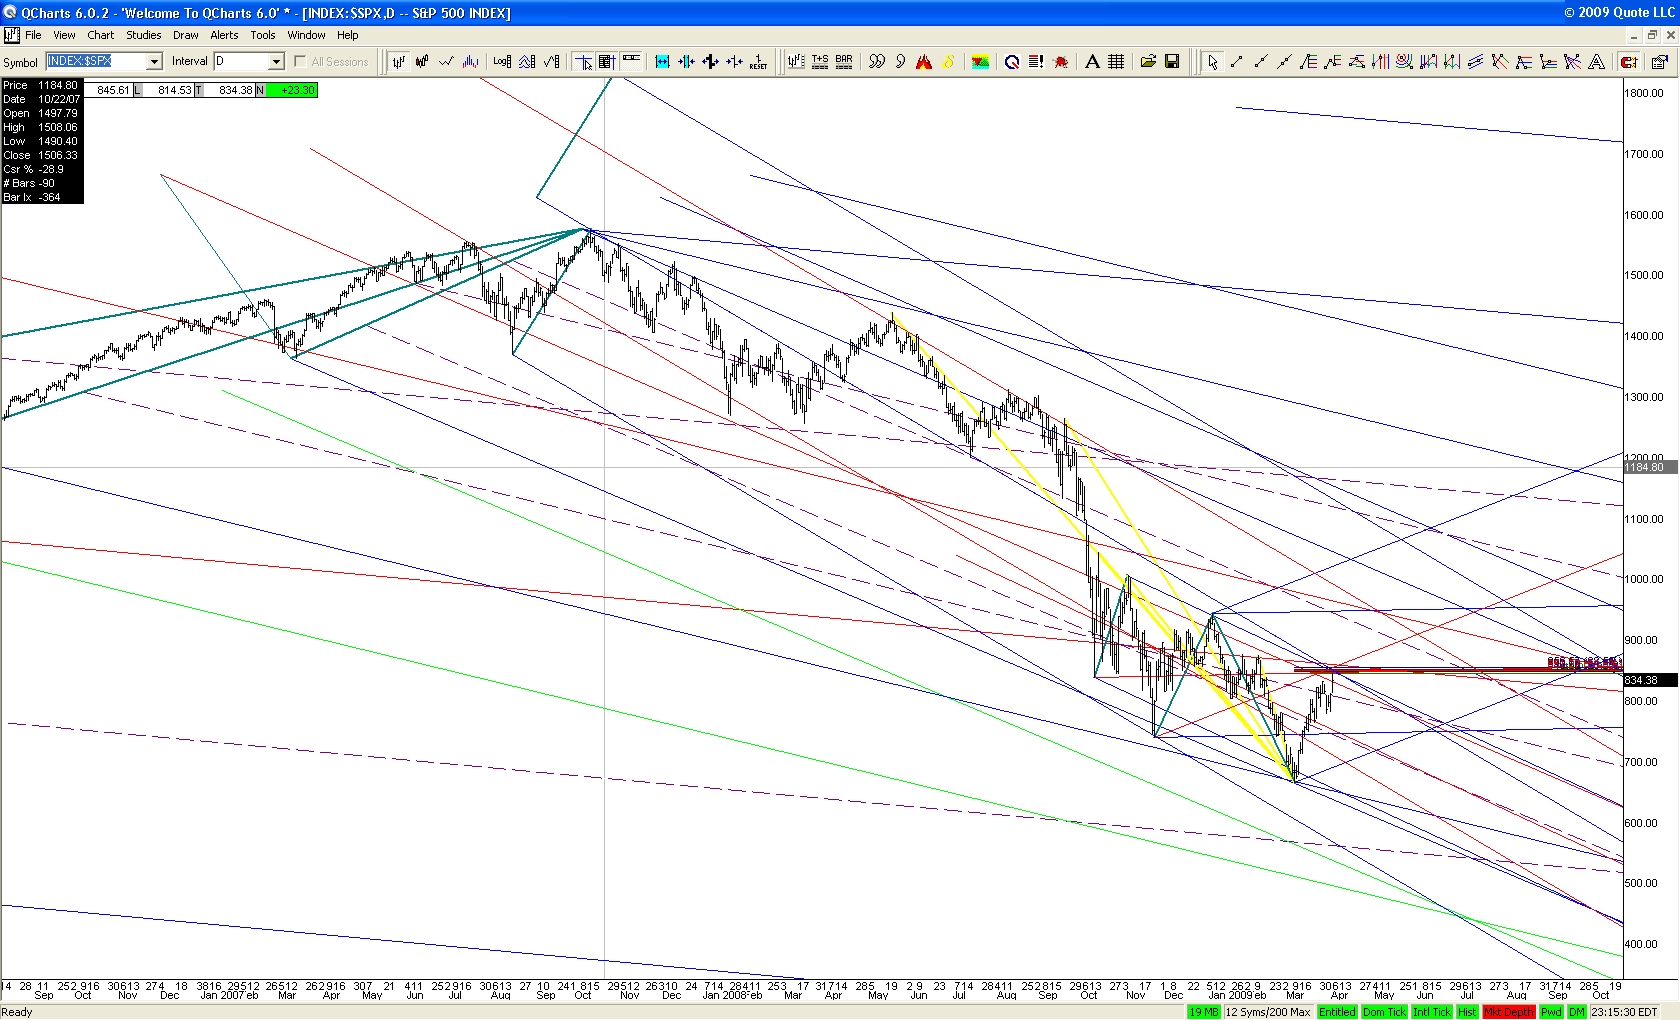
I would certainly expect more of a bounce here before this wave 3 continues, but this thing really looks like it is in trouble.
JI
jimkane
Rep: 3,058
Posts: 33,089
quote:So, is this the start of 'wave 4', and then down into the lower area, as I showed with the INDU in the last commentary? In the S&P: 1.272 off the bull, at the big weekly natural set division line, with the bigger 'wave 1' off the Oct '07 top comparison move (look at the 1.000 and 1.128 comparisons), and the external retracements off the bigger 'wave 4'. That would be really sweet. The reason I think we go lower is all the bottom calls by the 'big names' with lots of media and blog coverage, all timed perfect. I've yet to ever see calls like that 'work'. We'll see. One thing is for sure, the trading is insane!
Originally posted by TonyC
just some thoughts,I suspect that this has one more 'medium' bounce and roll move in the works here, to set up a climax maybe.
I could picture a w4-w5 roll with the last daily 4PC pattern(the last one discussed in the forum's hot topic) being wave2.
T
JI
jimkane
Rep: 3,058
Posts: 33,089
Now we see if Kass and Larry P. and Marc Faber (hey, wasn't that awhile back, now he's on TV again reiterating it), and Carl Futia, and everyone I have ever seen or heard is right. Even a stopped clock is right twice a day. If you say every day we will have a big rally, you'll be right, as you guess all the way down. Just unreal...
MR
mreiserer
Rep: 110
Posts: 2,220
quote:
Originally posted by jimkane
quote:So, is this the start of 'wave 4', and then down into the lower area, as I showed with the INDU in the last commentary? In the S&P: 1.272 off the bull, at the big weekly natural set division line, with the bigger 'wave 1' off the Oct '07 top comparison move (look at the 1.000 and 1.128 comparisons), and the external retracements off the bigger 'wave 4'. That would be really sweet. The reason I think we go lower is all the bottom calls by the 'big names' with lots of media and blog coverage, all timed perfect. I've yet to ever see calls like that 'work'. We'll see. One thing is for sure, the trading is insane!
Originally posted by TonyC
just some thoughts,I suspect that this has one more 'medium' bounce and roll move in the works here, to set up a climax maybe.
I could picture a w4-w5 roll with the last daily 4PC pattern(the last one discussed in the forum's hot topic) being wave2.
T
I don't care if this is dumb but I don't understand half of what you are saying with regards to the S&P technicalities.
If it bounces here I would see it go down to the 550 area
TO
TonyC
Rep: 99
Posts: 471
Jim,
yes the 1.27 ret off oct'07 with the div. line is really nice. I have it on my charts too.
Given the scale and magnitude of the bull/bear trends over the last decade, the range between each retracement level is quite significant, about roughly 120 SP500 points. I'd have to assume that each fib level when reached is being 'seen' and tradable. So I just focus on triggers and executions. My trade management plan just takes care of the inner doubts I may have after entry. No second guessing just execute, period. Just let it roll 'til taken out. Then on the next roll, if that happens, I reset and reload for the next area.
What I mean is that if I am trading a valid reversal area where a new trend may start from then my reward expectation is for catching something more significant than just a single thrust off that area. I am then attempting to catch a full new trend therefore I plan to give back all of the first single thrust move if it rolls over and stops me out.It's an all or nothing approach of sort.Of course I have my own twist in my management plan.
So, although the 1.27 area is very nice, should I ignore the 1.12 level then? to me it looks like it's 120 s&p points away and quite some times to wait for the price action to get there.If it ever gets there. I am willing to take repeated calculated shots at this in order to catch 'it'(the bottom, oh blasphemy...).
M, sorry.I didn't mean to confuse you.But yes u r right the next area is near 550 . what I am referring u to is the giant DTabcd pattern formation from 2000 top to Now. use monthly or even quarterly charts to look at it in context. So basically the ext fib areas 1.12-1.27 etc that we were talking about are the DT's completion areas.and the linse are from the pattern sets. You can then add more factors to the potential completion areas for added synergy etc. Nothing too obscure about that, I hope.
T
T
JI
jimkane
Rep: 3,058
Posts: 33,089
quote:
Originally posted by mreiserer
quote:
Originally posted by jimkane
quote:So, is this the start of 'wave 4', and then down into the lower area, as I showed with the INDU in the last commentary? In the S&P: 1.272 off the bull, at the big weekly natural set division line, with the bigger 'wave 1' off the Oct '07 top comparison move (look at the 1.000 and 1.128 comparisons), and the external retracements off the bigger 'wave 4'. That would be really sweet. The reason I think we go lower is all the bottom calls by the 'big names' with lots of media and blog coverage, all timed perfect. I've yet to ever see calls like that 'work'. We'll see. One thing is for sure, the trading is insane!
Originally posted by TonyC
just some thoughts,I suspect that this has one more 'medium' bounce and roll move in the works here, to set up a climax maybe.
I could picture a w4-w5 roll with the last daily 4PC pattern(the last one discussed in the forum's hot topic) being wave2.
T
I don't care if this is dumb but I don't understand half of what you are saying with regards to the S&P technicalities.
If it bounces here I would see it go down to the 550 area
M,
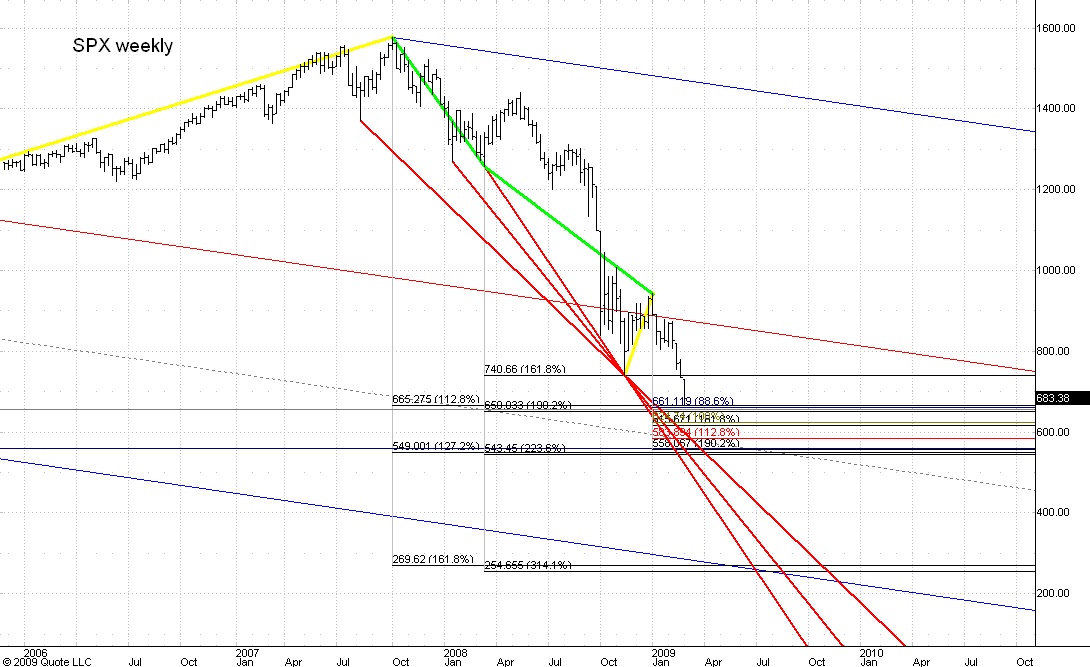
Let me see if I can help you, and all the readers, with what we are saying here. Look at this chart first.
First off, I just put the red trendline (potential spike?) lines on there to guide the eye. If you follow the green line off the top, and refer to my chart in the last commentary for counts, you see I started at 'wave 1' off the top, and then did the final projection point (as you follow the green line down) off this last move ('wave 4') down. I then did an .886, a 1.000, and a 1.128 price projection. I didn't mention to do the .886, as I wanted to show what was right below, but I put it on here, and you see it hits the current area. All I am doing here is comparing the possible 'wave 1' with the 'wave 5'.
I also added the .618 and the retracement we all know right below that on, from the '82 low, in my eyes the 'start' of the entire secular bull market. These are the two horizontal lines that come in from the left. Very curious how they overlap with the 1.128 and 1.272 off the last bull to the Oct '07 top. And no one but us know the lower number. Hmmm.
I also added standard external retracements off that 'wave 4', from the Nov low to the recent top, as seen with the little yellow line there. I didn't show one of them (I'm trying to keep the charts such that if they 'got out' it wouldn't hurt us too much), but it overlapped the current grouping almost dead on. I showed the 1.618 and 1.902. More on this with the next chart.
I also added on something else totally different. Recall expansions from AFTC. I did an expansion off the 'wave 1'. I showed the 1.618, which pointed out the Nov low within .36 point if my data is correct. I also added the 1.902, 2.236, and 3.141 on there. Notice anything interesting? The 1.902 hits right on the current grouping, the 2.236 is at the key area at the division line, and the 3.141 is at the next area down, the low end of the huge DT ABCD if you want to call it that, at the lower // and 1.618 off the last bull (hence the DT CD leg), as T mentioned.
I have been doing expansions like these since before I wrote AFTC, and I noticed it is a popular technique being used by some of the top guys in the public part of the forum. They don't call it an expansion, per Miner, but a price projection, and they are using spreadsheets to calculate it, I believe. One way they explain it is to calculate 2.618 times the initial move, and add it to the starting point, or 1.618 and add it to the ending point of the first move. They only seem to use 1.618 expansions.
This can be done directly on Dynamic Trader software using the expansion tool. It can be done on QC by clicking on the first point, clicking on the second point, and for the third point, click the second point again. This is a way to turn their projection tool into an expansion tool. Kinda slick, eh, like T's trick to turn the fan tool into a division line tool. Ah, the old 'workaround'.
Anyway, the calculation is frequently redundant, which is why I don't generally teach it, but the 1.618 off of 'wave 1' is usually a key spot to watch, so I showed it here, and how the other expansions are hitting the same areas.
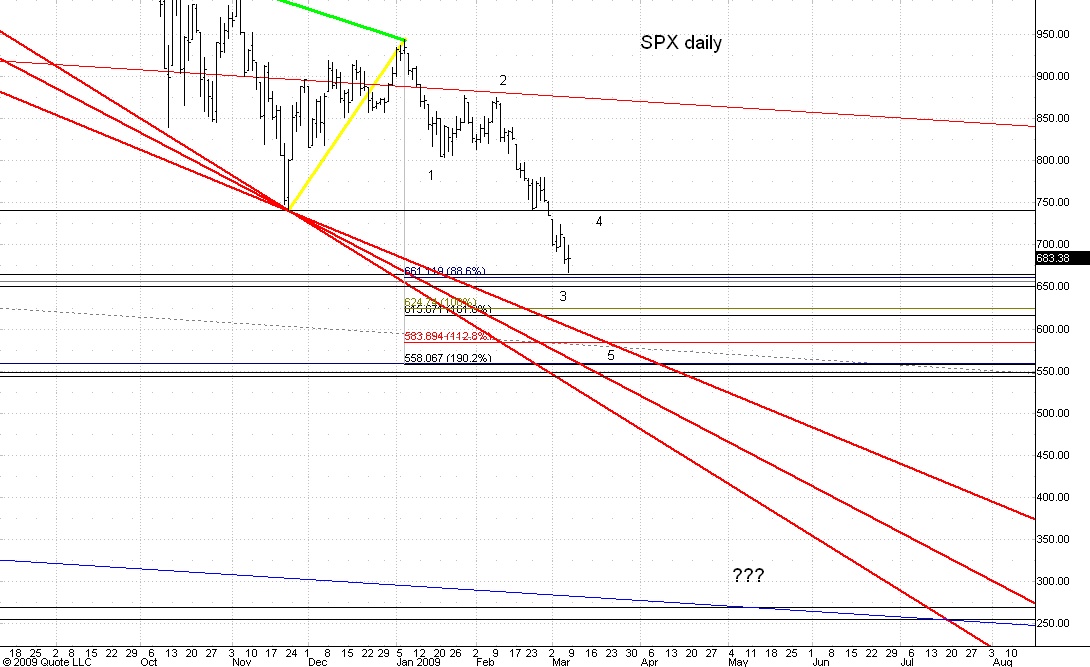
Now, here's the point of this monster ramble, and one 'sub-point'. Let's look at the daily chart first.
I see two clear 'sub-groupings' that this may choose, or simply bounce off of, as it moves to the area of that division line. The 550 area is actually below the division line right now. There are some other numbers near that 1.128 that sits alone there, but it was getting too cluttered, and looking less grouped, so I cut it back to show what I see as the levels. The point is, as T was saying to me in another post, if you keep waiting and 'the' bottom hits, you won't catch the turn. I'll address that in a reply to T's post elsewhere.
I also showed the wave count as mentioned by T. We may bounce up here in a 'wave 4', and then down into the area. This would be particularly effective, since everyone and their uncles called the bottom right here. A bounce sucks a lot of people in, and they get demoralized with a big flush down, determined not to be sucked in again, and we are free to run up. Just a thought. That's what wave 5's of 5 do. We'll see.
Now, for the sub-point, look at the area of the lower //. The two lines shown are the 1.618 off the last bull, and the 3.141 expansion off that 'wave 1' off the top. I just realized right now that I didn't check the .886 retracement box off the '82 low, but it is dead in there. I can't discount this possibility no matter how hard I try. We would likely bounce hugely before that, but the time factor seems to show later this year. The only way this could happen, in my opinion, would be for an essential meltdown in the financial system, or some other major catastrophy. Hence, I hope we don't see it.
So, those are some of my thoughts and work. I'm just saying, watch the areas from here to that 550 area, as the market has a habit of not hitting great looking areas dead on, in an attempt to fool and confuse as many people as possible.
Charts created on QCharts, courtesy eSignal.
JI
jimkane
Rep: 3,058
Posts: 33,089
quote:
Originally posted by TonyC
Jim,
yes the 1.27 ret off oct'07 with the div. line is really nice. I have it on my charts too.
Given the scale and magnitude of the bull/bear trends over the last decade, the range between each retracement level is quite significant, about roughly 120 SP500 points. I'd have to assume that each fib level when reached is being 'seen' and tradable. So I just focus on triggers and executions. My trade management plan just takes care of the inner doubts I may have after entry. No second guessing just execute, period. Just let it roll 'til taken out. Then on the next roll, if that happens, I reset and reload for the next area.
What I mean is that if I am trading a valid reversal area where a new trend may start from then my reward expectation is for catching something more significant than just a single thrust off that area. I am then attempting to catch a full new trend therefore I plan to give back all of the first single thrust move if it rolls over and stops me out.It's an all or nothing approach of sort.Of course I have my own twist in my management plan.
So, although the 1.27 area is very nice, should I ignore the 1.12 level then? to me it looks like it's 120 s&p points away and quite some times to wait for the price action to get there.If it ever gets there. I am willing to take repeated calculated shots at this in order to catch 'it'(the bottom, oh blasphemy...).
T
T,
I understand exactly what you are saying. When trying to play 'countertrend' (if calling what may be a fairly long-term bottom fits into countertrend?), especially for major reversals, if you want to catch the turning point, you have to take the early spots, or you may miss it. My style if to play the first area it gives me after the turn. Look at the bull off the '02 low. It ran until '07. If I didn't catch the low, I still had a lot of opportunity in that trend. Meanwhile, if the trend down continues, I can stay with it.
I was once asked by M when I might play for a top or a bottom. When other factors come in that suggest the odds favor an end to the trend, I do exactly what T is trying to do. I was looking on the short side off all three 'tops' in the last bull, as the statistical odds favored the end of the bull. The third one was 'the' one, but the two previous ones were still awesome trading opportunities in my opinion, even though they turned out to only be countertrend moves. It had reached the time where it was not calling the end to a trend as much as it was playing the statistics. The same holds for T right now.
Do the odds favor staying short here, or taking shots at a big upside? T feels it is the latter, for me, right now, I want to stay on the short side and then when it actually moves up and triggers, get off the short side and look for long setups. Could I miss a monster pop with no other entry setups for awhile? Absolutely, in fact, likely. But that doesn't bother me a bit. I'm close to adopting T's approach, but I'm not there yet. Why?
At the last bull top everyone was bullish. I got a call the day before the top from a technician who said this is 'historic', and that we are about to break out, and the Dow is going to 20,000 short-term, then 40,000 and more soon. That's when I knew I was right. In the '02-'03 bottom sentiment was much worse on the 'retest', which held. We are now at deep new lows, and sentiment is far, far better than at the Nov lows. People are still calling the bottom daily, and lo and behold, an absolute slew of people using time factors called the bottom this week, including tons of perma-bears. If this is the bottom, it will be the first time in history it has happened with all these factors.
Maybe a bear market bounce, but even that, so well-timed by all the pundits, even that I struggle with. When the bottom callers quit, and they all say I give up, it will never stop going down, then that's when I'm ready to take my shot. When I hear 'It's all over, we are going to zero. Everything is going to zero.', the opposite of what I heard at the top, then I'm ready for buying the LEAPS and IRA stocks. I just don't think we are there yet.
So, I see 100% where you are coming from T, and you may catch a spectacular trade, but for me, and my style, I always seem to find enough setups with the trend, and when the odds are overwhelming for countertrend, I bite. It's just not quite there yet for me.
TO
TonyC
Rep: 99
Posts: 471
No probs, M. Feel free to participate actively to the discussions.And when u do have questions, just ask. There's nothing dumb or foolish about trying to understand others.
As a general comment, I say that we are all in here to learn more about the KT methods and share our experiences. I suggest that anyone who is really serious about trading using the KT methods, should contribute and participate actively to the forum. That really gets your mind going and focused. It really helps cope the 'book' theories/concepts with the 'practical' real world aspects of trading. That's an important bridge in the learning process in my opinion.
I don't pretend to have all the answers though. My trading style is my own and everyone has their own, Im sure.
T
MR
mreiserer
Rep: 110
Posts: 2,220
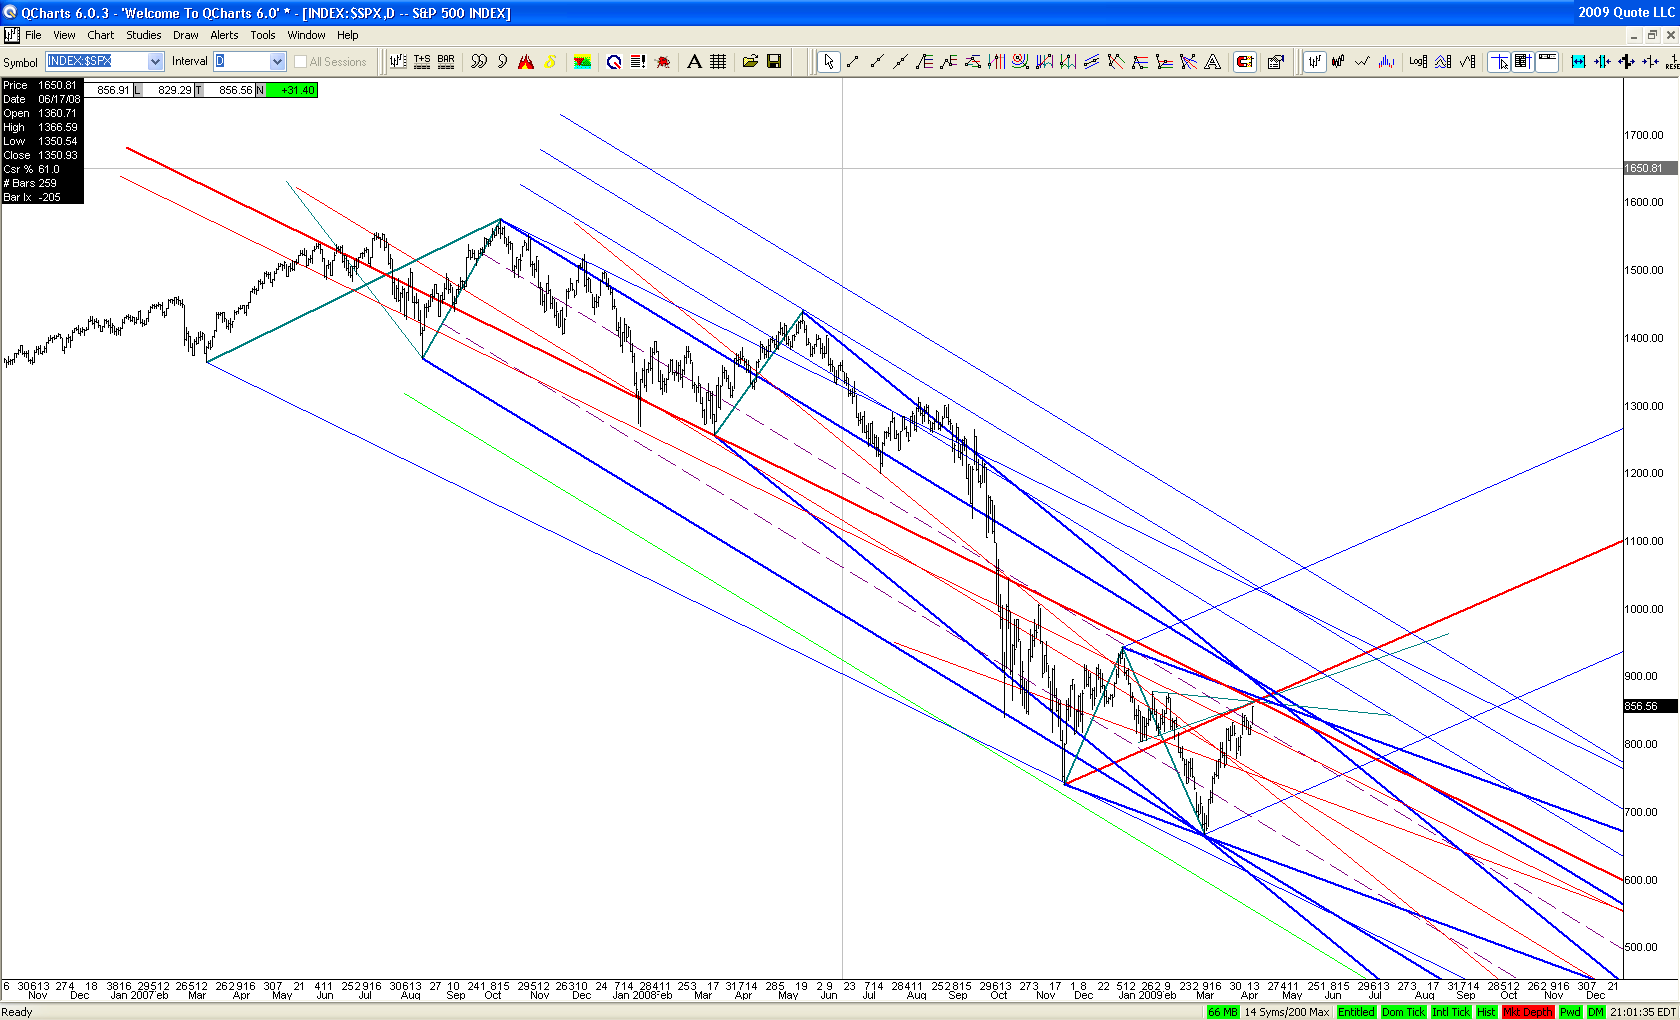
No fibs drawn, just lines.There are some keyspots right above here.
Jim mentions the 883. I see the 873-75 as the next key spot and then a bit higher around the 890. This is also timefactor dependend.
I boldened my key lines. If someone has other key lines that I don't have please post!!!
Jim mentions the 883. I see the 873-75 as the next key spot and then a bit higher around the 890. This is also timefactor dependend.
I boldened my key lines. If someone has other key lines that I don't have please post!!!