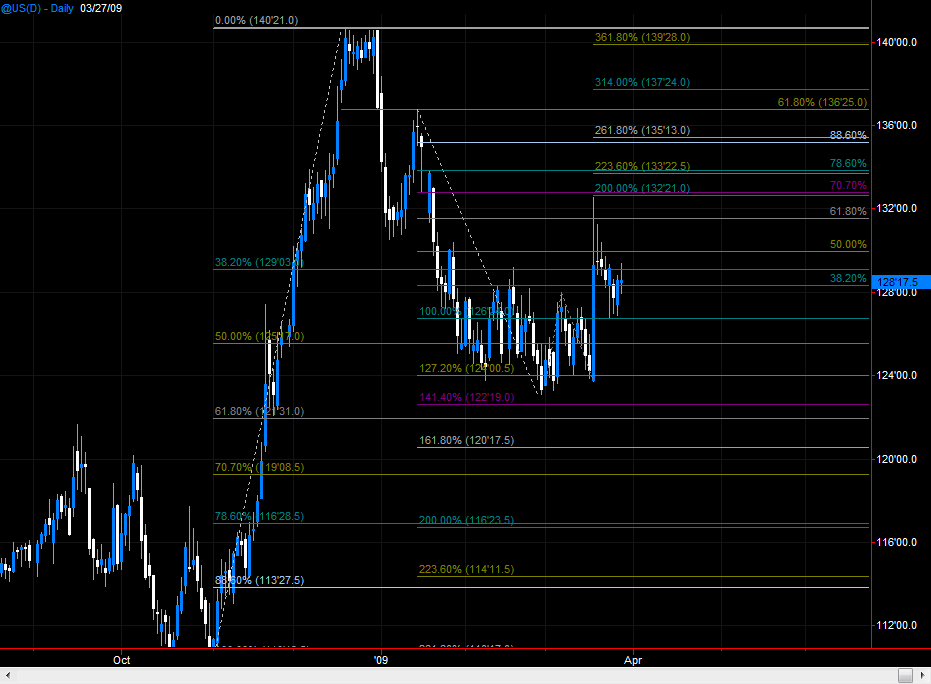
Weekend charts 3-28-09
Click image for original size
Click image for original size
Click image for original size
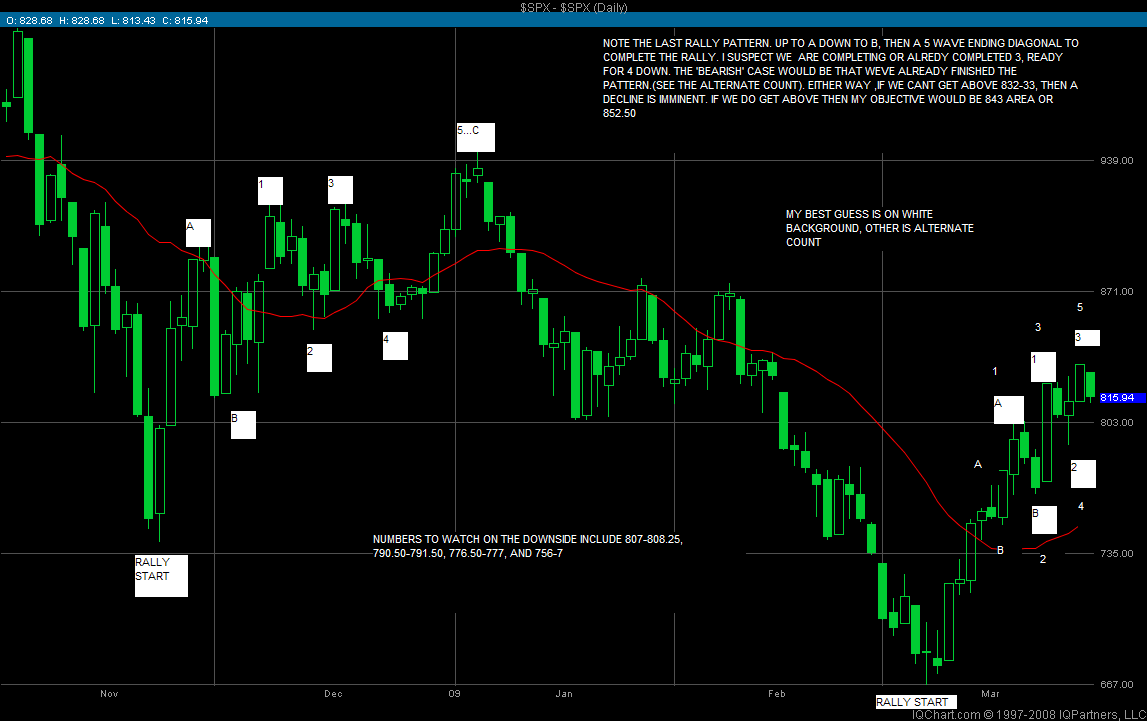
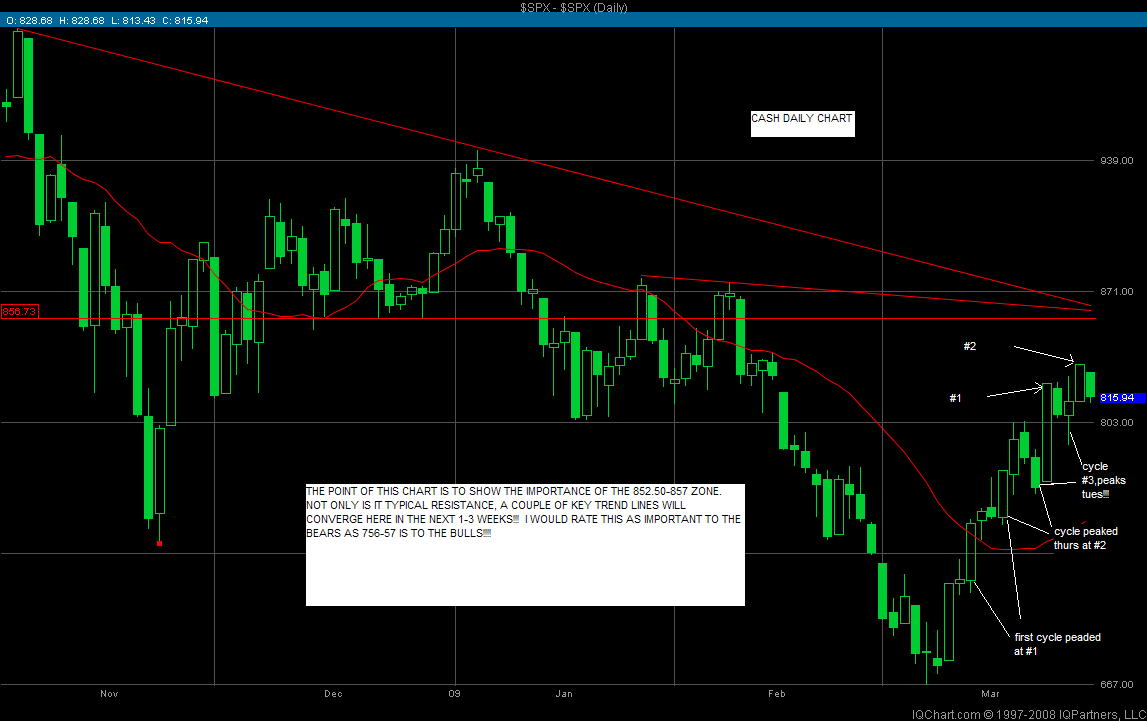
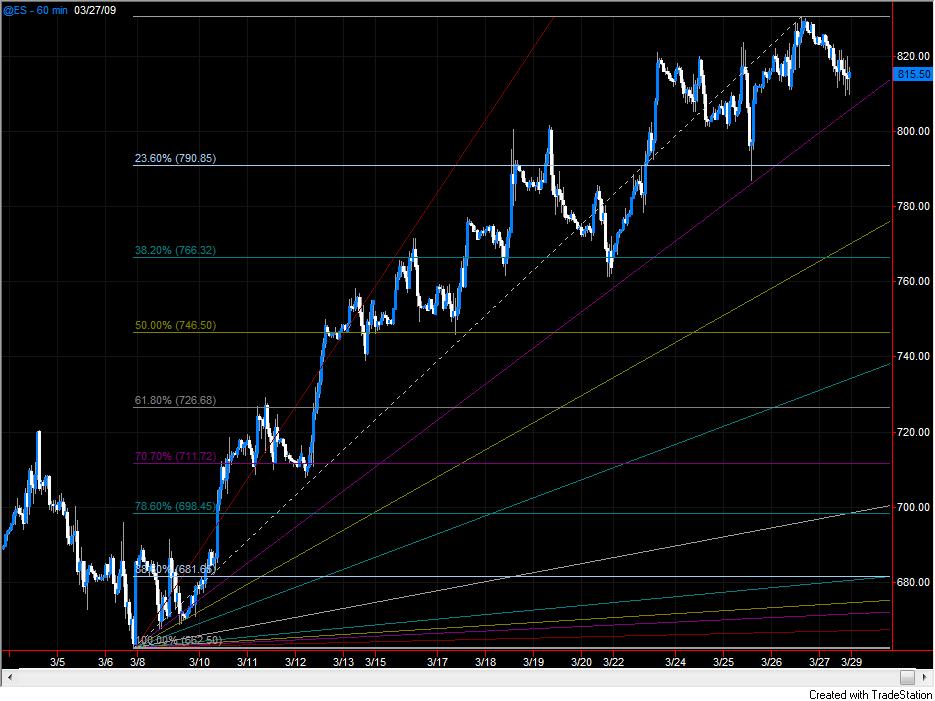
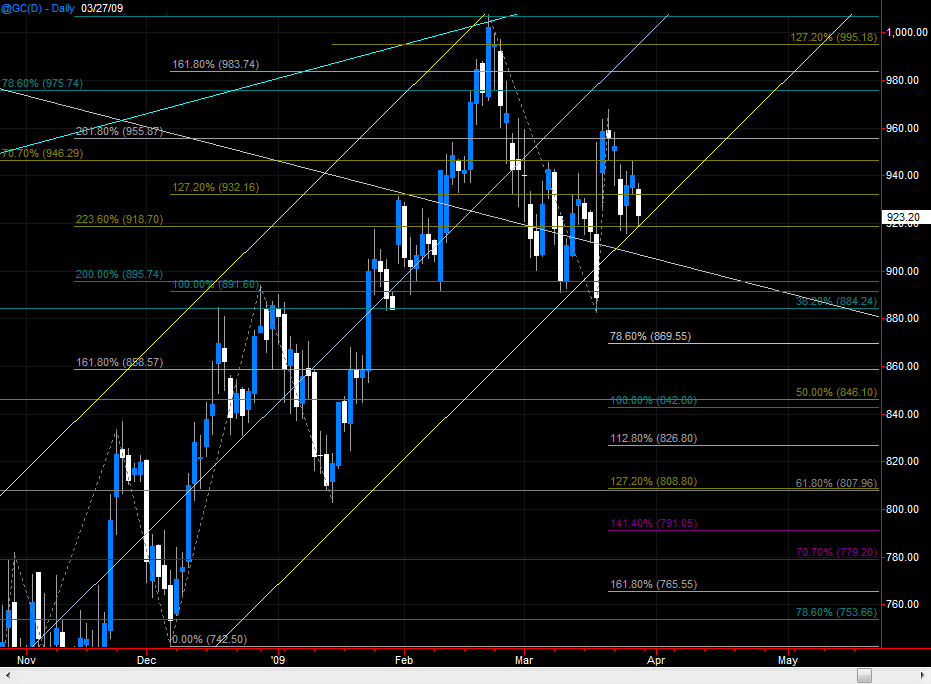
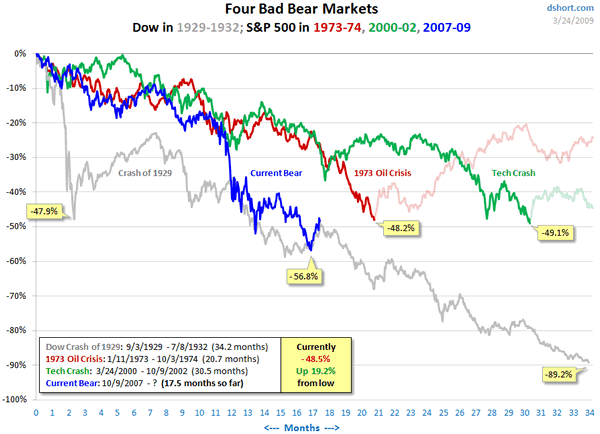
PS: keep in mind, we have a projection to 808.25, and 832.00 and 852.50 still outstanding(807-808.25 would equate nicely to 810 spx cash , just as 852.50 would equate nicely to 856 cash!)
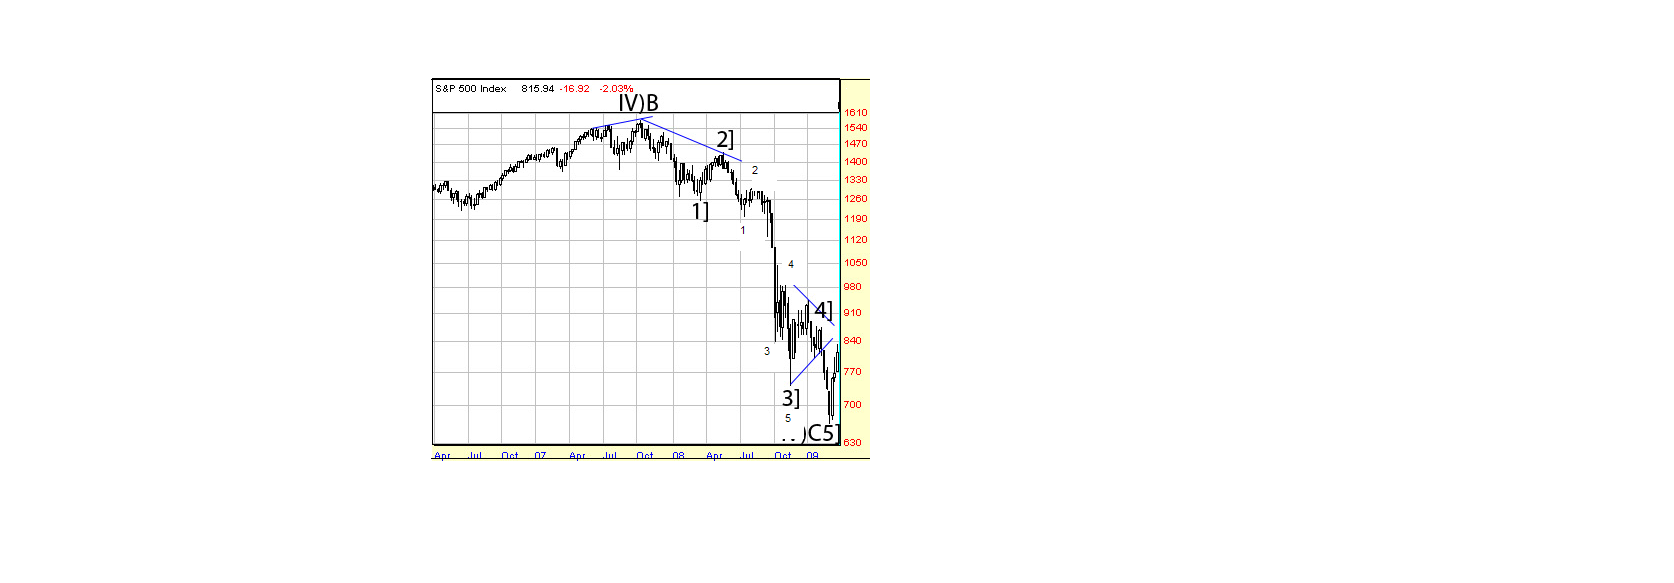
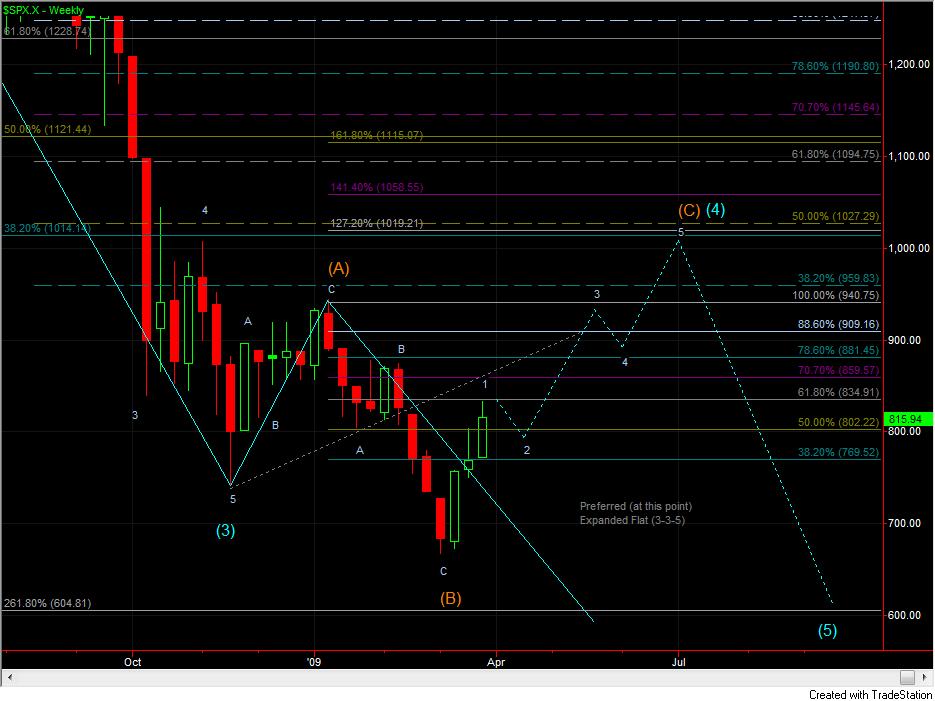
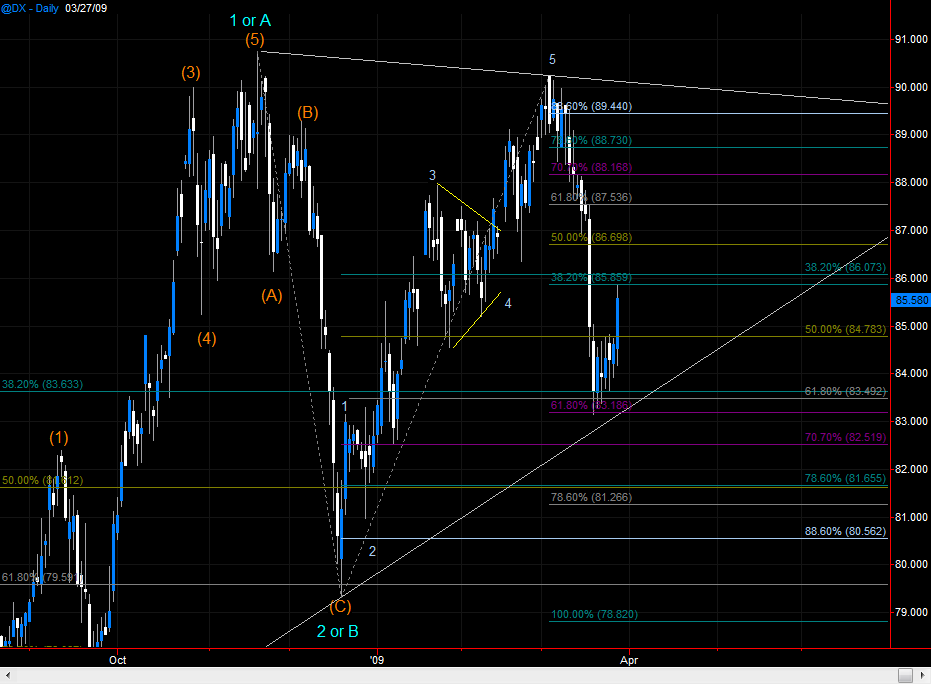
Im not a big Elliot fan, but i wonder how they explain this? If you cant clearly see 5 waves down completed then you need glasses!
Click image for original size
Click image for original size
Click image for original size

Click image for original size
Click image for original size
Click image for original size
Click image for original size

Click image for original size
Click image for original size
Click image for original size
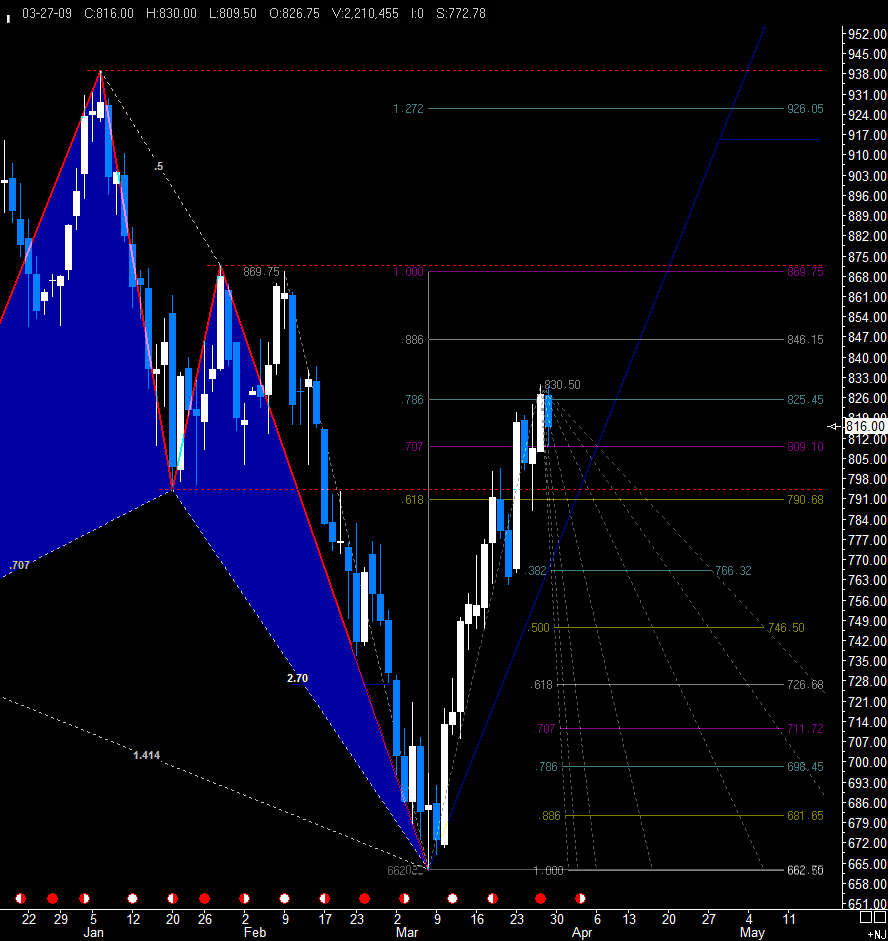
That trade that kept me up all globex the other night allowed me to spend about 3 hours on Mr. Bussiere's site studying his charts (there is a bunch!). This is the one that caught my attention. Courtesy of Mr. Francis Bussiere.
Click image for original size
what about it peaked your interest VO?
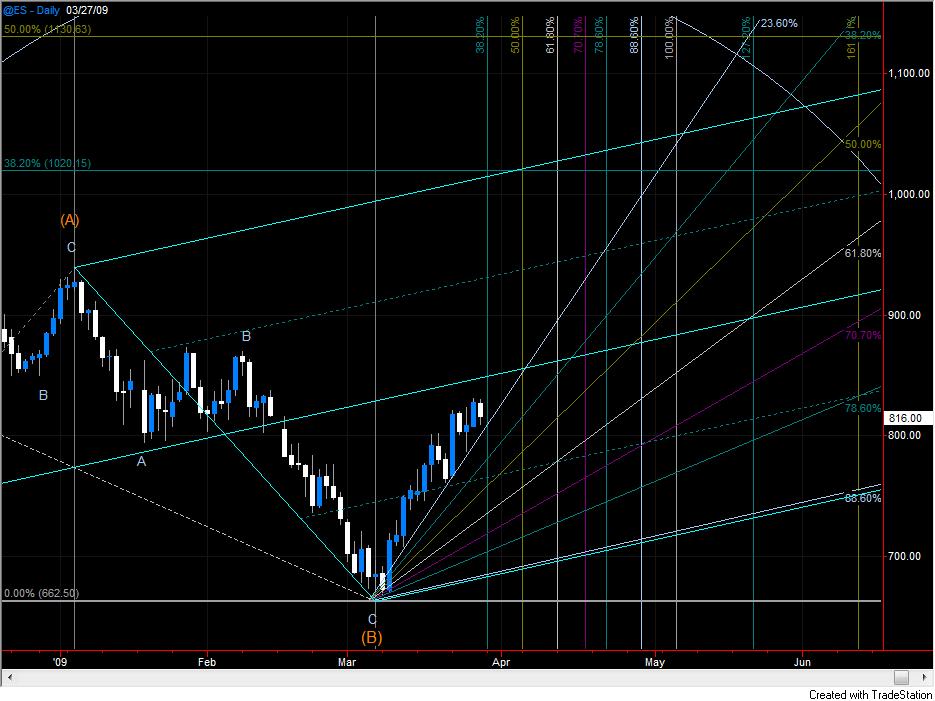
I personally like that blue resistance line above which looks like 850 area might be it
I personally like that blue resistance line above which looks like 850 area might be it
Click image for original size
quote:
Originally posted by palmer
what about it peaked your interest VO?
I personally like that blue resistance line above which looks like 850 area might be it
Palmer, look at the top pane...its showing the relationship of the 20 period MA (purple) of the D put/call ratio...its very telling.
Emini Day Trading /
Daily Notes /
Forecast /
Economic Events /
Search /
Terms and Conditions /
Disclaimer /
Books /
Online Books /
Site Map /
Contact /
Privacy Policy /
Links /
About /
Day Trading Forum /
Investment Calculators /
Pivot Point Calculator /
Market Profile Generator /
Fibonacci Calculator /
Mailing List /
Advertise Here /
Articles /
Financial Terms /
Brokers /
Software /
Holidays /
Stock Split Calendar /
Mortgage Calculator /
Donate
Copyright © 2004-2023, MyPivots. All rights reserved.
Copyright © 2004-2023, MyPivots. All rights reserved.