ES Analysis for Friday 5/1
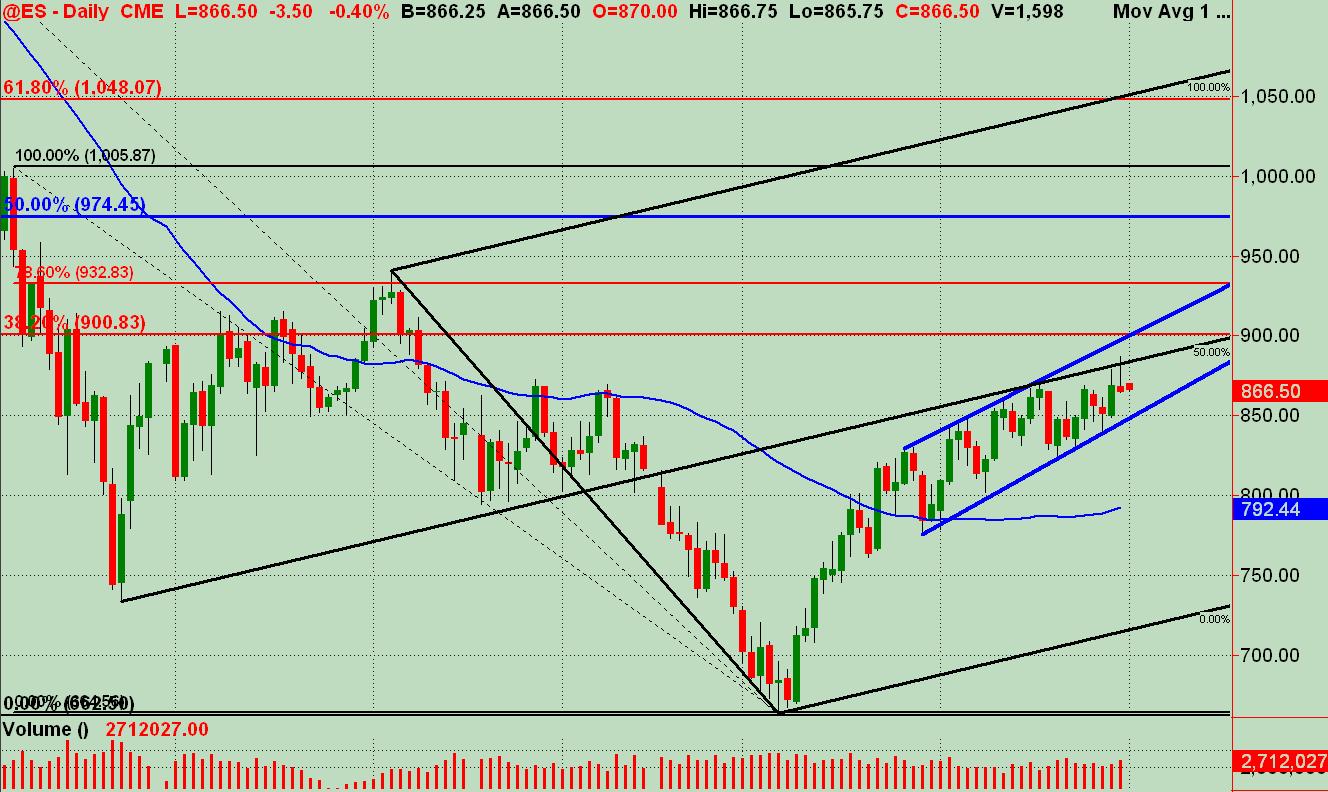
This daily chart shows a reaction off of the midline (black line in 885-887 area) on Thursday. The lower blue upsloping line on the trend channel coming in at apprx. 850, which is near the low on Wed. (4/29) of 849.25.
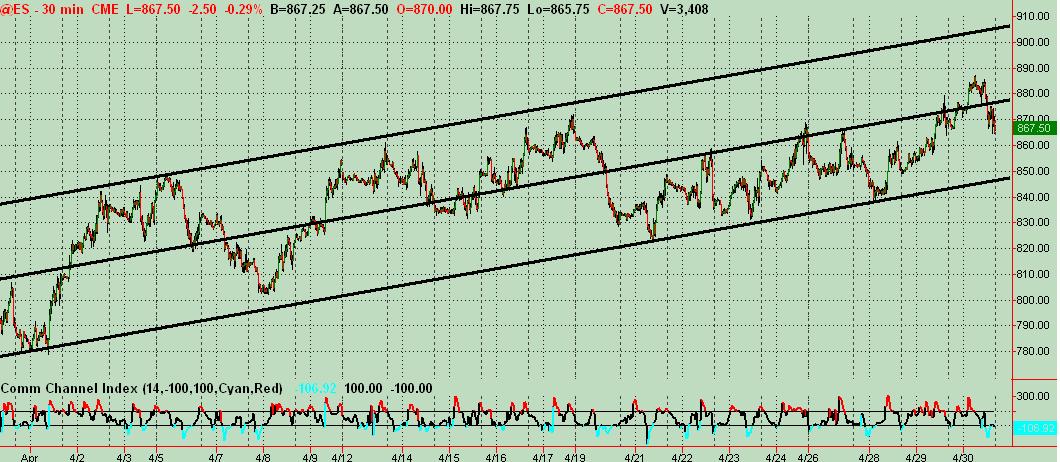
This 850 area also is the lower trendline of a multi-day ES 30 min chart coming in at 848-850 currently (posted below).
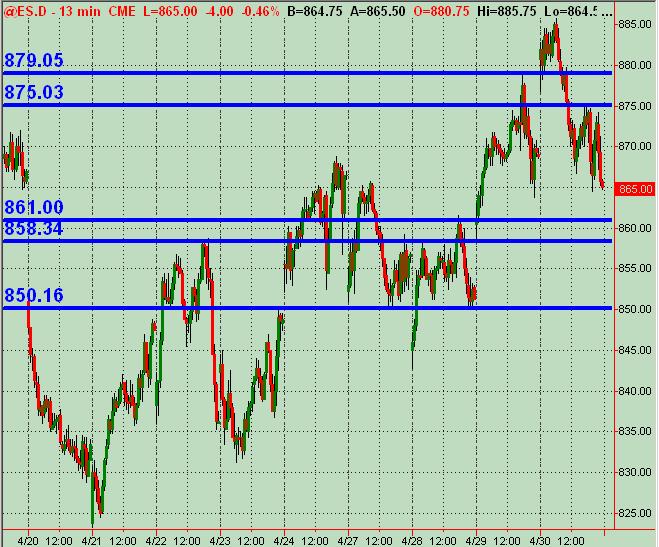
This 850 area also coincides with price action support looking at the 13 min chart (posted below). Pointing out support areas below the current market as I'm typing this for now.
The 13 min chart shows price action support (horizontal blue lines) in a zone of 858.25-861 initially and then 850 below that. Resistance areas at 875 and 879-880.
Just offering a map/analysis of what I'm looking at for Friday. Would appreciate any feedback and additional ideas as always.
This 850 area also is the lower trendline of a multi-day ES 30 min chart coming in at 848-850 currently (posted below).
This 850 area also coincides with price action support looking at the 13 min chart (posted below). Pointing out support areas below the current market as I'm typing this for now.
The 13 min chart shows price action support (horizontal blue lines) in a zone of 858.25-861 initially and then 850 below that. Resistance areas at 875 and 879-880.
Just offering a map/analysis of what I'm looking at for Friday. Would appreciate any feedback and additional ideas as always.
Click image for original size
13 min ES chart with price action S/R levels ... any fib and/or pivots etc. that correspond with these levels and with the above analysis and charts might add to their significance. Throw some charts and analysis out there folks !!!
Click image for original size
Addendum: This is my overall "take" on price levels that the market should/may react off of ... and I look to them to enter a trade or exit an open trade (or a portion) when price nears these levels. But I'm also looking at price patterns and formations intraday for my "regular" trading, whether fading a move or entering on a pullback in an uptrend or downtrend. That incorporates my own "reading" of price action and how well bid or offered the ES is over time. Also, I pay special attention to the $TICK, especially + or - extremes coming into areas to fade or pullbacks in the trend and look to enter there to minimize my risk and thus risk less and keep a tighter stoploss and (hopefully) have relatively immediate move in my direction.
So, in other words, this is my macro-map coming into the next trading session as I am also looking at a few indicators and internals (and more recently $VOLD)... to time and enter (or exit). I look at both RTH and globex data on multiple time frames and keep up with the Naz and Dow movements and how they are moving together (or not) as the session unfolds minute to minute. I drill down to the 5, 2 and especially 1 min chart for entry typically. Just sharing more so that this perhaps makes more sense ... and so any other folks with additional analysis can DESCRIBE in understandable detail (as best as possible) what they're looking at, and doing.
So, in other words, this is my macro-map coming into the next trading session as I am also looking at a few indicators and internals (and more recently $VOLD)... to time and enter (or exit). I look at both RTH and globex data on multiple time frames and keep up with the Naz and Dow movements and how they are moving together (or not) as the session unfolds minute to minute. I drill down to the 5, 2 and especially 1 min chart for entry typically. Just sharing more so that this perhaps makes more sense ... and so any other folks with additional analysis can DESCRIBE in understandable detail (as best as possible) what they're looking at, and doing.
From your 30 minute: The reverting tendency to the upside from mid-session on the 24th to midnight on 25th is pretty impressive; equally so is the subsequent equated reversion to the downside, beating prices signifigantly from the point of origin. I see the action from that point on as exhaustion, and it shows. Selling volume is as high as it was on the 24th bull rally from 50. The way I see it 50 may be buying support but hasn't held it on a retrace yet, and even if they do 60s haven been lost (and nearly resistance now) it'll only mean a series of inside days possibly and bear flags before we break hard to the downside. The way I'm seeing it buyers have one more opportunity left to make another high.
I'm expecting this 5th wave forming to fail, personally. I think longs are good to 74.50.
I'm expecting this 5th wave forming to fail, personally. I think longs are good to 74.50.
Click image for original size
IMHO
I don't like the first day of the month. I usually lose the first day, I don't know if its mental or what...
and I tend to trade better at the end of month. I think its because the market can get set in its ways. Like
a trend day, tends to trend all day, the same with a trend month like this month, its easy to take trend
month and buy pullbacks. Sideways months to sell breaks in either direction ect ect. I do better as the day,
week, and month progress. And tomorrow I'll be away from the market, like I am at most 1st.
Emini Day Trading /
Daily Notes /
Forecast /
Economic Events /
Search /
Terms and Conditions /
Disclaimer /
Books /
Online Books /
Site Map /
Contact /
Privacy Policy /
Links /
About /
Day Trading Forum /
Investment Calculators /
Pivot Point Calculator /
Market Profile Generator /
Fibonacci Calculator /
Mailing List /
Advertise Here /
Articles /
Financial Terms /
Brokers /
Software /
Holidays /
Stock Split Calendar /
Mortgage Calculator /
Donate
Copyright © 2004-2023, MyPivots. All rights reserved.
Copyright © 2004-2023, MyPivots. All rights reserved.