ES Charts/Analysis for 5/13
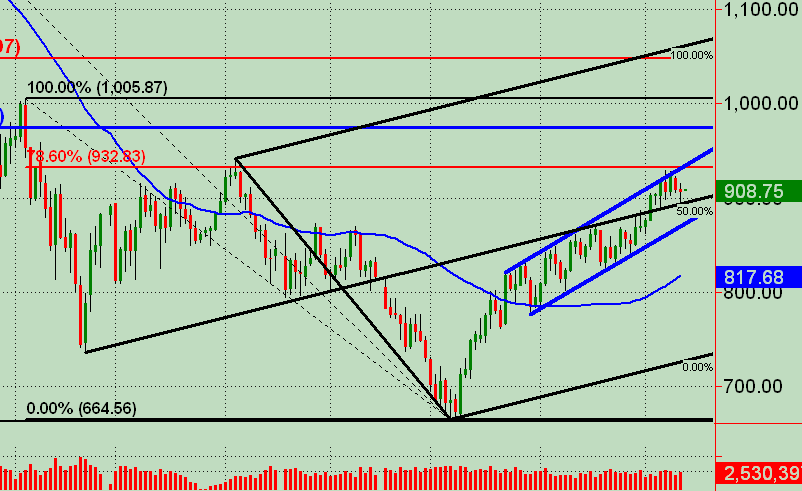
Posting 2 charts here ... a daily and 13 min. The daily has an Andrew's Pitchfork in black with price reacting off the midline today. Also, the blue lines are a parallel trend channel that's still intact and containing price action.
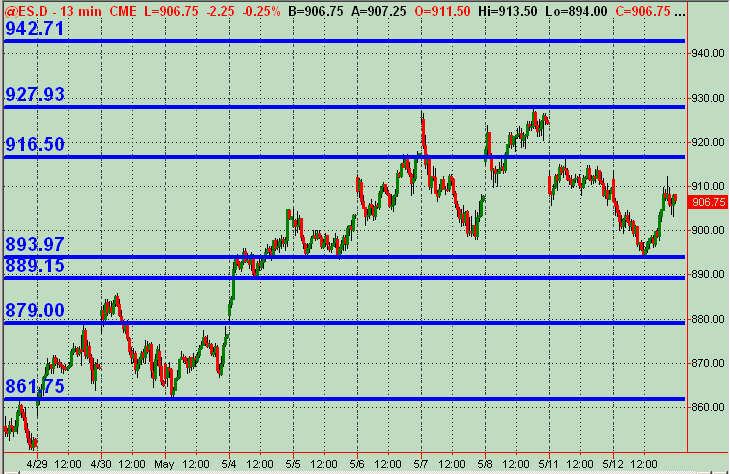
The 13 min chart simply has price action levels that could potentially function as support or resistance at the horizontal blue lined prices.
Would like to see others post charts and any additional analysis here coming into the trading day on Wednesday 5/12. And always open to feedback on what I'm posting.
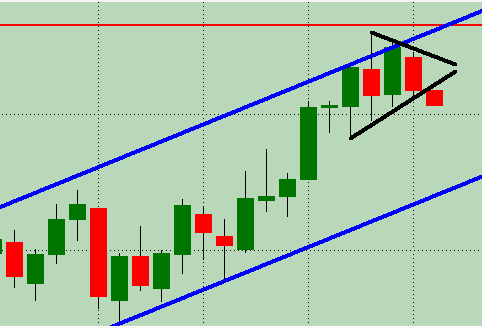
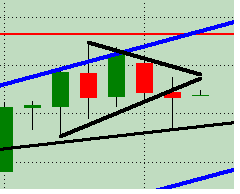
Joe called it ... a bear trap (at least for the day) with the Double Inside Day and NR4 ... that broke down out of the Wedge to the downside where there was tradable money BUT then rallied back up into the end of the day. Again, what had me bothered for shorts was the fact that this has been a pattern for weeks now in this uptrend ... an early session sell off that ends up with a day that closes up. Just more observations for the trading "map."
This was the close-up daily chart I posted after yday's close ... with the after market trading down on the far right bar. Totally different daily bar by the end of today's session. Go figger!!
This was the close-up daily chart I posted after yday's close ... with the after market trading down on the far right bar. Totally different daily bar by the end of today's session. Go figger!!
Click image for original size
Click image for original size
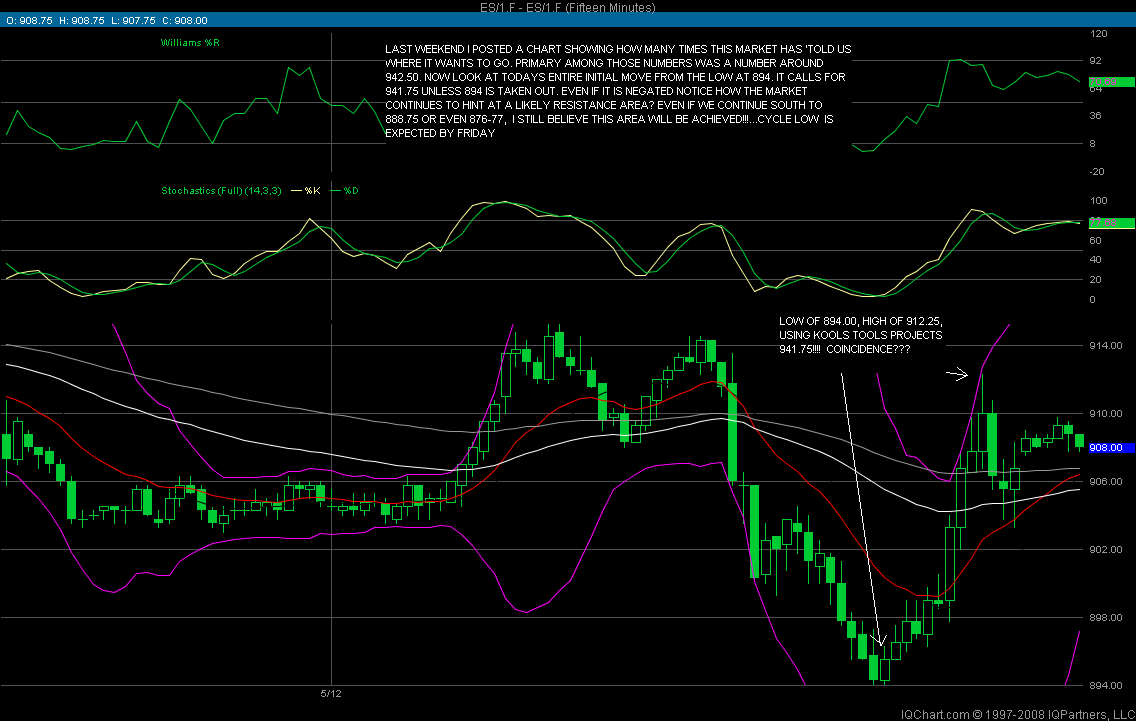
Hey Kool ... good chart, good stuff! Do you have a chart that could display/explain how your analysis points to a cycle low (and where time-wise and/or price-wise) on Friday? And reference your commentary on the above chart if you could. 876-888 roughly is what you're looking at now (obviously other price action has the potential to adjust that before Friday). Just trying to get more of a handle on how you see the market. I'd encourage anyone that's not up on Kool's gig to hit his forum within this site for some basic initial education.
BTW, here's the daily ES chart up close to compare to the one a few posts above that had the Wedge breakdown in after hours trading Monday p.m. This is the daily chart at the end of today's session.
Was almost a reversal bar, showing buying is still predominant ... fighting what should have unfolded as a daily pattern breaking down with follow thru. But it didn't!! Still long biased, especially based on today's price action combined with the same bullish phenomena that's been in force for weeks and weeks now.
Click image for original size
Monkey , check your e-mail. My methods are not for public consumption cause ive had vendors trying to steal them to make them their own.
Cant seem to post charts right now...trouble at mypivots server? Any way im really looking for 888.75-890 on the downside here with strong support at 870 area on the way to a possible ultimate objective of 847. thats the worst case scenerio over the next couple of days or so. I remain very bullish overall however (till early july or 1021). Monkey ,the expected cycle low around the 13th-17th is from a conventional cycle by a gentleman named Jim Curray whom ive respected for years. its a well known 40-45 day cycle (a component of a larger 120 day one) that has been wrecking havoc in this bear market the last 10 months or so.
With the 7:30cst numbers released, ES spiked down to 889.25. Nice call of support on the downside, Kool. Has halted price for the moment ... we'll see what kind of bounce it offers. Thanks for the email. Interesting stuff! If you have decent vision, can count and own a simple calculator, sounds like the core of a good method/strategery! ES up to 892.75 as I'm typing this.
went long at 889.25(miracously, got filled!!) exited 892.00 . trying to buy the 887 area now ,but might be too late
bing...and expecting 894.25 short term...just chickened at 892.75
Well, that was quick and interesting. Mkt spiked and I moved stop on position up to 45 and got hit PDQ ... +3 ticks??? Bleh!
Emini Day Trading /
Daily Notes /
Forecast /
Economic Events /
Search /
Terms and Conditions /
Disclaimer /
Books /
Online Books /
Site Map /
Contact /
Privacy Policy /
Links /
About /
Day Trading Forum /
Investment Calculators /
Pivot Point Calculator /
Market Profile Generator /
Fibonacci Calculator /
Mailing List /
Advertise Here /
Articles /
Financial Terms /
Brokers /
Software /
Holidays /
Stock Split Calendar /
Mortgage Calculator /
Donate
Copyright © 2004-2023, MyPivots. All rights reserved.
Copyright © 2004-2023, MyPivots. All rights reserved.