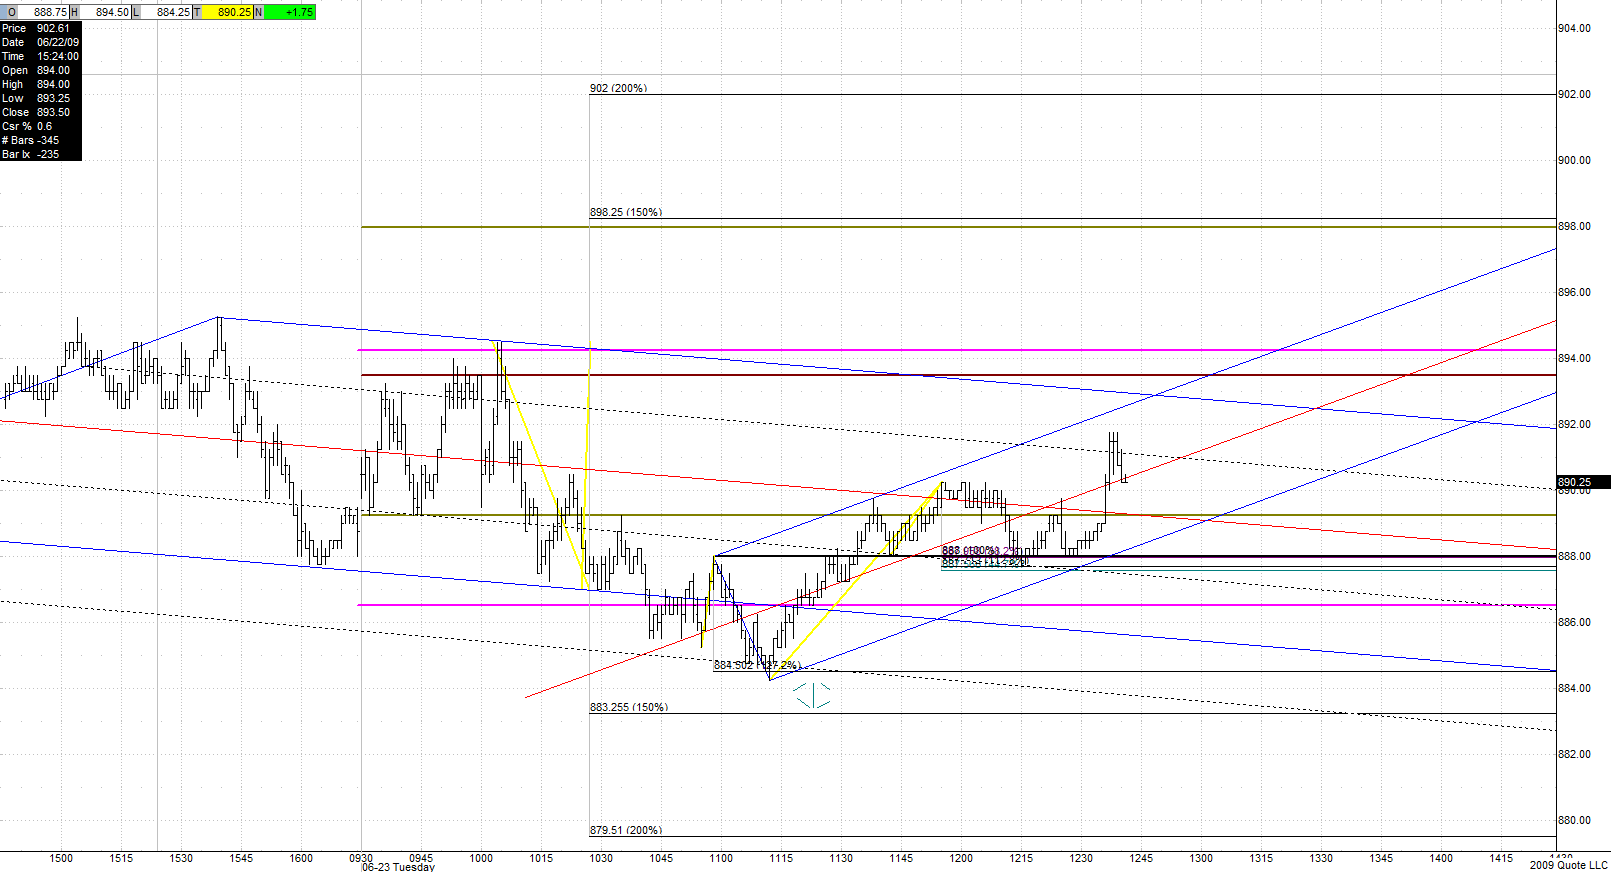
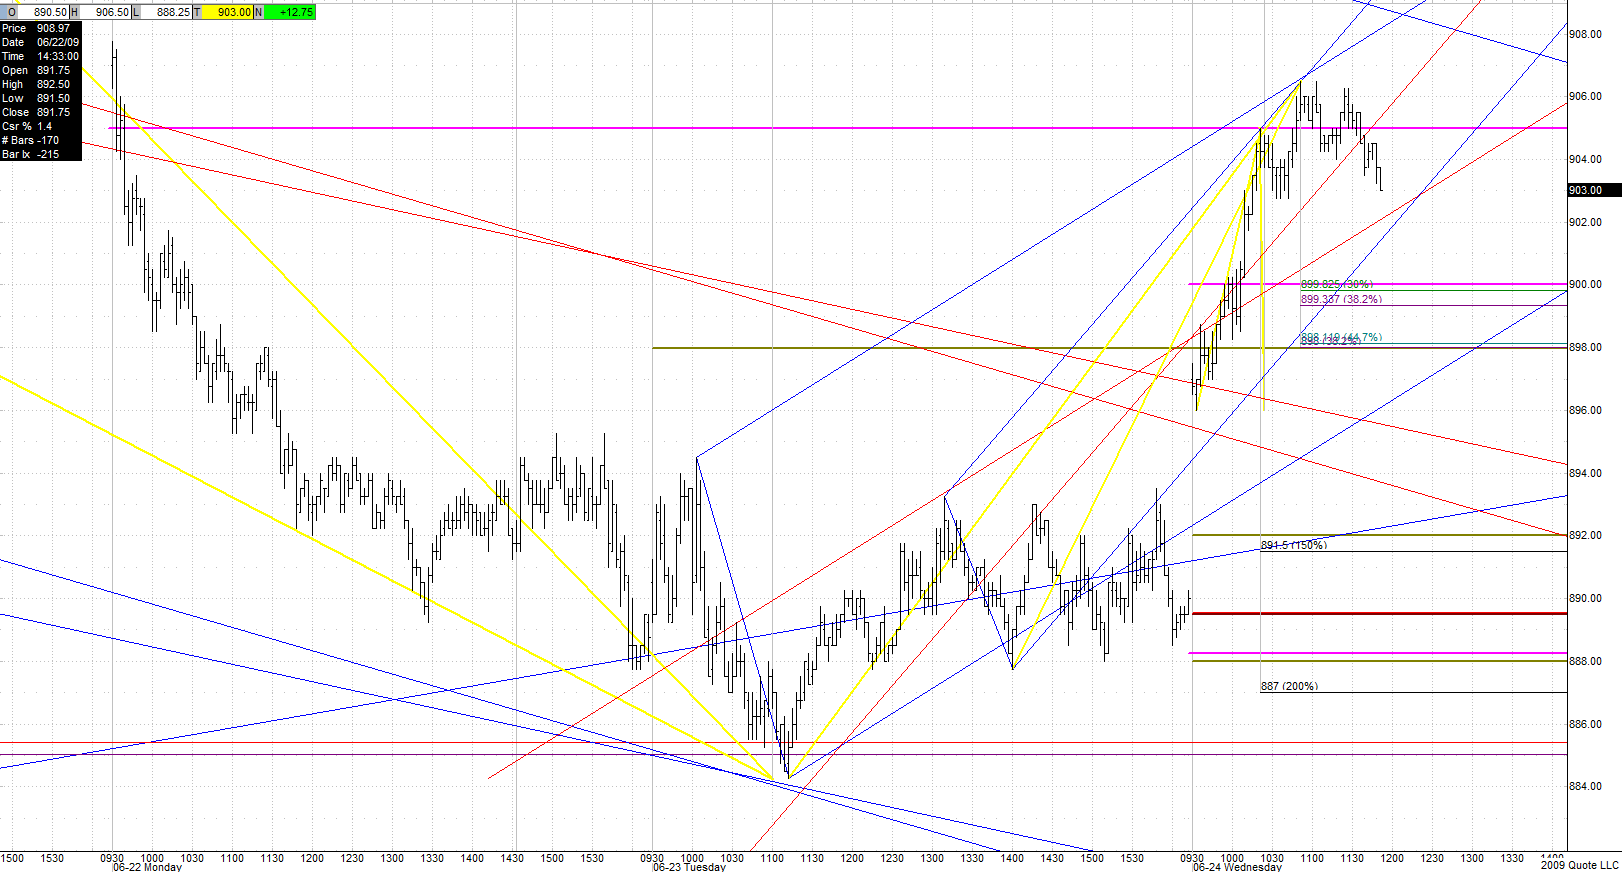
I wanted to mention this yesterday, but never did. The 84 area is a big-time daily/60-min area on my charts, so keep a close eye on what it does from this low.
Yes, key point to see if this can now roll down.
Now watch right in here for them to come back in, or just chop it. It must take this level out if it is to have a shot at new lows.
And like clockwork in they come... Let's see if they have any sustain now.
Sometimes, it seems, they are so predictable it's just crazy.
Read that one to the tick. Unreal.
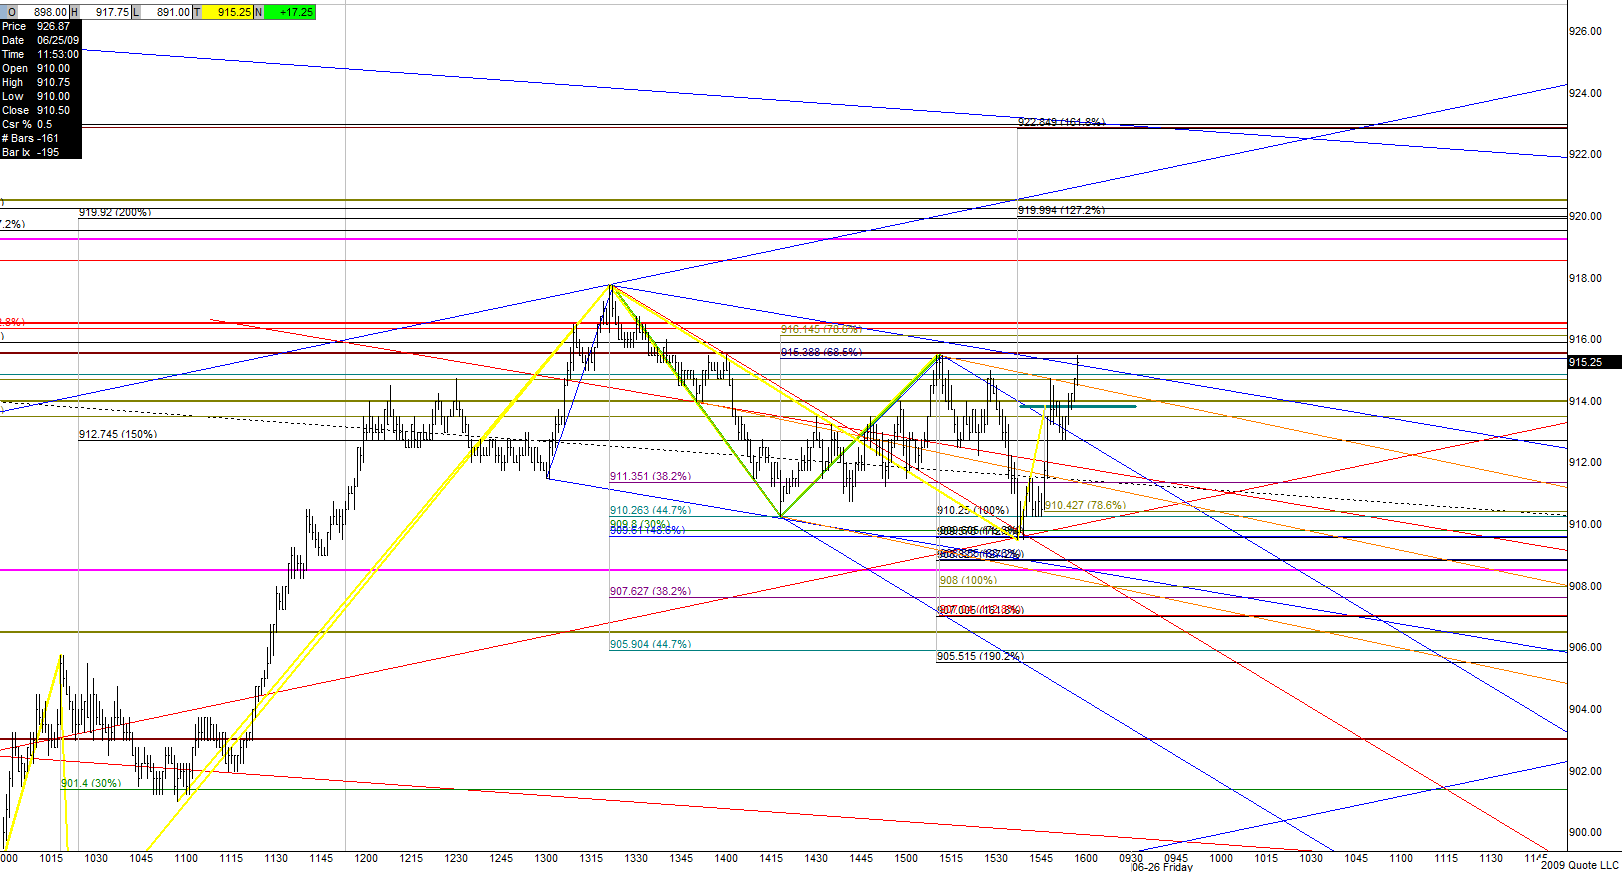
I see. I had the standard set on another chart. On the one I was looking at I had added subdivided division lines on there, playing around to see if I had more contact points that way or anchored as mentioned above on the regular upper division line. I never looked back to see if I continued the median line back it balanced at the standard/natural position. Very cool. I'm not sure if your lines are additional subdivided division lines, or both sliding parallels?