ES daily key spot
Well, the last key daily short side ES spots came back in May and June, and although they didn't turn it down, they did produce reactions of about 54 and 92 points. The ES is now, after quite a wait, at the next short side area of interest for me. Maybe one of them will turn it down on an intermediate basis, and maybe not. My plan, as I outlined in the KT private area, is to be looking long, long, and more long on every setup on the way up, and looking at puts (I like SPY options for longer-term plays outside of intraday ES) every time a key area is hit, I see a reaction, and it gives me a trigger. So, now I see what happens here. I didn't show them, but I have two areas above this, depending on how long it took, in the lower and upper 1,100's. If this area here gives way, I look long side until the next area is hit. Lather, rinse, repeat. It's a probability game, as we all know, and all I can do is find areas worth taking shots at if I get price action in those areas that triggers me in. Now we see what happens.
Here's the chart. I've had this set, which has guided me well, on my chart for approaching two years now. Keep in mind, this is just a framework, cleaned up for clarity purposes, to show just this key area we are at right now. It gave a great reaction Friday afternoon, but what it does from here, that's up to the probability gods...
Chart created on QCharts, courtesy eSignal.
Here's the chart. I've had this set, which has guided me well, on my chart for approaching two years now. Keep in mind, this is just a framework, cleaned up for clarity purposes, to show just this key area we are at right now. It gave a great reaction Friday afternoon, but what it does from here, that's up to the probability gods...
Click image for original size
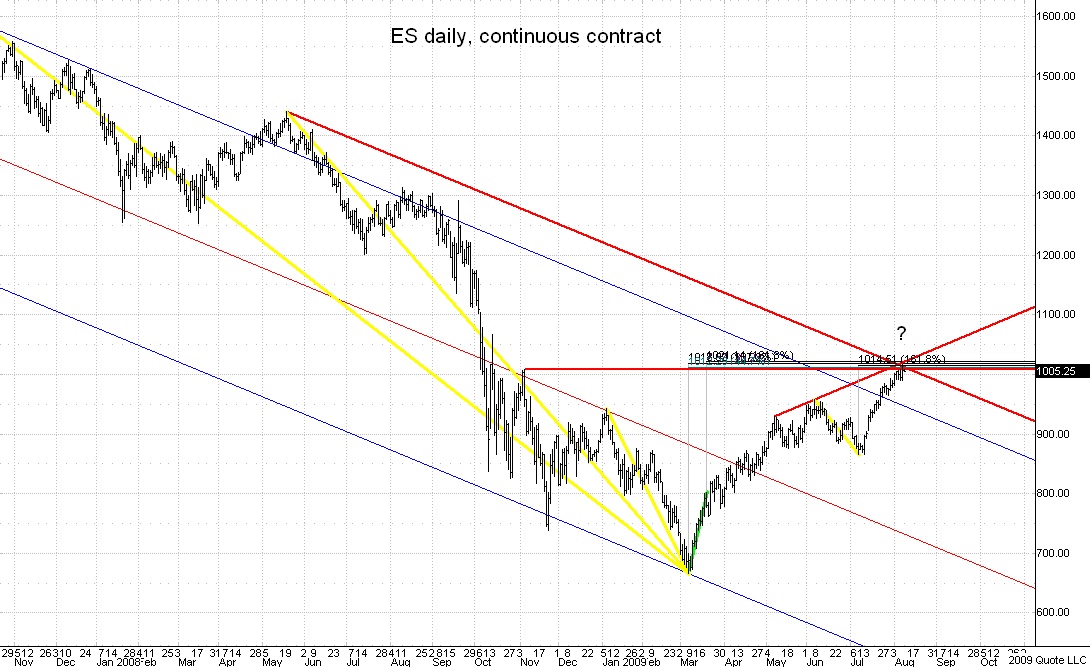
Chart created on QCharts, courtesy eSignal.
One thing that really, really bothers me about this setup, that almost dooms it to failure, perhaps as an intermediate top, and perhaps even as a short-term rollover spot, is that a .382 off the 2007 top is in there. Normally I'd be all over that, but nowadays anything that is obvious, mentioned everywhere, and is all over the idiot box, draws endless traps and just kills everyone. It's just the age we live in, with the 'manipulation ramper robot drones' running the market. So, I am pondering that...
there is another thing Jim I keep hearing 1060 all the time maybe people are so honed in on that area that trhe mkt turns here and traps a few dip buyers playing for 1060 forgetting the 382 here and the potential it could have. just a thought.
Nick,
yes I read somewhere Goldman's analysts calling for SPX target @1060 .That's the carrot bait.
yes I read somewhere Goldman's analysts calling for SPX target @1060 .That's the carrot bait.
Now, here's the cool thing that happened today, folks. We got some follow through on the drop from Friday that sent this down off the area. It went to a spot where I'd expect a bounce to start, and it is now forming a corrective structure in here, a typical 'wave 2' off the top. It should drop like a rock off that, into 'wave 3', if this area is going to have any significance. I want to see this happen with no messing around, no 'retesting' the highs, no strong price action. That's not to say it couldn't do that and still roll over, but it is not what I want to see. So, price action is key. It's doing exactly what I want to see so far, just perfect, but it needs to keep this up, and not start playing games in here. Any games, and I'm going to be wary it doesn't intend to do much with the area. Regardless, this is a fun one, with lots of clues, and has been great for intraday trading so far, too, in my opinion. Stay tuned.
Here's my post from last night in the private KT area:
"Keep a close eye on 1009-10 (maybe 11), as that's just about the last spot for this thing if they keep pushing it up, or I think it will likely burst to new highs. I've got a lot right in there, and today's virgin POC, too. As I mentioned in an update in the public KT forum, we now have our potential 'Wave 2' here."
It hit 1010.75 in the GLOBEX session, and gave a perfect setup after that for a second shot. Yee-haw! It doesn't get any better than that, for me. Now it sits at an area where this may be the CD leg of an ABCD here and not a 'wave 3', so I will be watching closely in here to see if we get follow through and extension here to the downside, or is that it. A bounce would be fine, even preferred, but then it must roll down hard from there. Watch this 990 low area here and see what it does. If it did sell into the FED announcement tomorrow (I don't think it will), then I'd expect a huge snap back. Instead, I think it will start to bounce before that, perhaps run up into it, and then it can continue down. But those are just potential scenarios I'm watching for, the charts guide the decisions. Right now I'm just happy to sit 26 ES points below the area I posted (we actually showed and discussed this area in the private KT area shortly after the rally began).
quote:
Originally posted by jimkane
Here's my post from last night in the private KT area:
"Keep a close eye on 1009-10 (maybe 11), as that's just about the last spot for this thing if they keep pushing it up, or I think it will likely burst to new highs. I've got a lot right in there, and today's virgin POC, too. As I mentioned in an update in the public KT forum, we now have our potential 'Wave 2' here."
It hit 1010.75 in the GLOBEX session, and gave a perfect setup after that for a second shot. Yee-haw! It doesn't get any better than that, for me. Now it sits at an area where this may be the CD leg of an ABCD here and not a 'wave 3', so I will be watching closely in here to see if we get follow through and extension here to the downside, or is that it. A bounce would be fine, even preferred, but then it must roll down hard from there. Watch this 990 low area here and see what it does. If it did sell into the FED announcement tomorrow (I don't think it will), then I'd expect a huge snap back. Instead, I think it will start to bounce before that, perhaps run up into it, and then it can continue down. But those are just potential scenarios I'm watching for, the charts guide the decisions. Right now I'm just happy to sit 26 ES points below the area I posted (we actually showed and discussed this area in the private KT area shortly after the rally began).
Emini Day Trading /
Daily Notes /
Forecast /
Economic Events /
Search /
Terms and Conditions /
Disclaimer /
Books /
Online Books /
Site Map /
Contact /
Privacy Policy /
Links /
About /
Day Trading Forum /
Investment Calculators /
Pivot Point Calculator /
Market Profile Generator /
Fibonacci Calculator /
Mailing List /
Advertise Here /
Articles /
Financial Terms /
Brokers /
Software /
Holidays /
Stock Split Calendar /
Mortgage Calculator /
Donate
Copyright © 2004-2023, MyPivots. All rights reserved.
Copyright © 2004-2023, MyPivots. All rights reserved.