MyPivots
Sign In
MA
Marco-T
Rep: 0
Posts: 41
Wish you all nice and successfull trading week.

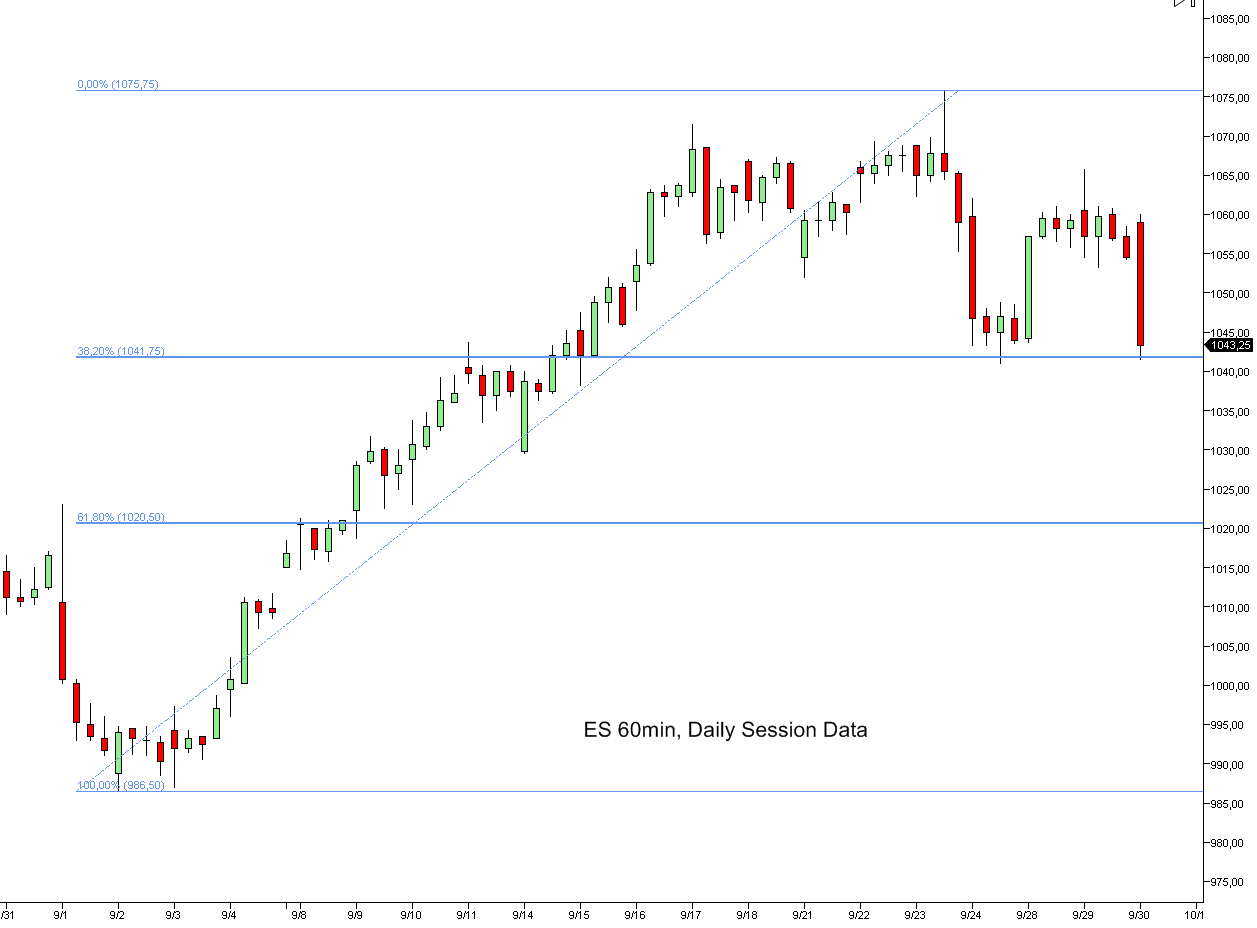
Here is what I've been looking at the whole day. The .382 area was support overnight and got re-tested at the open. Easy setup and worked pretty good so far.

Click image for original size
No Description Entered
JI
jimkane
Rep: 3,058
Posts: 33,089
If we close down here I think the odds are very high the intermediate-term top is in. That's just a hunch, as those MRRD's are brutal. But it's now at the point where short sides based on setups become worthwhile for me again.
ER
EricD
Rep: 63
Posts: 692
jim ..u are amazing
JI
jimkane
Rep: 3,058
Posts: 33,089
This is an amazing puke up here. Wow. I don't want them to overdo it, because that might end the whole move. Slow and steady, boys, slow and steady...
JI
jimkane
Rep: 3,058
Posts: 33,089
Everybody see the 135-min TD ABCD right here? (It shows nicely on a 30-min chart, but the traded timeframe is 135-min.) I'm watching to see if it bounces off this, or moves to the EXP ABCD spot, or just continues to dump. I'd be shocked if they can't at least bounce it somewhere in here. And you never know, this pattern may play out, too. It's all about the price action now.
JI
jimkane
Rep: 3,058
Posts: 33,089
quote:
Originally posted by EricD

jim ..u are amazing

Thanks, but I'm not really. If you spend tens and tens and tens of thousands of hours sudying price action you get a feel for what the most likely scenarios are, that's all.
ER
EricD
Rep: 63
Posts: 692
seems like they want to bring it up to the 69-71 level ...the question is do they smash it then..
ER
EricD
Rep: 63
Posts: 692
This is where I get cautious..i see the EXP ABCD at 43....now should I be on buy mode or still sell mode?
JI
jimkane
Rep: 3,058
Posts: 33,089
To answer that I'd look at several things. Do the key Fibs and lines hit this same EXP ABCD area? It generally all has to come together for me to be interested. Next, can one define a trade premise that still makes a trade potentially worthwhile if it only bounces to the most likely area? How does one determine the most likely area? By applying the same methodology from the potential reversal point. Then, how does the price action act in the area? Finally, of course, a thorough 'context' analysis ahead of time sets the tone for what I may or may not want to do.
JI
jimkane
Rep: 3,058
Posts: 33,089
They can't get this off the floor in here, can they?
JI
jimkane
Rep: 3,058
Posts: 33,089
I have some things that start coming in in the 30's. I'm wondering if this pattern on the RTH chart isn't trying to act like a DT ABCD (it is now right into the key area for that, from here down to the 30's). Do the work, get the key numbers and sets on there and check this out. We'll see. Keep in mind, though, one possibility is that the intermerdiate top is in, so I'm looking at bounce areas for potential shorting.
JI
jimkane
Rep: 3,058
Posts: 33,089
Yes on both, the small 1.272, and yes, the TL creep plays out once again. It's one of the most awesome observations I've ever made.