WEEKEND REVIEW 10-30-09
Click image for original size
Click image for original size
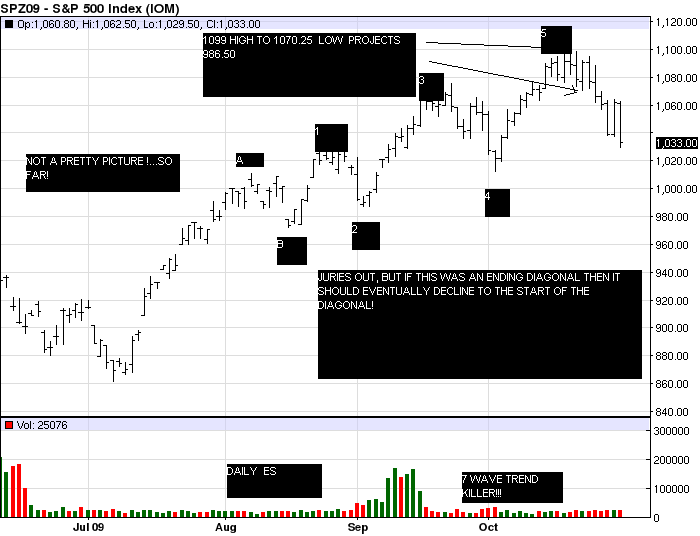
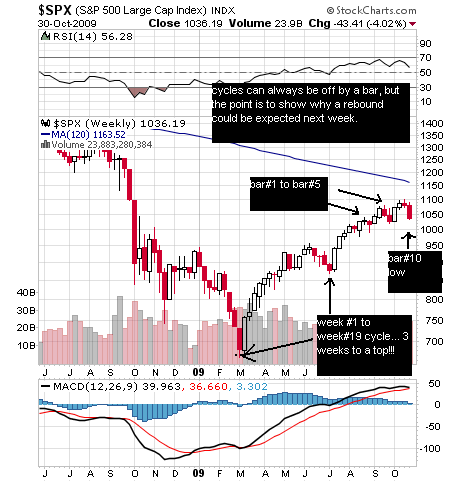
Regarding the es.... well, we either finished the first leg down or are a couple handles away from it which we'll see sun nite or early mon. Then we should get a nice bounce! Remember as i stated , daily cycles are up into tues. I told you weeks ago that your best indicator of an intermediate term peak is when new highs quit expanding and new lows begin to expand! (for only the second time since the bear low in March. The other time being the July low around 865!). The chart below is courtesy of Francis Bussiere.
Click image for original size
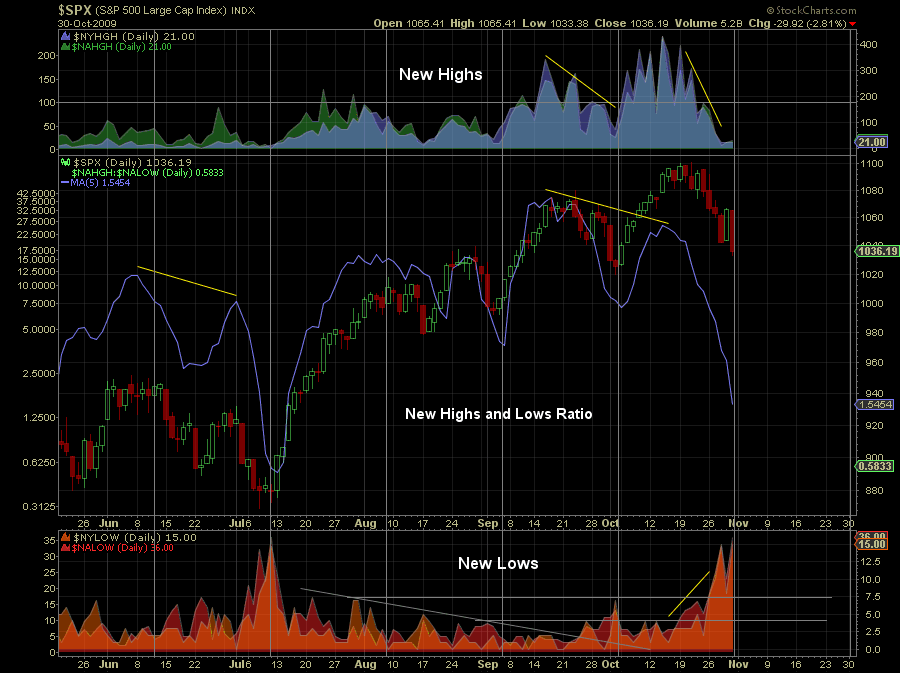
Now as ive often stated, im not going to play the game of calling "the top". I have no idea, and dont really care! All i care about are where are we heading the next few min, hours or days. I think i pointed out this new high-low warning sign a few days before the 1099 peak. I notice we are already at levels that launched that july turning point,so bulls have to hope this is all there is (or close!). Now anything is possible, of course, but be advised that for the last several months one day before or one day after the full or new moon marked important lows and highs. The full moon is monday! Place ur bets!
Click image for original size
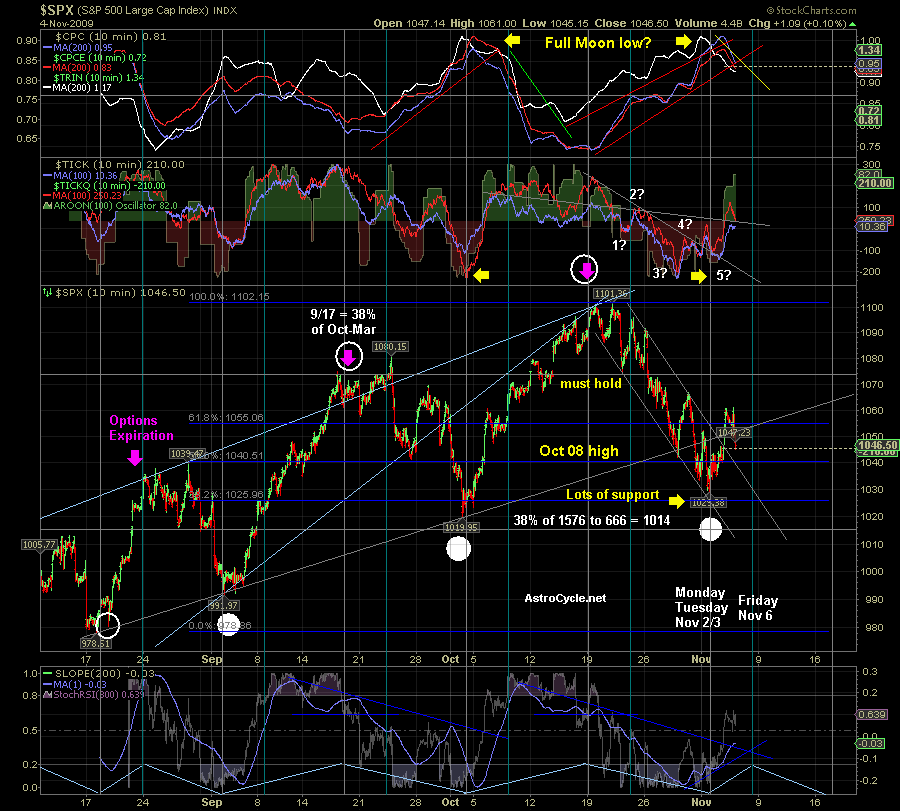
Summary: i dont know if a major top is in.. or a major low for that matter! My best guess is that we may have a touch further to go, at least short term ... probably the projection at 1022.50-1024.75.(sq root of 1099-1.146 and multiplied by itself= 1024.25) After that, if that gets hit (and not broken!), i think a strong rebound comes in to play by mon- tues-wed . At any rate, i cant wait for next week! Its has every indication of being a fun one!
Click image for original size
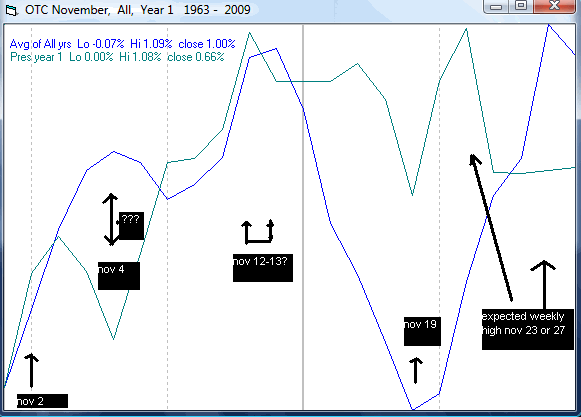
Just for fun , im posting this chart of the seasonal tendancy of the market. Perhaps it can be of some use for us! Its actually 2 charts ... the blue line is the avg of all years while the green line reflects the avg of the first year Presidential cycle. I have inserted the actual dates to help. Chart courtesy of Michael Burke.
Click image for original size
quote:
Originally posted by koolblue
Summary: i dont know if a major top is in.. or a major low for that matter! My best guess is that we may have a touch further to go, at least short term ... probably the projection at 1022.50-1024.75.(sq root of 1099-1.146 and multiplied by itself= 1024.25) After that, if that gets hit (and not broken!), i think a strong rebound comes in to play by mon- tues-wed . At any rate, i cant wait for next week! Its has every indication of being a fun one!
Hello Mr koolblue,
I am new to this forum. I joined because I saw a couple of your charts with cycle projections. It looked like you were counting cycles similarly to the way I do.
I rarely post to forums but since your analysis is similar to my, I thought I would post my daily S&P 500 chart for comparison.
Click image for original size
Click image for original size
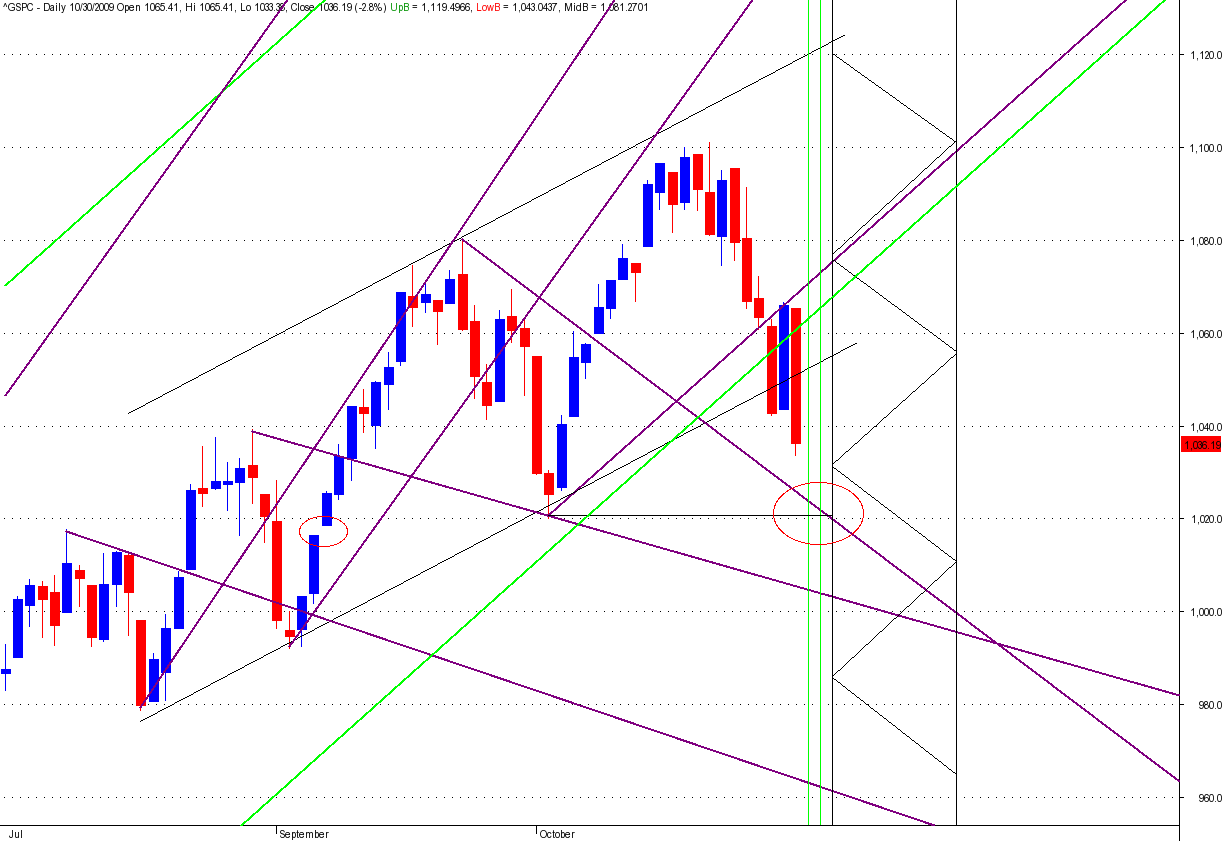
The purple lines are Balance Lines. Notice how they catch swing highs and lows.
The 2 green vertical lines are cycle turning points calculated from the daily chart.
The 2 vertical black lines with the zig-zag lines inside show a turning point calculated from the weekly chart (2 week range).
The last swing low is support.
Notice the 2 red circles. The right most circle shows a confluence of turning points, balance line and support. The left most circle shows a gap just below support. Gaps tend to attract price and get filled.
Balance lines are good targets for swing pivots, they attract price and act as S/R. They reverse the market 85% of the time, the other 15%, the market accelerates through to double the price target.
What is the most likely future course of prices?
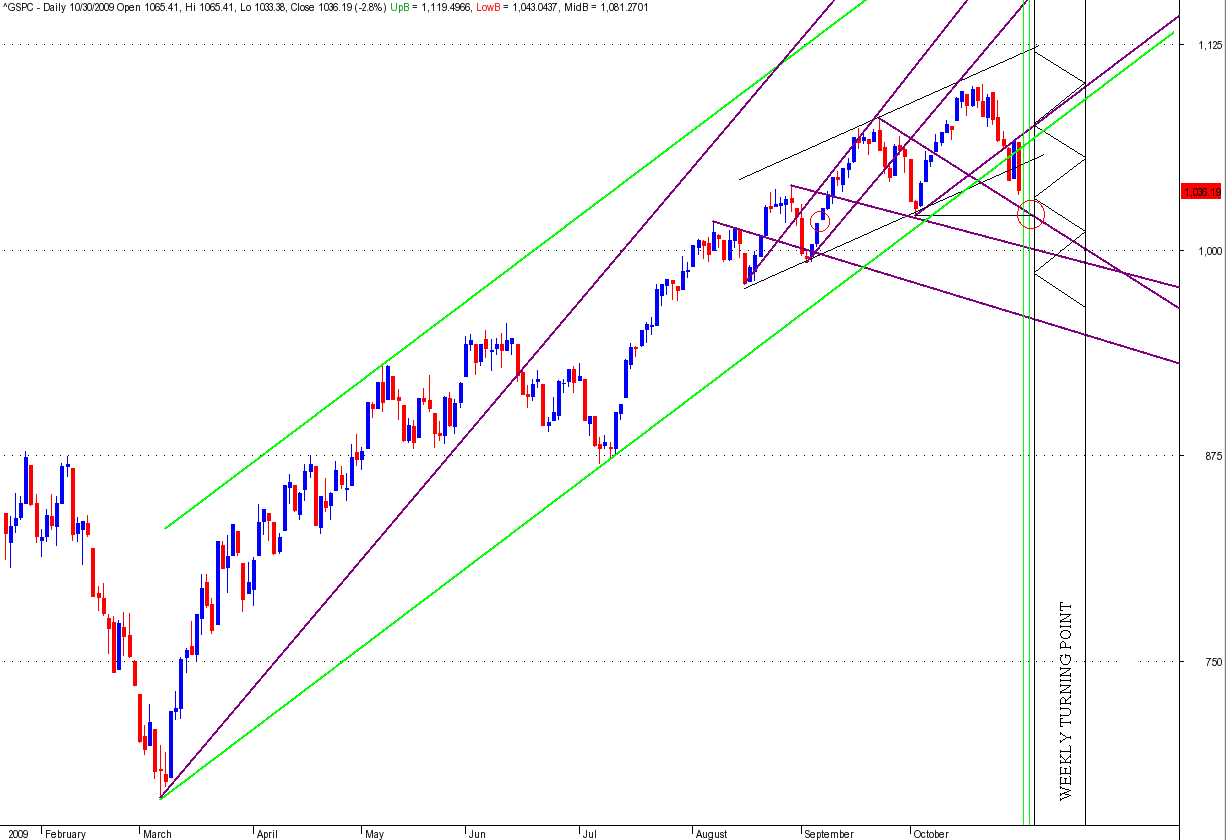
Notice how the market is losing momentum, the angle of the trend is flattening out. The last high undershot its Balance Line and the upper black channel line, also, prices have been unable to go above the green channel's midpoint. All signs of weakness.
Notice inside the small black channel are 3 drives to a top. Usually after that formation, you get a sizable correction or reversal. Typically, price will retrace the last drive and test support at the last swing low, bounce and retest the high.
Price has violated the lower green channel line. That line is likely to act as resistance to any up move. Notice the last Balance Line I have drawn, the down swing is not complete but it is my SWAG as to where is should be drawn. It is parallel to the green channel and slightly above its lower line, it should be the price target for the next upswing.
Yeah, Einstein! It appears to be a software glitch with the website. I can get around that by using a unique name for each chart so they wont replace a previous one. Iknew about this , i simply forgot! THX!
Emini Day Trading /
Daily Notes /
Forecast /
Economic Events /
Search /
Terms and Conditions /
Disclaimer /
Books /
Online Books /
Site Map /
Contact /
Privacy Policy /
Links /
About /
Day Trading Forum /
Investment Calculators /
Pivot Point Calculator /
Market Profile Generator /
Fibonacci Calculator /
Mailing List /
Advertise Here /
Articles /
Financial Terms /
Brokers /
Software /
Holidays /
Stock Split Calendar /
Mortgage Calculator /
Donate
Copyright © 2004-2023, MyPivots. All rights reserved.
Copyright © 2004-2023, MyPivots. All rights reserved.