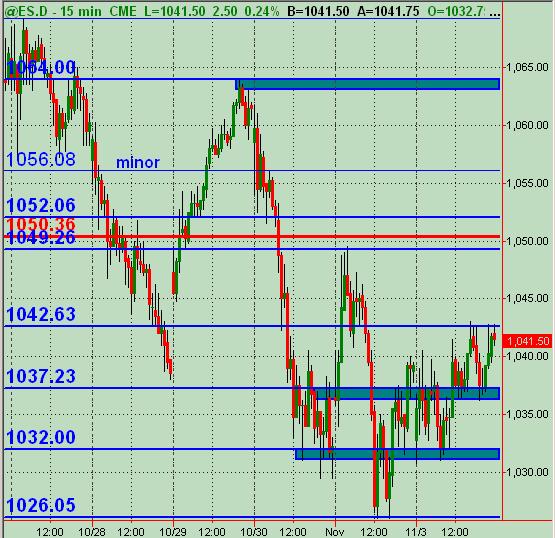
ES S/R Map for 11-4-09
Here's what I've got for potential S/R price action levels/zones (blue lines). The 1056 (and up to 1058) is a minor and "messier" area, but 56 is also the .786 fib rtc back up to the high of 1064 on 10/29/09 ... though I'm not a huge fib fan. My daily chart shows 50sma near 1049. The red line is Wkly Mid-Pvt.
Likely a funky day Wednesday due to Fed. Mkt currently trading at 1044 in night session. Interested in feedback and any other analysis!
Likely a funky day Wednesday due to Fed. Mkt currently trading at 1044 in night session. Interested in feedback and any other analysis!
Click image for original size
damn you kool....lol..I'm short from 55.25 but seems like volume needs to round out...not expecting much but if real lucky they'll go for the 41 area.....seems more likely to chop
and longs for u will try for 62
that 51 looks like they want to fill it in.....
was typing in that the tape looked heavy and was trying to find a good short entry ... and that's when it broke on down out of around 52 ... no entry ... wish I'd posted sooner fwiw
hope you booked profits Kool and hope you got runners on Bruce
tried a short and tried to scratch out of it and lost 2 ticks ... finally found a way in on a small bounce (micro bounce) short @49 ... out @47 ... scalp ... think I'm done for day
42.50 and 37.25 are what I have as signif price levels below current mkt for now still
42.50 and 37.25 are what I have as signif price levels below current mkt for now still
44.50 is my best ...one measly one left...I want that 41.50.....r they going for 37.50???without me
yeah, my freakin screen froze..had to reboot !!! saw on tv it was around 1056 or 7!..when my screens came back up it had already declined back to 1053 so i bailed! ended up plus 5 handles on the day ,so what the heck!
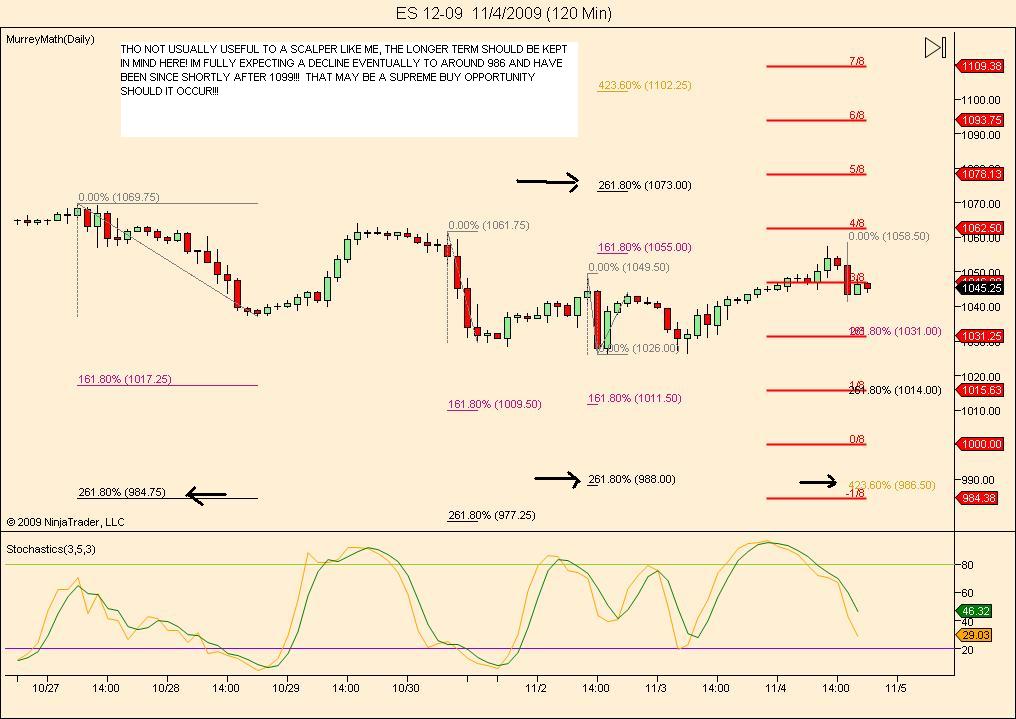
look for strong down early tomorrow! (mid to low 30"s) then a big rebound into early next week!...
Click image for original size
Emini Day Trading /
Daily Notes /
Forecast /
Economic Events /
Search /
Terms and Conditions /
Disclaimer /
Books /
Online Books /
Site Map /
Contact /
Privacy Policy /
Links /
About /
Day Trading Forum /
Investment Calculators /
Pivot Point Calculator /
Market Profile Generator /
Fibonacci Calculator /
Mailing List /
Advertise Here /
Articles /
Financial Terms /
Brokers /
Software /
Holidays /
Stock Split Calendar /
Mortgage Calculator /
Donate
Copyright © 2004-2023, MyPivots. All rights reserved.
Copyright © 2004-2023, MyPivots. All rights reserved.