JA
jarek
Rep: 94
Posts: 3,474
Another new high on Monday morning. I guess less and less shorts want to keep their positions over the weekend so once this sequence fails it might be a spectacular failure
JI
jimkane
Rep: 3,058
Posts: 33,089
Originally posted by jarek
These are the lines I was watching today. I know though that Jim will not like the ABCD labeling - "where is the trend, where is the correction?" :-)
Well, if you think that high is a PTA, then this is a fine 'W2' setup. I just don't see the setup to call that a top. So it's back to fighting the trend and finding W2's to do it.
What I am watching more here is the ABCD variation that hit at the lines at 15:32. Again, every time it pulls back in the uptrend I keep looking for patterns and setups, and many in here just keep fighting the trend. I can't explain why that is, I can only point it out...
BTW, did anyone notice that the division line set I mentioned yesterday as being so cool, it was 'tested' in GLOBEX twice, and the drop today was right back there for number three (not counting the hit yesterday that sent it up a bit). And this pattern low we just had, that was back at the TL I mentioned, which also hit close to that division line for all those hits on that. Support has been very clear along here. Long from support, that's my style.
JA
jarek
Rep: 94
Posts: 3,474
Thanks Jim. Actually after the last run up I'm not bearish anymore :-) Maybe I'm a bit leaning towards this double top but as I explained earlier only as a confirmation of a long term bull.
I'm leaving again till the end of the week. Hopefully someone beside you will post something in the next 2 days...
I'm leaving again till the end of the week. Hopefully someone beside you will post something in the next 2 days...
JI
jimkane
Rep: 3,058
Posts: 33,089
New highs for the entire 'bull' today in $MID, $RLX, $COMPQ, as well as others, and financials up for ten straight days!
If jarek were here I bet he'd be mentioning this bearish ABCD right here in the ES :-)
If jarek were here I bet he'd be mentioning this bearish ABCD right here in the ES :-)
JI
jimkane
Rep: 3,058
Posts: 33,089
Well, what a nice close on the high tick for the day. The S&P cash finished under a half of a point from the 'bull' market high, and the ES is just 1.75 points away. Consider that this includes the rollover, which rolled at like five points lower, it's really at a new high. Go back to the March contract, which is still trading (today was the first day of rollover), it took out the Jan high handily (by a full three points), and is trading at a new contract high, and a new high for the 'bull'. And of course look at the other indices I mentioned, they are just smokin' off at new 'bull' highs. Those W2'ers just never learn...
BTW, crude looks ready to set a new high for the entire 'bull' soon. Look at unleaded (XRB #F), just blasting off to a new year and a half high. Can you say inflation? Here's a thought. Demand is super low now. We are in severe recession. Driving is way down. The weather is warm. Yet look at the price of unleaded and crude. Imagine if the economies were truly fantastic, driving was way up, the weather was cold, China was buying like crazy, and so on. If prices are this high now, imagine if things were strong and the dollar continued to weaken. And recall what happened last time when prices rose so much at the pump. Keep in mind, and this is just not talked about at all, in just over one year the cost of unleaded has tripled. Pull up a chart and look for yourself. Tripled! And the economy and demand suck. Hyperinflation is coming, folks, in staples we use. Maybe not in assets, but in staples, for sure, in my opinion.
BTW, crude looks ready to set a new high for the entire 'bull' soon. Look at unleaded (XRB #F), just blasting off to a new year and a half high. Can you say inflation? Here's a thought. Demand is super low now. We are in severe recession. Driving is way down. The weather is warm. Yet look at the price of unleaded and crude. Imagine if the economies were truly fantastic, driving was way up, the weather was cold, China was buying like crazy, and so on. If prices are this high now, imagine if things were strong and the dollar continued to weaken. And recall what happened last time when prices rose so much at the pump. Keep in mind, and this is just not talked about at all, in just over one year the cost of unleaded has tripled. Pull up a chart and look for yourself. Tripled! And the economy and demand suck. Hyperinflation is coming, folks, in staples we use. Maybe not in assets, but in staples, for sure, in my opinion.
RO
roofer
Rep: 3,689
Posts: 3,574
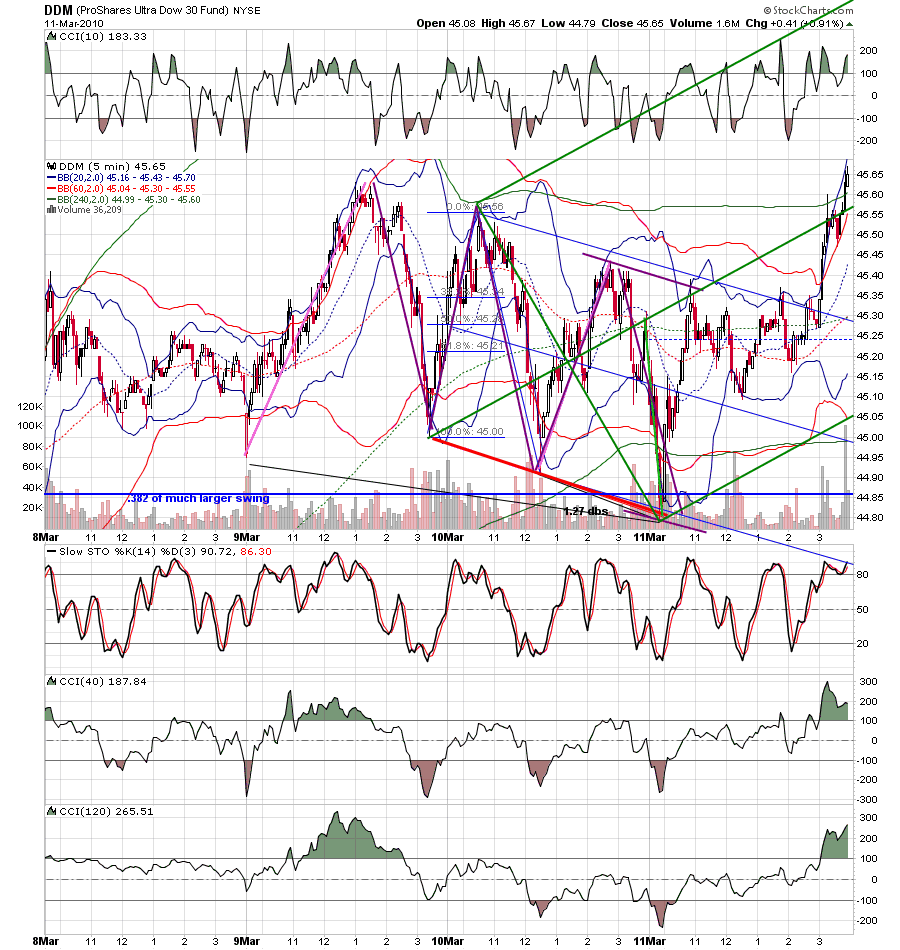
my apologies for stopping by... but this is the only place where the absolute beauty of the today can be appreciated by an aware audience.we know in advance that we want to trade a completed abcd at .382 and that the bc leg often takes an ABCD FORM. we know in advance that we want to trade THE TRADE,especially if it is based on the 1.27double barrel shotgun and especially if they both trigger with the collapsing geometry of the BLT trade.we know in advance that sharp back to back moves call for modified schiff sets and we know in advance that an undershoot calls for an overshoot .what is remarkable is that all of this geometry was available to the prepared trader on yesterdays close.it was simply a matter of seeing if price collapsed into the geometry.the computers that are running the markets are very very good... but i believe the tools of this forum have got'em pegged.
Click image for original size
JI
jimkane
Rep: 3,058
Posts: 33,089
Hey, roofer. Yeah, it was really pathetic to see those magnificent posts you did in the public area, and even after my attempt to stir up interest for them, not a single response. You did get some 'up' votes, which was good, but no discussion or questions. I came to conclude that no one there is really able to follow along or grasp what you are showing. If nothing more, at least myself and a few people in here understand what you are showing. That's not much, but it's better than nothing.
You notice I didn't even get a single post today? I can point out area after area, I can do five or ten pages of notes in a day, I can even show charts (which, at this stage of the game I believe are the students' jobs to post, not mine, I just give the hints), but it just doesn't matter, at best I get little bursts of activity here and there. Mostly, it's just dead. So, we are part of a dying art, roofer. You, me, joed, a few others, and the few we can show this to, and that's it. I wish it were more, it's such a beautiful art, but it's not.
You notice I didn't even get a single post today? I can point out area after area, I can do five or ten pages of notes in a day, I can even show charts (which, at this stage of the game I believe are the students' jobs to post, not mine, I just give the hints), but it just doesn't matter, at best I get little bursts of activity here and there. Mostly, it's just dead. So, we are part of a dying art, roofer. You, me, joed, a few others, and the few we can show this to, and that's it. I wish it were more, it's such a beautiful art, but it's not.
RO
roofer
Rep: 3,689
Posts: 3,574
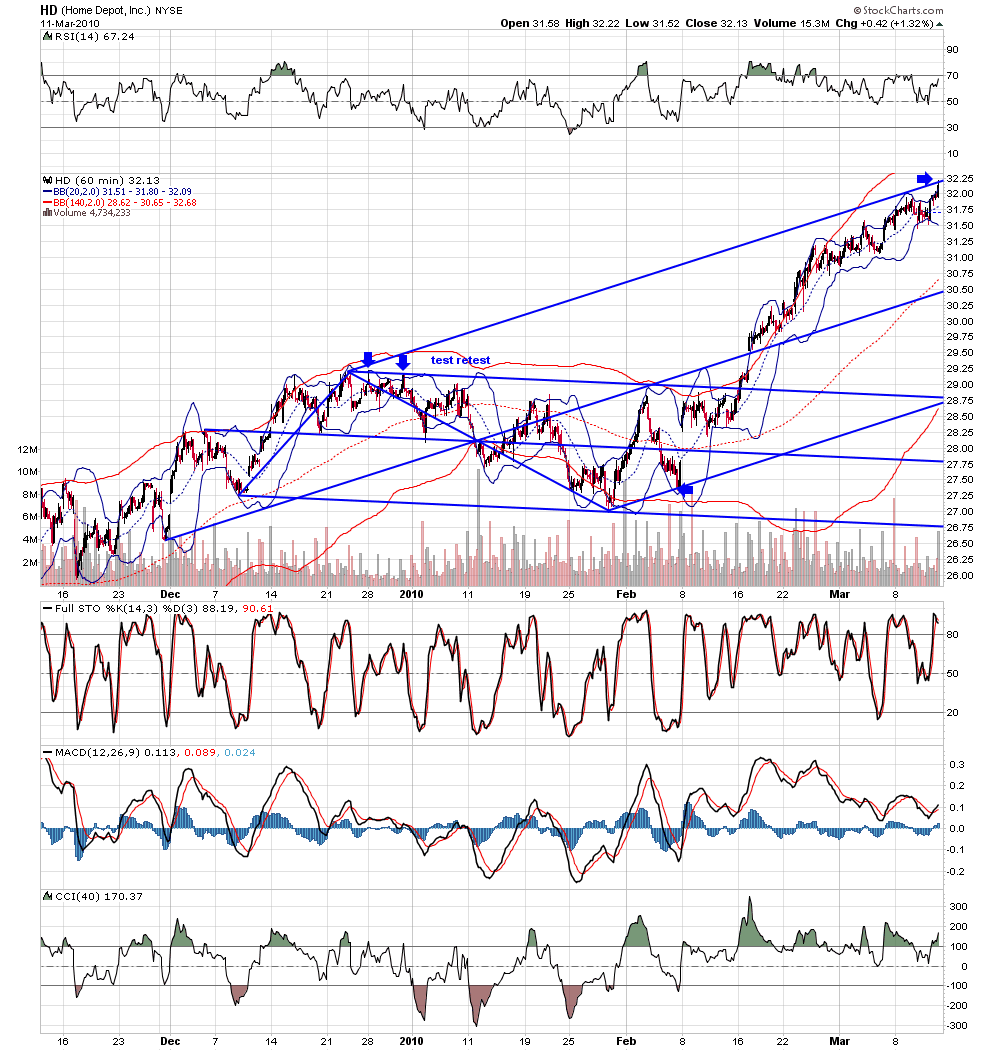
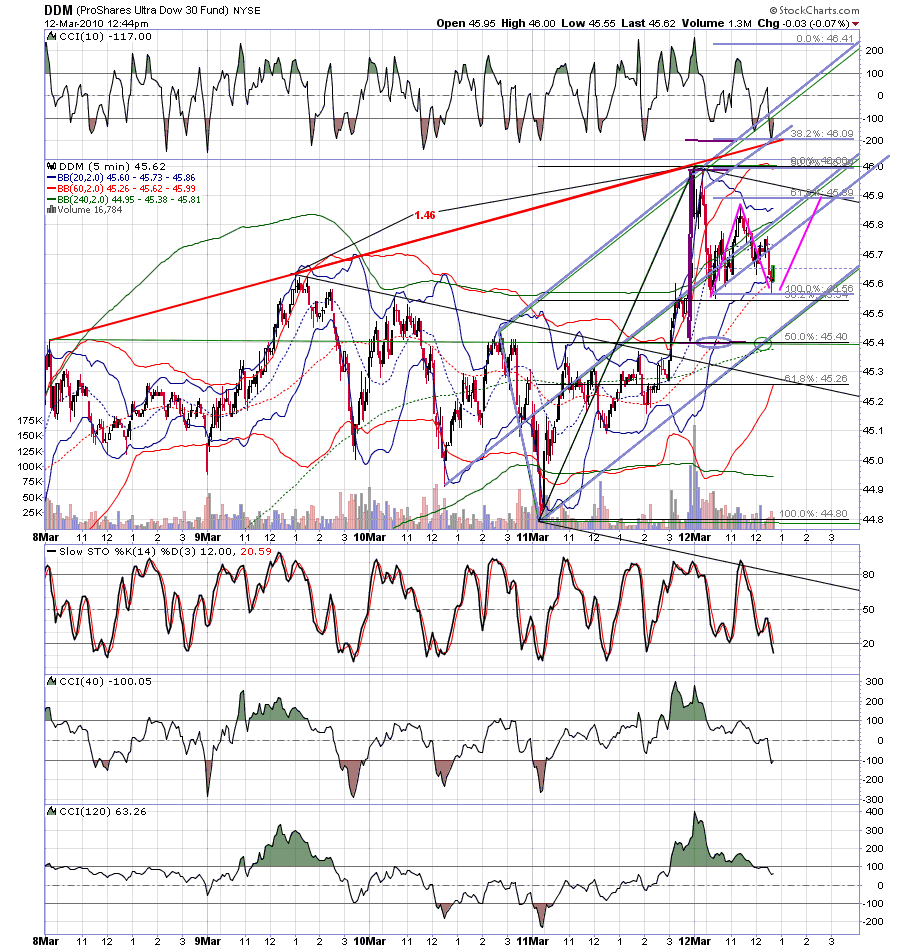
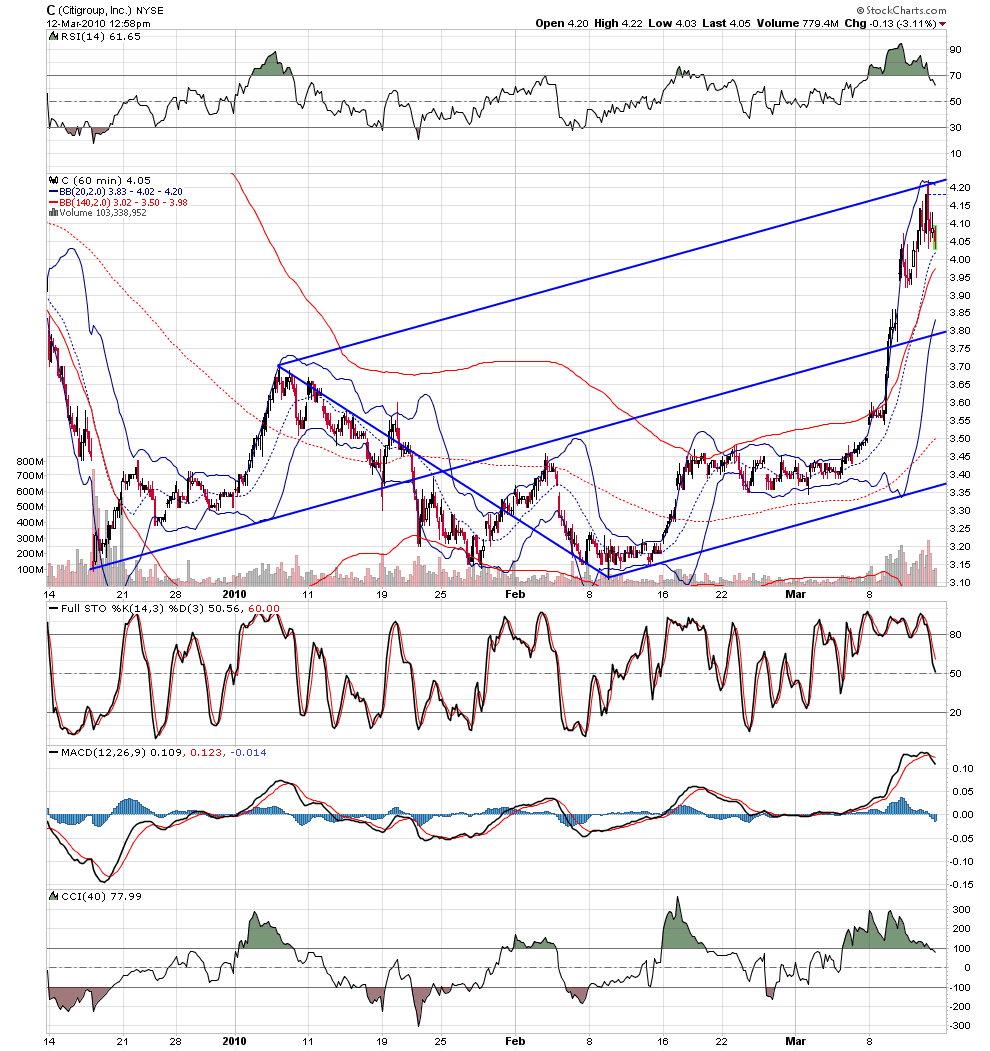
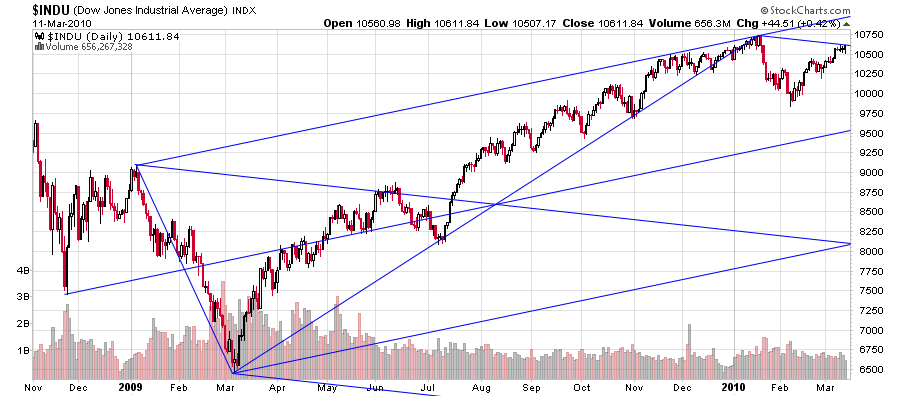
i would like to say this....a high percentage of my 60 min charts have traded to targets,HD being one of the laggards, but look where it closed today.... the tools worked perfectly on small time frame....and the INDU is at the crossroads....the geometry of resistance is in place... perhaps it will generate a new set of abcd's to launch higher.....
Click image for original size
Click image for original size