Time & Sales Window
Hi,
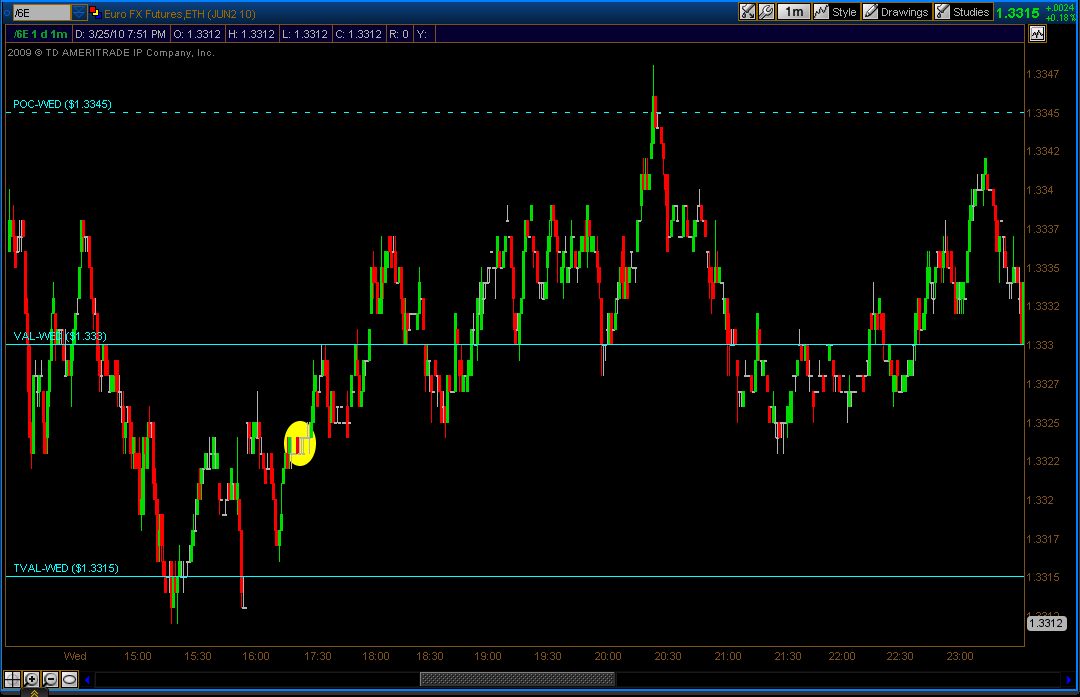
Yesterday between 17:25 and 17:31 Chicago time, I was trading the 6E euro fx, and usually at that time there is no much orders in the dome, at the ask side may be no more that 60 orders at every level and the same for the ask side, but yesterday at the level of 1.3324, there was more that 400 at the ask ready to short, I thought that they may be just trying to pull the price to that level and when it get close they will remove the orders, so I open the Time and sales windows and I wait for the price to get to this level, when the price touch all this order they start to get filled but at the bid side was not any order.
Mi first question here is: to who were all this orders sold if not one was at the bid side.
The time and sale windows show the sell fills as follows all in the same minute:
42,22,24,25,24,25,24,24,23,10,8,5,8,5,8,8,11,13,8,9,16,8,8,8,8,8,3,3.2,2,3,2,4,2,2,.
My second question is: as you can see in the chart the price went up, but why if there was a big selling, why the price went up, and later when the price came down to the same level it have I big drop.
I hope that I explain it correct.
Thank you
Click image for original size
Click image for original size

Originally posted by Roberto Bnvdz
...so I open the Time and sales windows and I wait for the price to get to this level, when the price touch all this order they start to get filled but at the bid side was not any order.
My first question here is: to who were all this orders sold if not one was at the bid side?
The orders that you see in the DOM or DOME are limit orders. These are bids and offers that traders are prepared to buy and sell at. The actual trades that you see being executed against these limit orders are mostly market orders. These are trades that execute at the lowest selling price (if buying) or the highest buying price (if selling). Technically you can also buy using a limit order by placing the limit order at the current ask price where orders are showing. This guarantees that you won't pay any more than that price if the market moves while you are placing the order.
So the answer to your question is that they were probably market orders that won't be listed in your trading window because they get executed immediately against the best limit price.
That explains a lot.
Thank you day trading for taking the time to answer my question.
Thank you day trading for taking the time to answer my question.
Originally posted by Roberto Bnvdz
Hi,
...My second question is: as you can see in the chart the price went up, but why if there was a big selling, why the price went up, and later when the price came down to the same level it have I big drop.
Thank you
Hi Roberto,
I don't know if this answer is specific to your exact example. I trade the ES (S&P eminis).
At a clear resistance level, there will be some buy-stop orders above it (these are people that are short the market and have a buy-stop to protect themselves) Also, there will be some limit-buy orders (these are are break-out buyers who buy when a key resistance level is broken.)
If the market is close to a cluster of these limit buy orders - in this case just below a cluster of limit orders (both buy-stop orders and buy limit orders), first the floor traders will take a long position.
Then the floor traders will then push up the market to hit the limit orders. This will cause limit orders (both buy-stop orders and buy limit orders) to be triggered and the market will accelerate higher feeding on the fuel of new incoming buy orders.
The floor traders know that when they exhaust these buy orders the market will fall. So after they "run the stops" they close their long position, reverse and go short.
So they make money both on their long position they established before raiding the limit orders and on the sell orders they take at the peak.
These may be why you see it rise and then fall, as you described.
I hope this is of help.
Blue and day trading thank you for your explanation that help me a lot.
Click image for original size
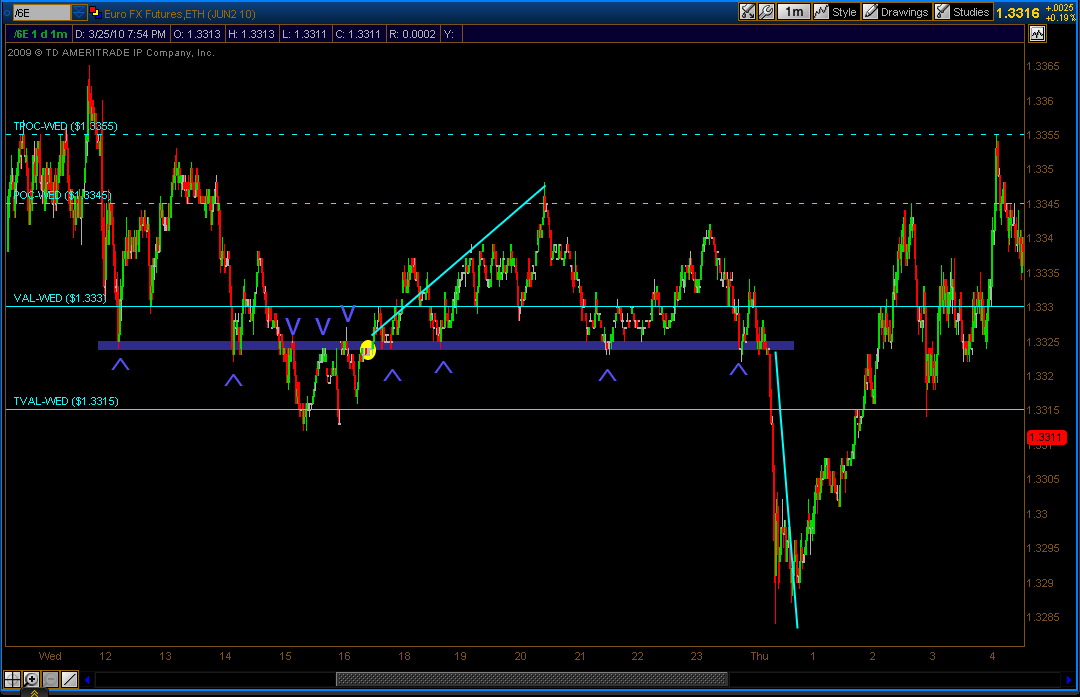
I think what you found was a key pivot level the market was acting on, and the unusual limit order depth at the price level was conveying or confirming that market information to you.
Looking at your chart, I drew a blue horizontal line at your price level of interest. Notice, starting at the left side of the chart, the price level was established by a swing low which was successfully subsequently retested and held as support. The third test of the price level broke, at which point the rule of support and resistance came into effect, where prior support when broken then becomes resistance. The unusually large market depth on the offer you observed was confirming this concept. Once the level was broken through however, at your highlighted zone, the resistance then became support, as noted by the several successful tests of the level. Note at the end of the blue line on the right side, the level once again broke and in this case lead to an immediate and precipitous dive in price.
Emini Day Trading /
Daily Notes /
Forecast /
Economic Events /
Search /
Terms and Conditions /
Disclaimer /
Books /
Online Books /
Site Map /
Contact /
Privacy Policy /
Links /
About /
Day Trading Forum /
Investment Calculators /
Pivot Point Calculator /
Market Profile Generator /
Fibonacci Calculator /
Mailing List /
Advertise Here /
Articles /
Financial Terms /
Brokers /
Software /
Holidays /
Stock Split Calendar /
Mortgage Calculator /
Donate
Copyright © 2004-2023, MyPivots. All rights reserved.
Copyright © 2004-2023, MyPivots. All rights reserved.