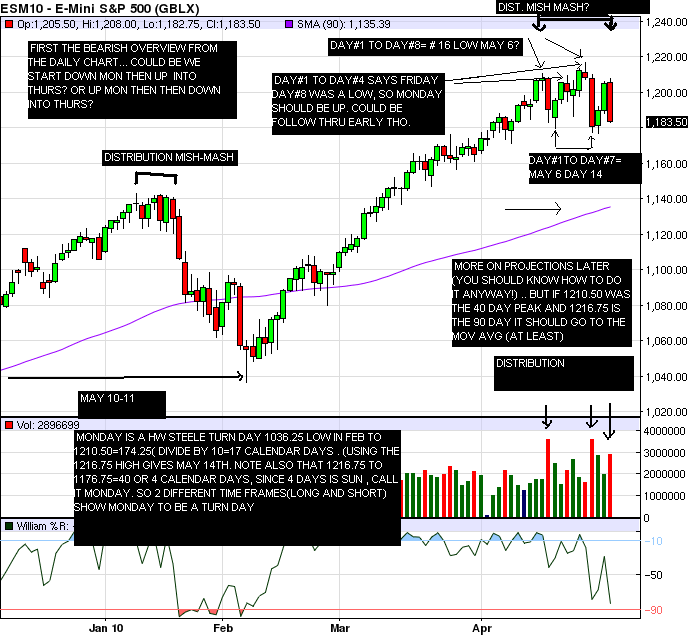
ES short term trading- Weekend preview 5-01-10
Click image for original size
Thx guys but id trade my chart skills for one tenth of your trading skill, Bruce. Ive begun watching for air religiously and have always paid some attention to P.V.I love the triples, but dont seem to see them too often.
Told ya that 1189 area was resistance and might be ripe for a short scalp... happily short from 1189.25, covered at 1186.75.. plus 2.5 .. now i'll sleep better! C ya in the morning!
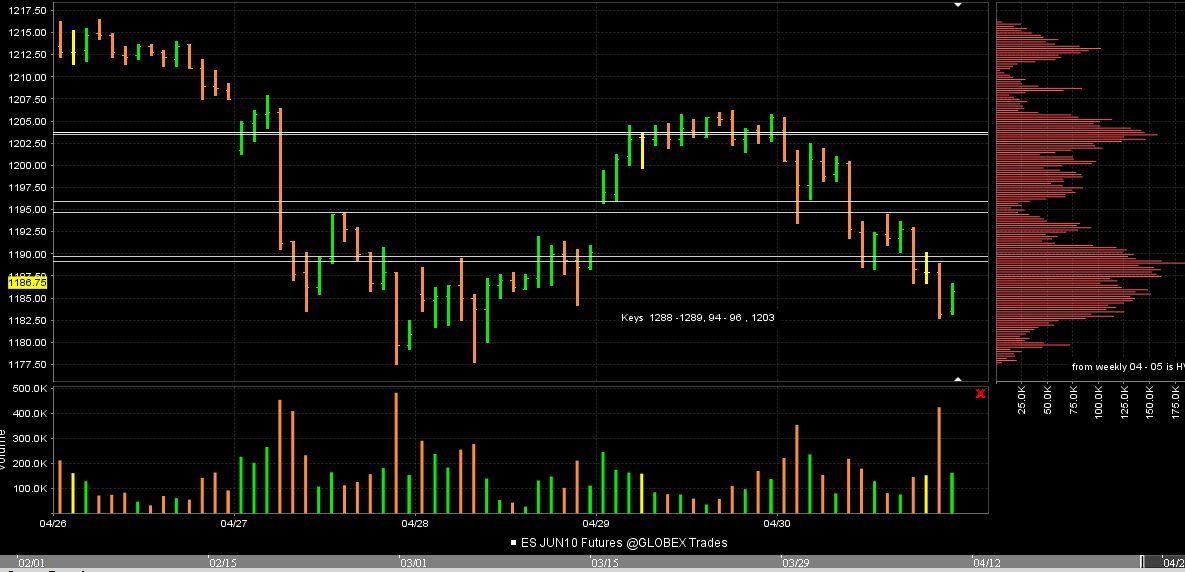
This chart may go well here. It is the volume profile of last weeks RTH session. The key areas where we had the most Volume last week are
1288- 1289
1203
The area that attracted the least volume is the 94-96 area that is inbetween the high volume prices.
Two weeks ago we had the 95 - 97 area and 1204-1205 so things seem to be manipulated in the same areas. I'd be surprised if we don't see another test of 95 and soon. Here is the chart.
Click image for original size
Nice trade Kool!!
nice trade Kool
Bruce;
In your chart above that high volume area 1289 1288 1203, are
these areas in what you call air..
In your chart above that high volume area 1289 1288 1203, are
these areas in what you call air..
No Red..the numbers you mentioned are areas where we spent a lot of time trading. If you look at the right side histogram you will see the high peaks.
The air would be areas of low peaks and little time trading there...Like the low area at 94 - 96 on the histogram.
Let me know if you understand and if not I'll try to explain it clearer.
The air would be areas of low peaks and little time trading there...Like the low area at 94 - 96 on the histogram.
Let me know if you understand and if not I'll try to explain it clearer.
What I meant to say is:
last week were the #s 1203 1188 1189 trading in an area of air
then when you ran the profile this area was a high volume area
last week were the #s 1203 1188 1189 trading in an area of air
then when you ran the profile this area was a high volume area
Emini Day Trading /
Daily Notes /
Forecast /
Economic Events /
Search /
Terms and Conditions /
Disclaimer /
Books /
Online Books /
Site Map /
Contact /
Privacy Policy /
Links /
About /
Day Trading Forum /
Investment Calculators /
Pivot Point Calculator /
Market Profile Generator /
Fibonacci Calculator /
Mailing List /
Advertise Here /
Articles /
Financial Terms /
Brokers /
Software /
Holidays /
Stock Split Calendar /
Mortgage Calculator /
Donate
Copyright © 2004-2023, MyPivots. All rights reserved.
Copyright © 2004-2023, MyPivots. All rights reserved.