ES short term trading 5-25-10
Intense overnight action , pretty much drives a nail into the bulls heart i think. Breaking the 1036.25 feb low would be devastating. I had hoped that we would find a bottom by the 24th,and as we havent broken the feb low yet , we surely seem destined to do so. I said yesterday i thought today might be the bulls last chance. Prophetic to say the least. i believe the original target of 1014 or so may be in the works,although a short ,quick rebound rally could occur at any time.In fact i got home right as we were hitting 1041.50 and went long instinctively at 1042.25. Remember the previous weekend preview, that 1041.50 number was explained. my one min chart showed 1.618 at 1045.50 and 2.618 around 1048 so i exited early at 1045.00. truth be told that was a pretty lucky trade. Were already 30 handles south of yesterdays close and tho i have no idea what happens between now and the open, i'll bet we see lower yet today. Take note that even tho the june es feb low was 1036.25, the current globex low of 1041.50 equates roughly with a cash spx exactly at its feb low!(1044 if memory serves) . Again ,not good! Gonna sleep.. see ya soon.
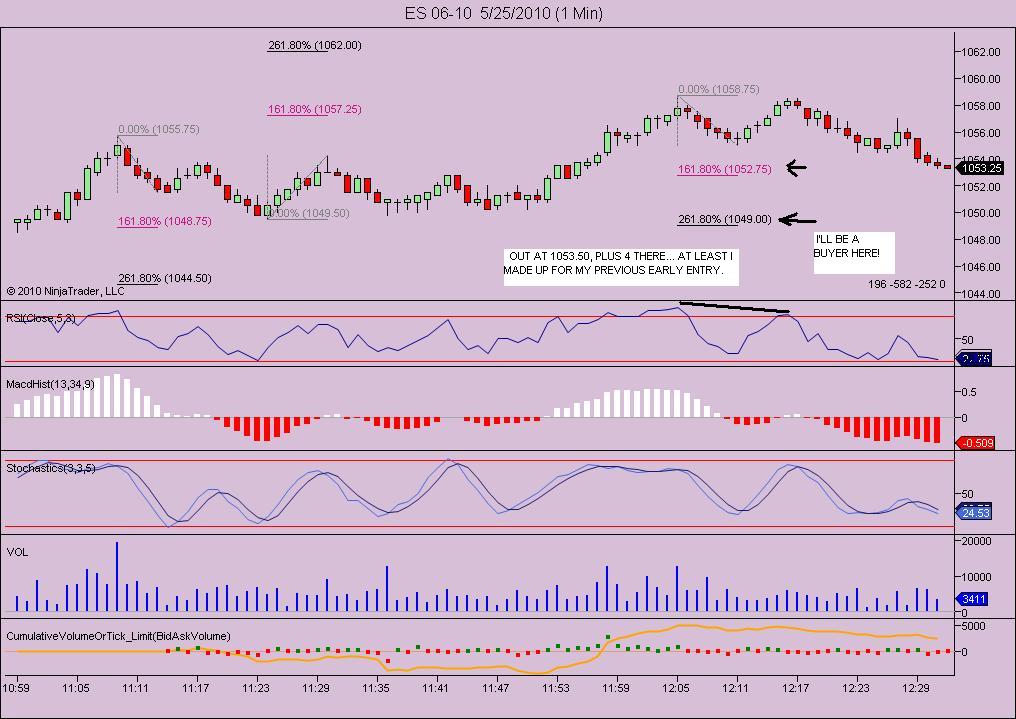
SHORT AGAIN FROM 1057.50...looking for 1053(1052.75)area
Is anybody here besides me and Bruce? ... Lets have a roll call! I want to see if continuing this thread is helpful (cause its really difficult to trade and post!).. so if you want more better sound off!
I'm here. Been out most of the morning.
For some reason I can't edit my posts but I just wanted to say that I enjoy these threads and read them daily as they progress.
Click image for original size
you guys do great work here, but don't let it get in the way of your trades.
Thx, Tony, Piker... Just trying to decide if its worth the effort. ... hey MCT, that last call (1052.75) was for you!..lol....
Click image for original size
Koolblue,
What is that indicator in your chart that shows fib levels on the fly (where you show hand-drawn arrows)?
What is that indicator in your chart that shows fib levels on the fly (where you show hand-drawn arrows)?
I read every post that you and Bruce post and I appreciate them very much. I'm learning a lot from you guys.
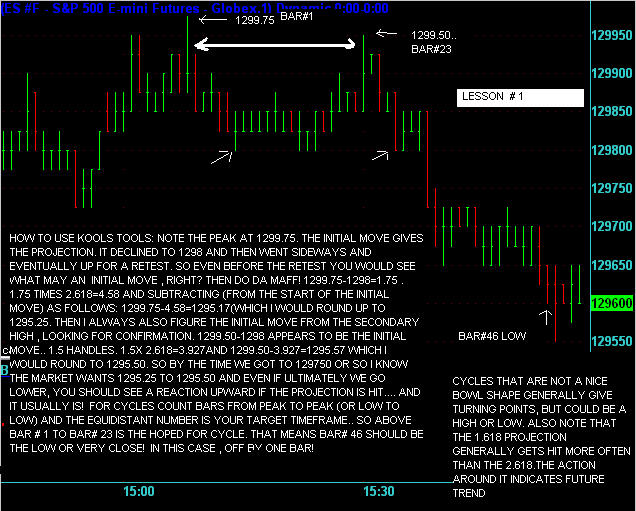
I use ninja and its simply the fib extention tool under drawing tools i have it set for 1.618 (most often hit, almost a given) 2.618 (the usual target in a decent uptrend or downtrend) and the 'termination ratio' 4.236 achived during very strong moves and often an important turn point. The premise is that the initial move forecasts how much gas is in the tank for a move... maybe this will help....
Click image for original size
now how about 68.75...that would be perfect....as long as 75 doesn't hold......otherwise they will revist 81.25.... c ya in the a.m.
Emini Day Trading /
Daily Notes /
Forecast /
Economic Events /
Search /
Terms and Conditions /
Disclaimer /
Books /
Online Books /
Site Map /
Contact /
Privacy Policy /
Links /
About /
Day Trading Forum /
Investment Calculators /
Pivot Point Calculator /
Market Profile Generator /
Fibonacci Calculator /
Mailing List /
Advertise Here /
Articles /
Financial Terms /
Brokers /
Software /
Holidays /
Stock Split Calendar /
Mortgage Calculator /
Donate
Copyright © 2004-2023, MyPivots. All rights reserved.
Copyright © 2004-2023, MyPivots. All rights reserved.