ES short term trading weekend preview
All the bloggers were looking for 1120-1140 but i told ya 2 weeks ago i thought the rally would fall far short of expectations.Though i expect another good rally attempt into mid week , i believe lower prices are still possible, perhaps by the end of the week. I'm on record as saying new all time rally highs are still forthcoming as long term cycles are up into late July -August, and i still feel that way. Adv-dec data, new highs, etc have indicated that back at the April peak. Its interesting how first we have companies go into financial trouble (a normal situation) and now this year, it seems, whole countries are going bankrupt! Greece, Hungary, Spain, Portugal,etc. This is the secular bear raising its ugly head . (or K-wave winter? take your pick). For us traders its manna from heaven! Volitility should stay high till Jan. For those of us who were trading before 2008, where the daily es range was closer to 10 handles , thats making daytrades much more profitable. Enjoy it. Embrace it! Nothing lasts forever.Used to be we all watched G.E. back in the 90's as it always led the market, now watch Goldman sucks. As Goldman IS the market! lol. I would also add, on the short term the Euro currency. On the recent rebound from 1036 i noticed the Euro was just slogging along near its bottom, unable to muster much of a rally, and voila! Note that it just broke its lows.. So is this correction over, price wise? Its certainly possible ,but we dont have the positive divergencies on daily or weekly indicators that you would normally see yet, which argues for an eventual break of the 1036 low. As it stands right now thats my best guess.Since May, ive been expecting 1008-1014 and ,for now, i'll hold with that.(not 800's, or lower ,or P3 or whatever, as with the bloggers). So to summarise, the long term secular bear which started in 2000 slogs on (and will for several more years!) producing huge ups and downs but basically going sideways giving buy and holders nothing!(similar to 1968-1982?)... now to what really matters to us, the short term...
Click image for original size
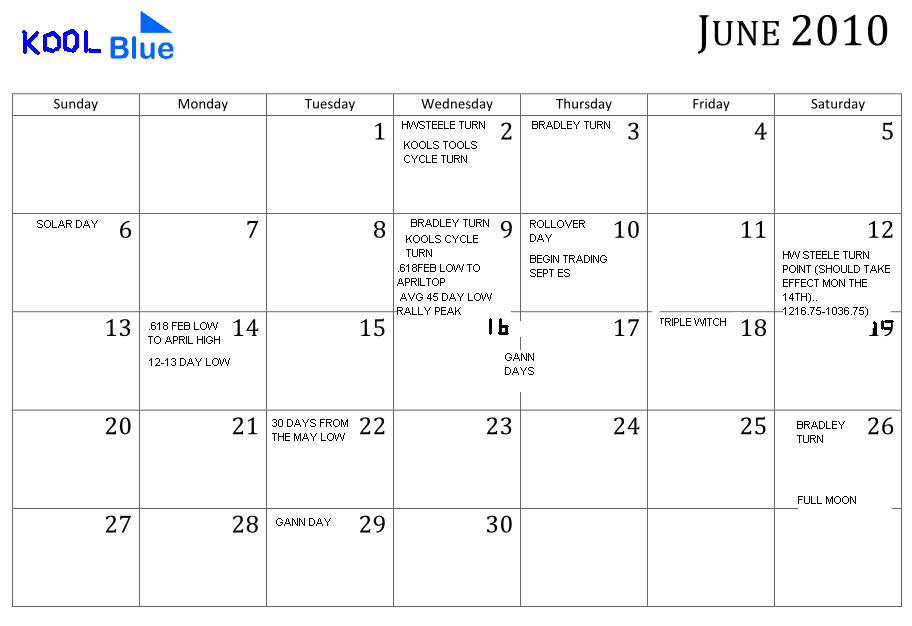
Heres a look at the short term cycle tendencies ,courtesy of Helge...note the high near the 9th and especially low near the 14th?...
Click image for original size
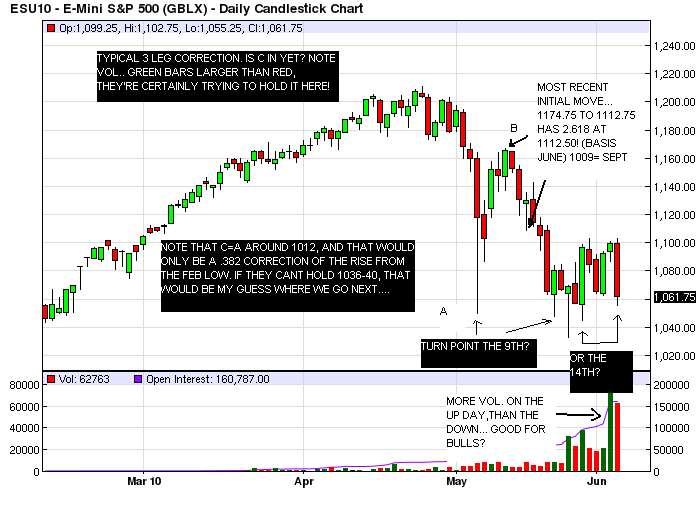
The struggle to find a short term bottom continues, but at least some hopeful signs are beginning to appear...
Click image for original size
AN HOURLY PEEK....
Click image for original size
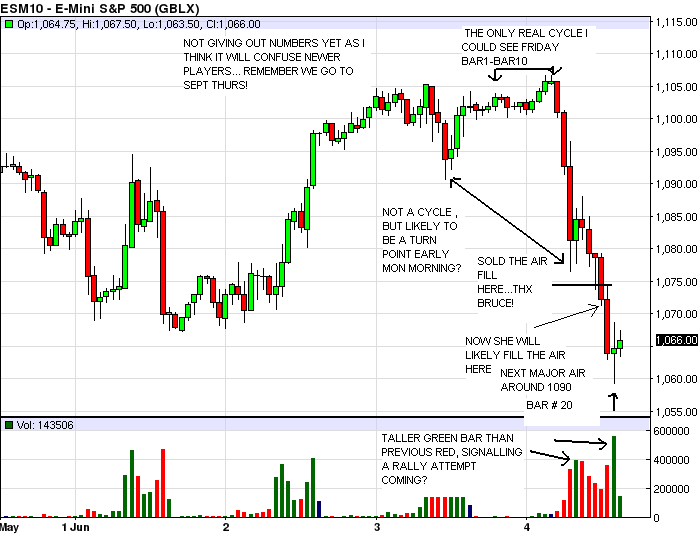
OK, heres the numbers (zones) i'll be watching early next week: 1093.75 13 day ema (declining!), 1091.50-1090.75 hourly air, 1083.50-1085 1/2 fridays range and chart resistance, 1078 30 min prc band, 1077.25 13 min vwap, 1076.25 5 and 13 min 2.618 proj., 1072.5-1073 hourly 1.618 and 5 min air, 1069.75 one min. 1.618 and 5 min prc band, 1063 one min 2.618 proj down,1057.50 30 min 1.618 proj down, 1041-1044 line in the sand (below portends eventual move below 1000!) , 1014.00 C=A on the daily chart, 1012.50 daily 2.618 proj from the 1174.75 top.
Please keep in mind that while fibs, air and projections remain somewhat static, the mov avgs and prc bands can change dramatically. Ideally, 1077-78 looks to be an awesome short while, 1057.50 area should be a decent buy if it even gets down there! Since an hourly cycle bottomed near the close on friday it may or may not. Also , if we should decline back toward the 1041 area, id be careful as its a glass floor waiting to be cracked. Good trading all!
Emini Day Trading /
Daily Notes /
Forecast /
Economic Events /
Search /
Terms and Conditions /
Disclaimer /
Books /
Online Books /
Site Map /
Contact /
Privacy Policy /
Links /
About /
Day Trading Forum /
Investment Calculators /
Pivot Point Calculator /
Market Profile Generator /
Fibonacci Calculator /
Mailing List /
Advertise Here /
Articles /
Financial Terms /
Brokers /
Software /
Holidays /
Stock Split Calendar /
Mortgage Calculator /
Donate
Copyright © 2004-2023, MyPivots. All rights reserved.
Copyright © 2004-2023, MyPivots. All rights reserved.