MyPivots
Sign In
JA
jarek
Rep: 94
Posts: 3,474
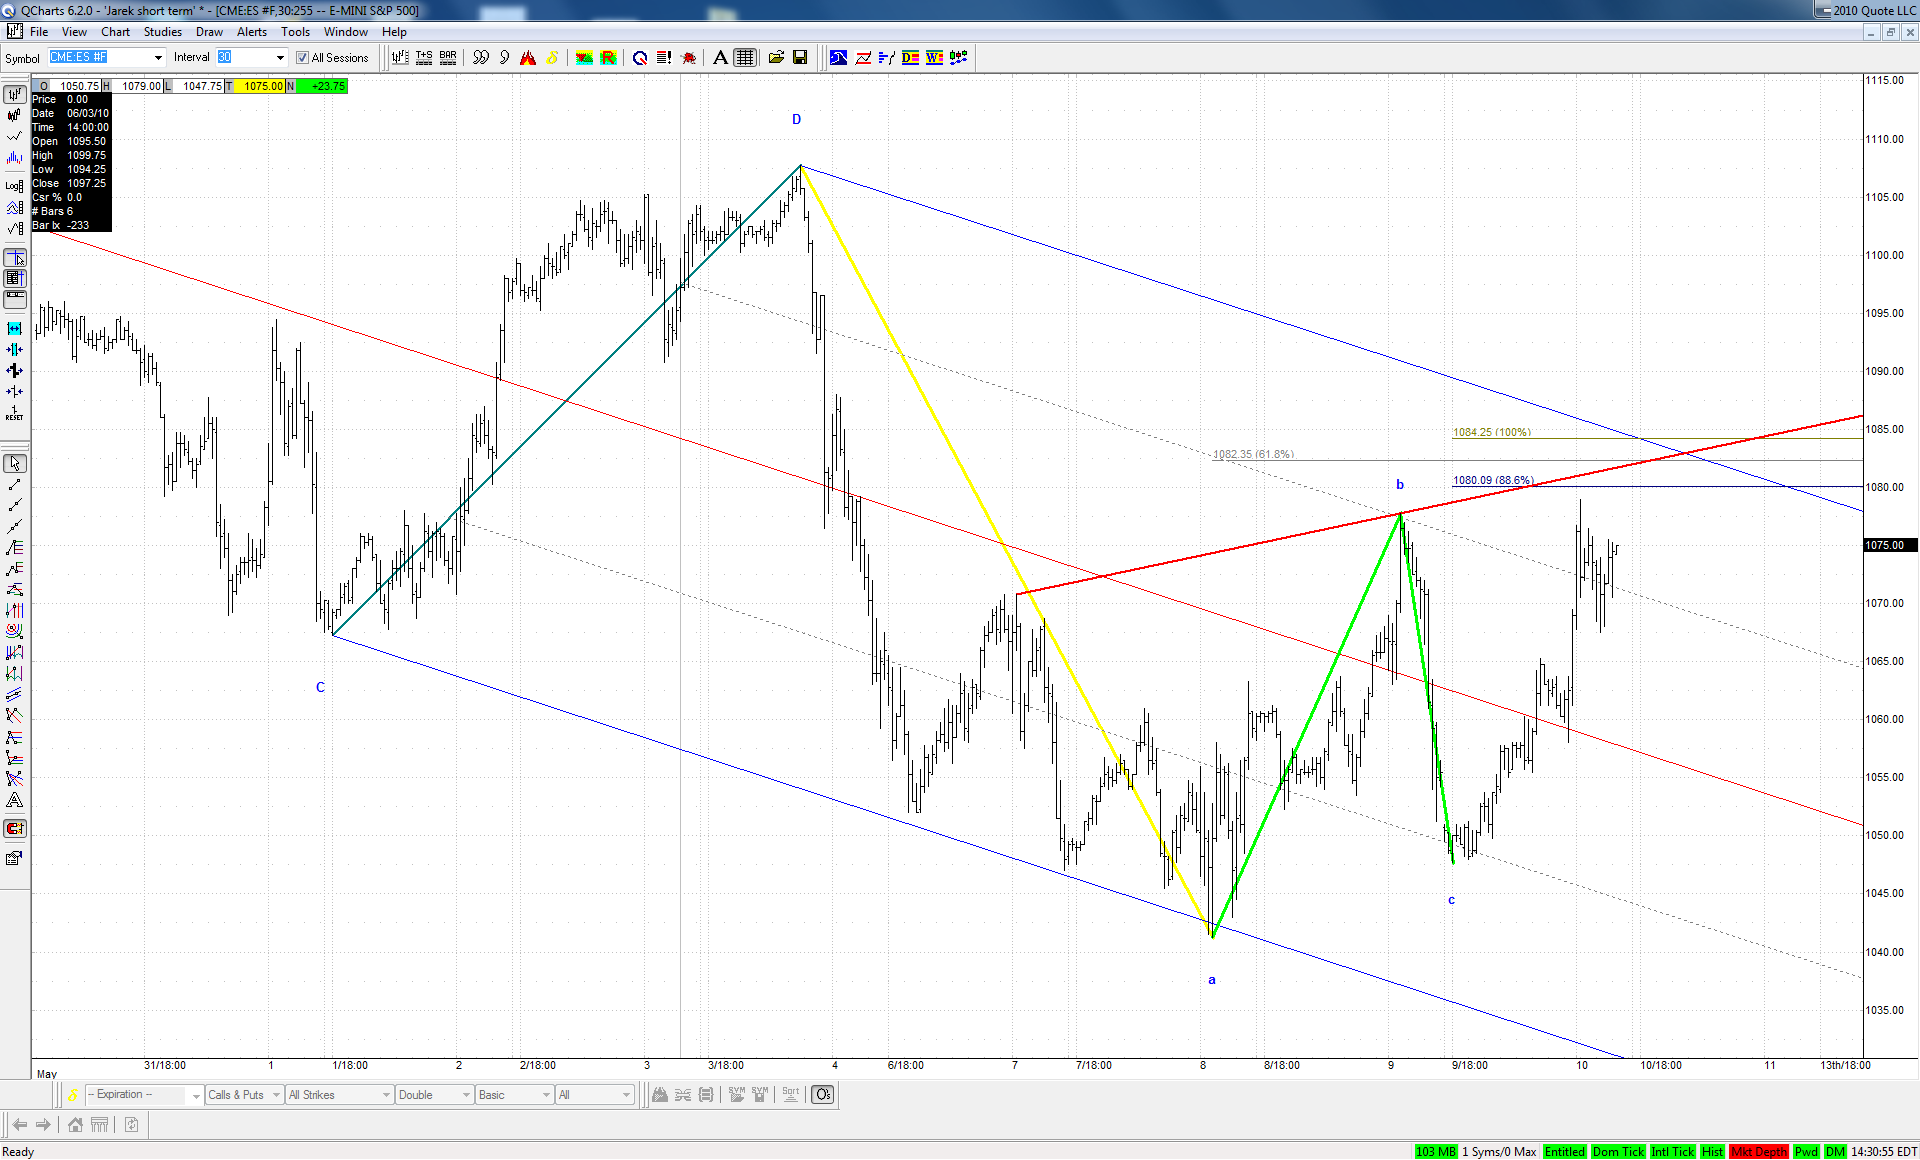
This is how I see the potential bearish ABCD Jim mentioned in his last post on Friday:


Click image for original size
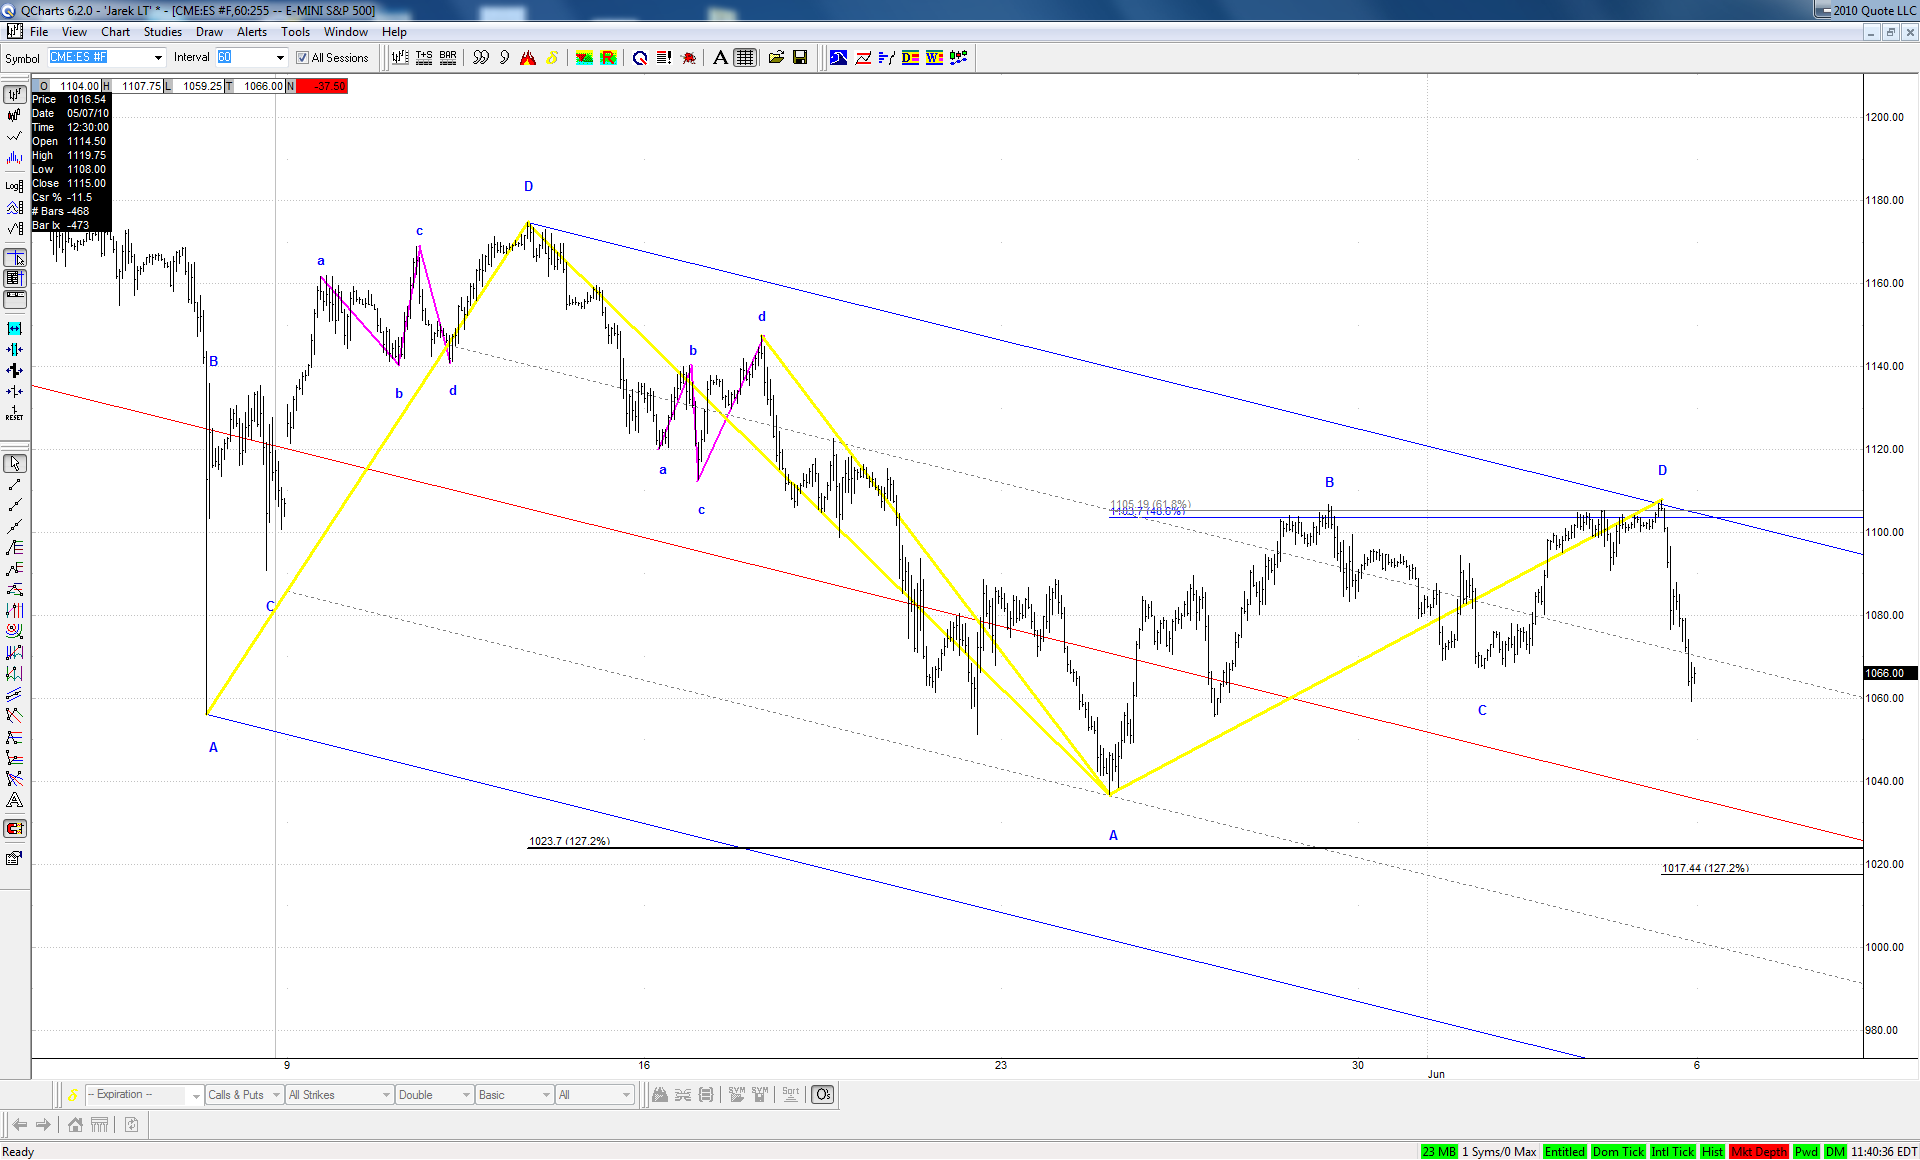


It was rather too big for a W4 of the first move down off the big bearish ABCD from the beginning of the May. But it could have been a big W2 of that move, in which case we would sit just in front of Wave 3 of 3 down.

On the other hand if the whole move off the big bearish ABCD was already finished on May 25th, we may have the second setup Jim pointed out:


Click image for original size
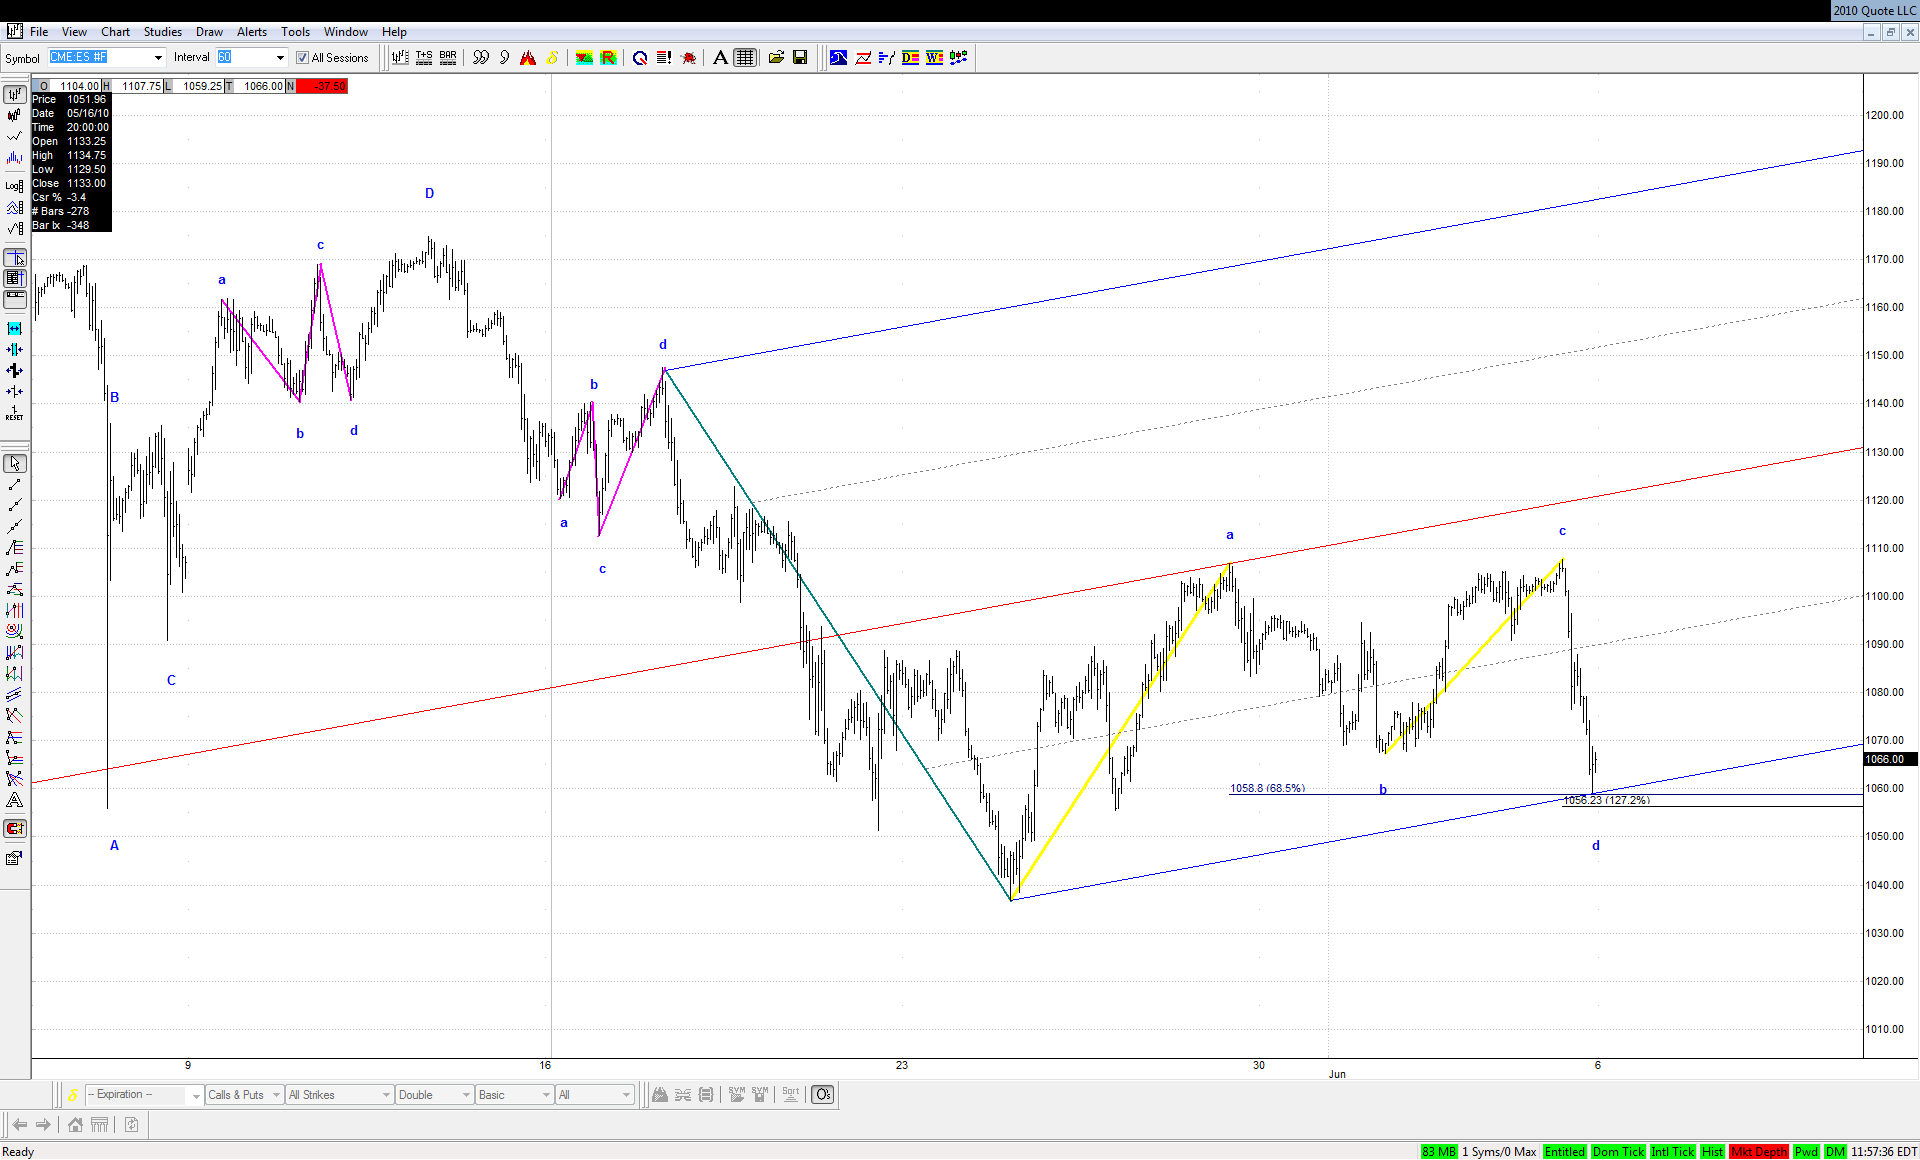


In this case we should expect a smaller W3 up :-)

Either way this is shaping up to be a volatile week.
RO
roofer
Rep: 3,689
Posts: 3,574
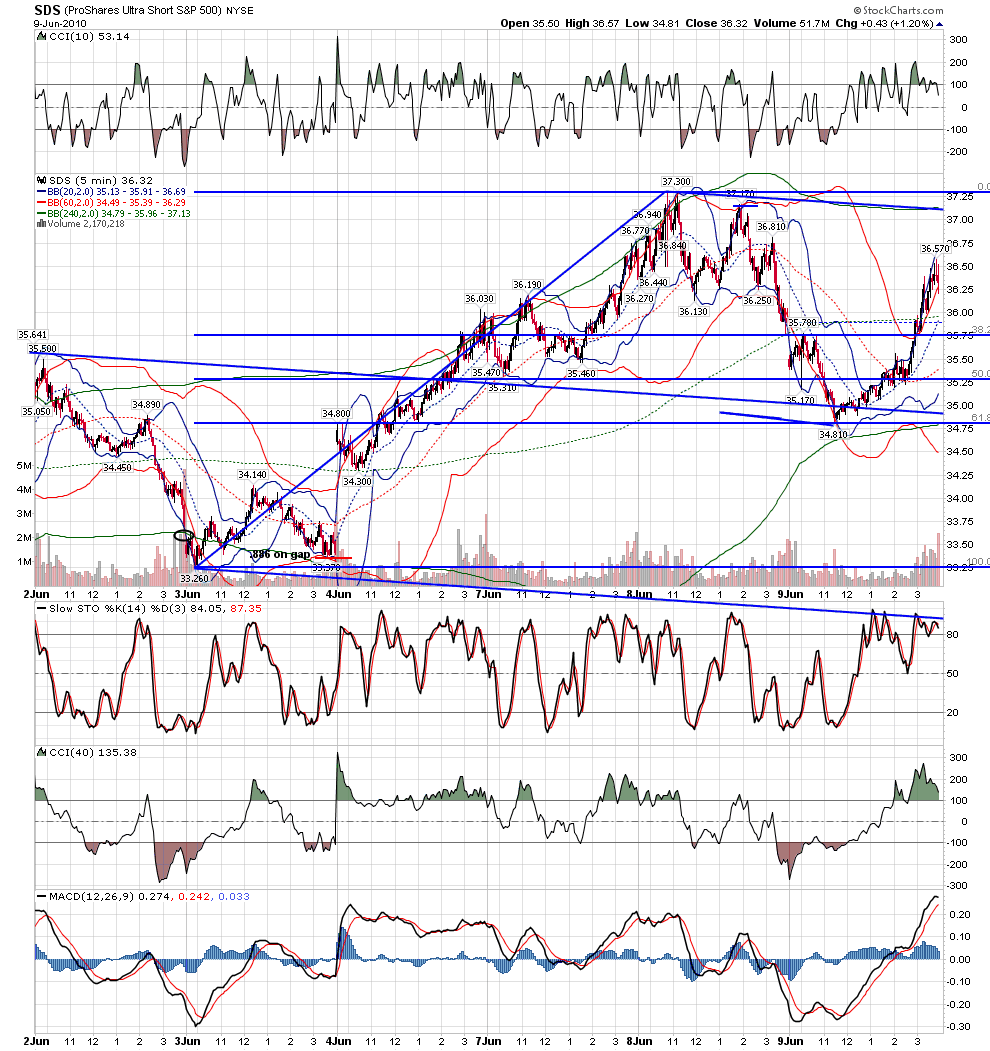
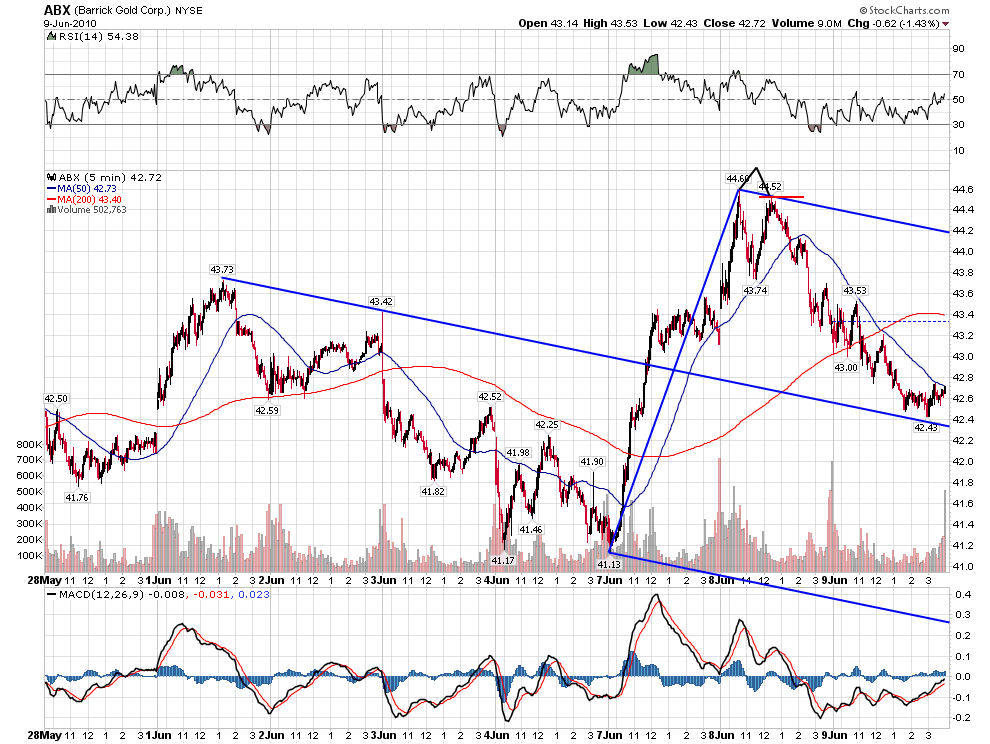
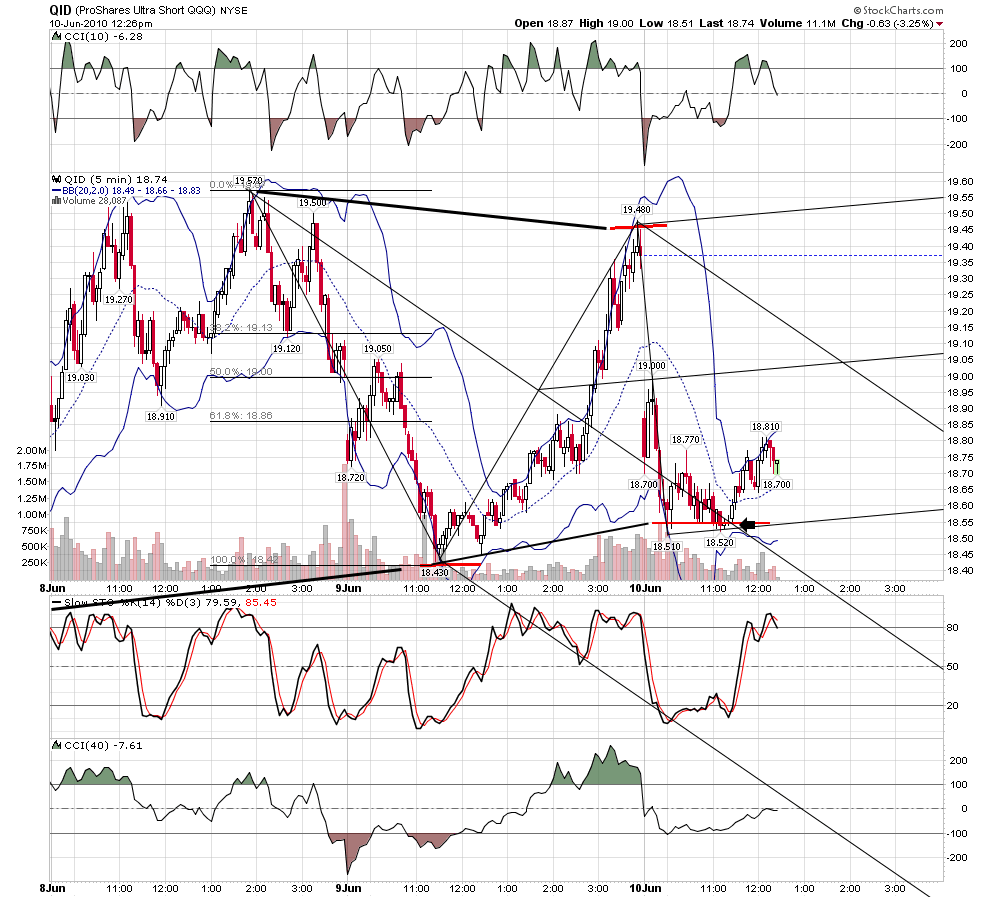
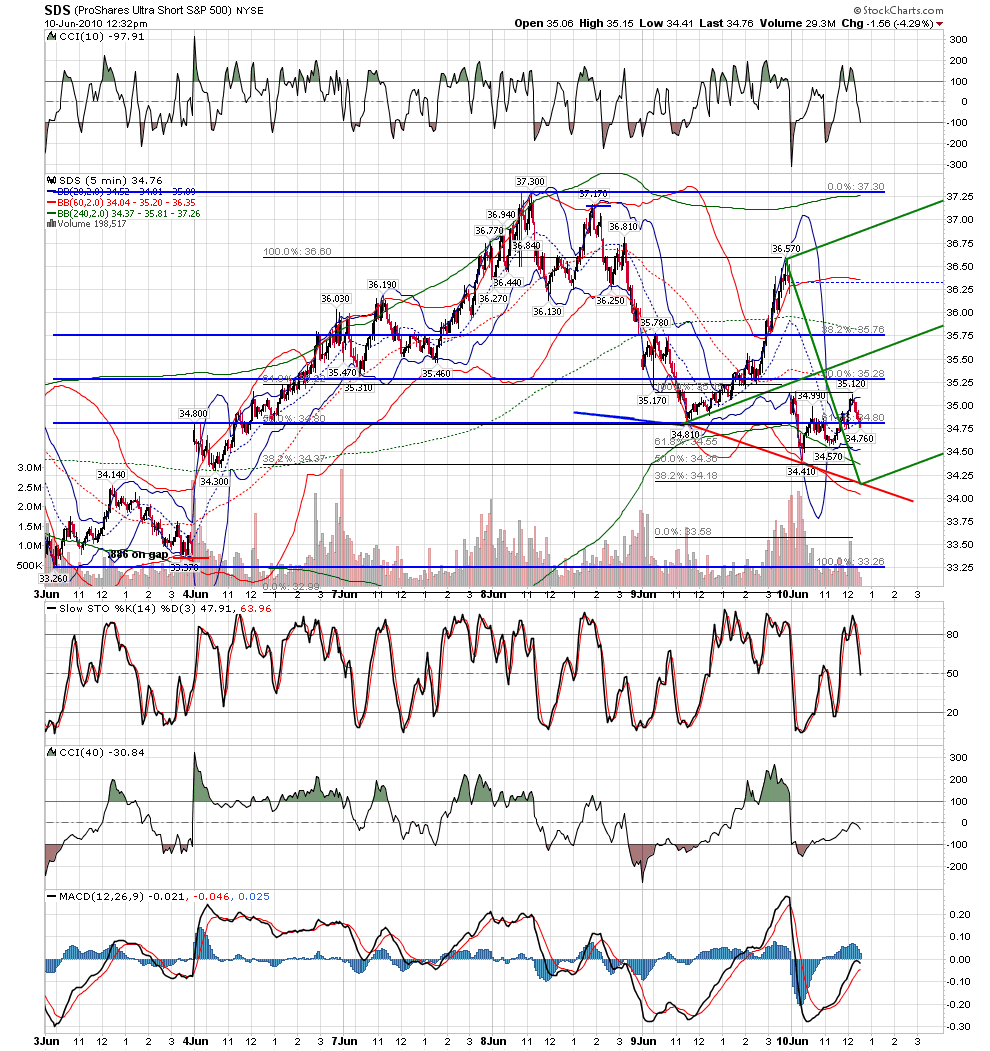
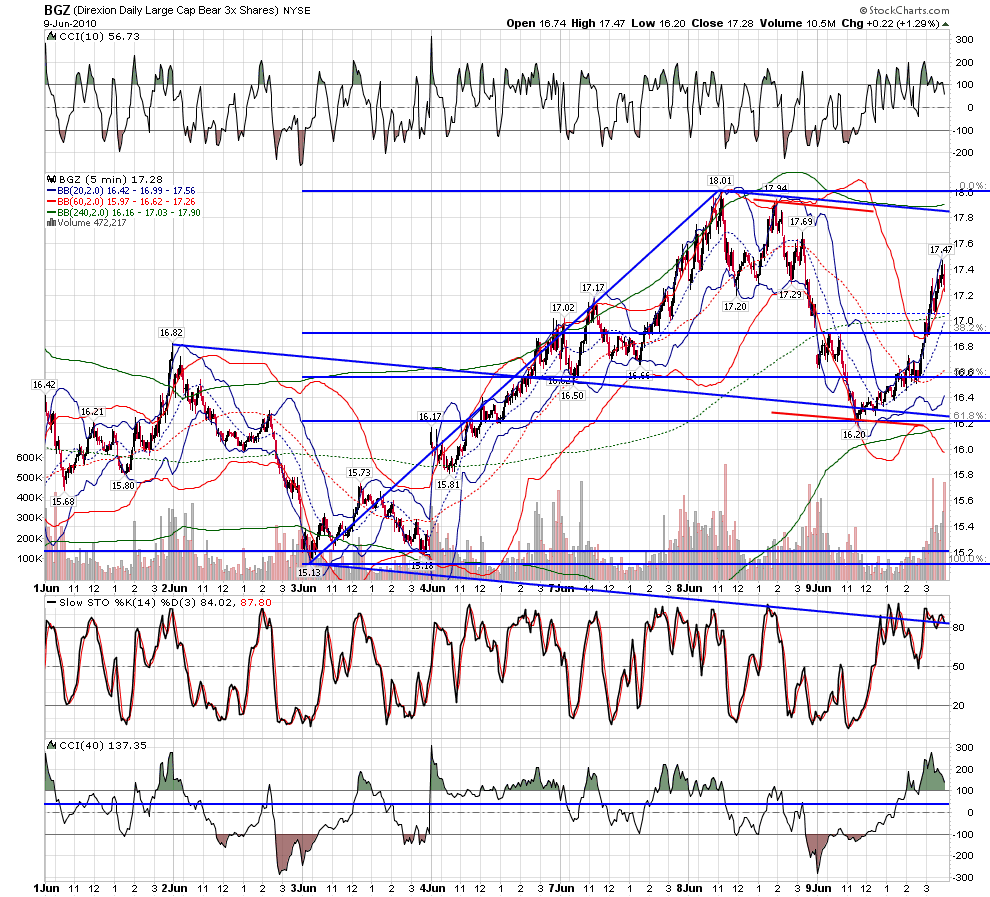
keeping the stack of charts allows a trader to see this classic geometry at today's highs...
Click image for original size

Click image for original size
RO
roofer
Rep: 3,689
Posts: 3,574
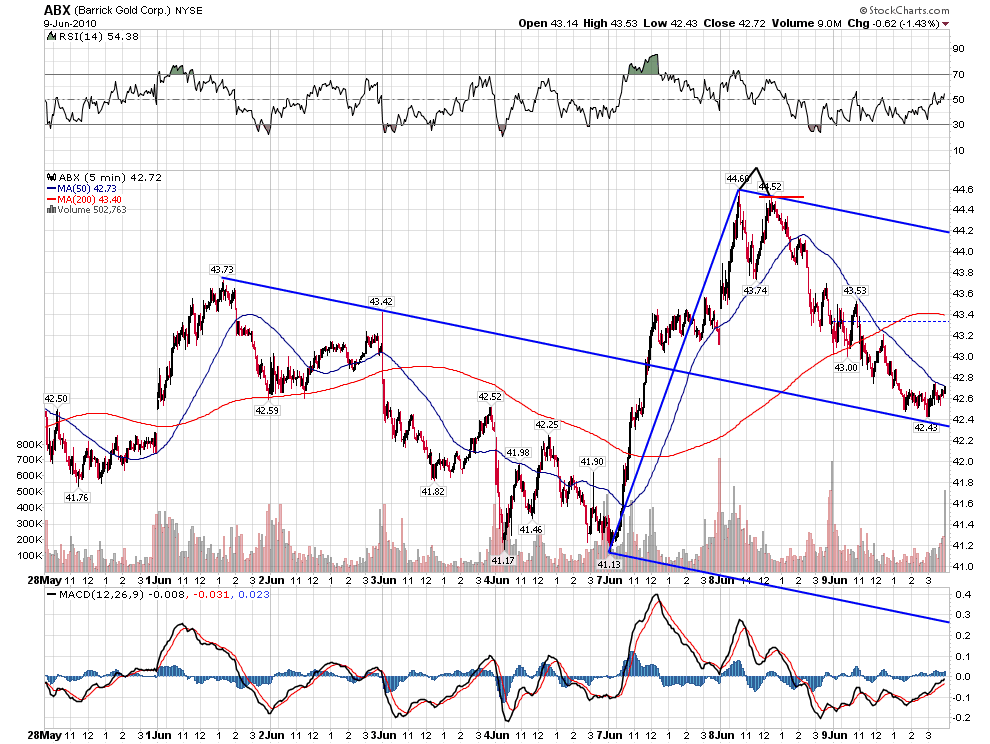
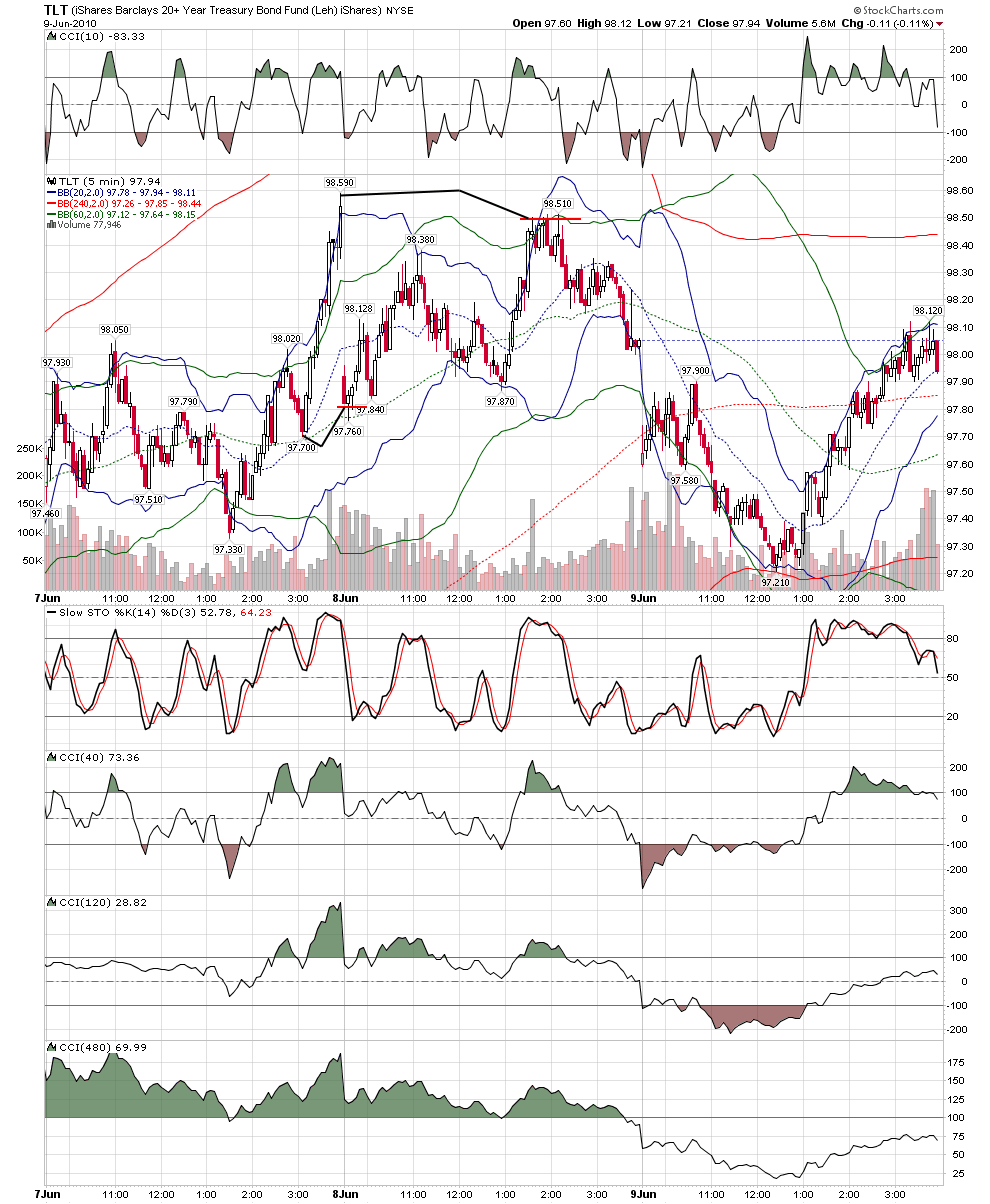
and on tuesday,when there were no gaps on indexes... you just flipped to your bond scan and your gold stock scan and kept trading......
Click image for original size

Click image for original size
RO
roofer
Rep: 3,689
Posts: 3,574
Click image for original size
RO
roofer
Rep: 3,689
Posts: 3,574
i continue to look for bigger pattern...... but with potential rocking chairs peppering my traders, i hit the geometry with 13 cent stop.... stop now be...
Click image for original size
RO
roofer
Rep: 3,689
Posts: 3,574
Click image for original size
JA
jarek
Rep: 94
Posts: 3,474
Quite a surprise today for those looking for imminent Wave 3 down...

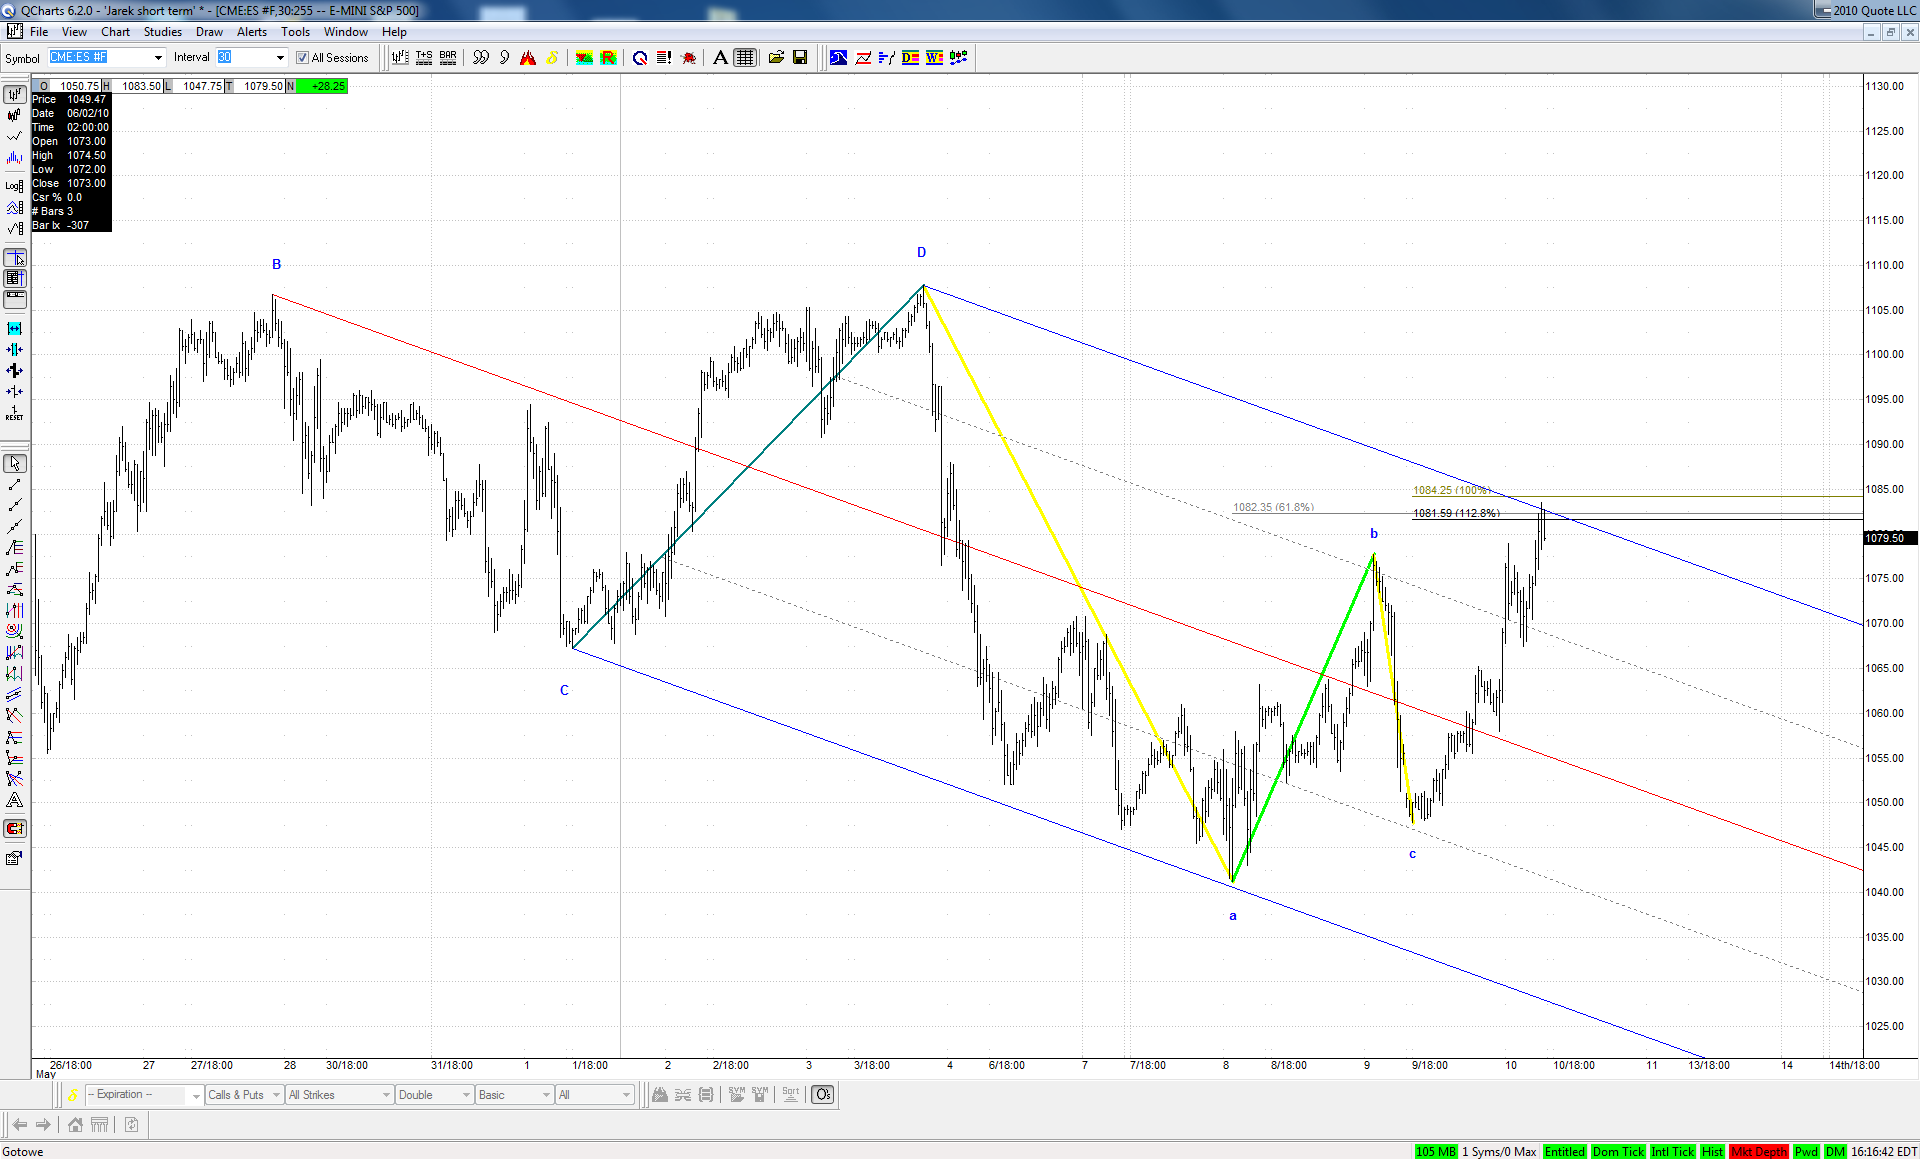
But the situation of bears might be not that hopeless if today's rise is a CD leg of a zigzag ABCD:

Click image for original size
JA
jarek
Rep: 94
Posts: 3,474
Here is an interesting update of my chart above:


Click image for original size


Time to decide - W3 up or bearish ABCD?