MyPivots
Sign In
JA
jarek
Rep: 94
Posts: 3,474
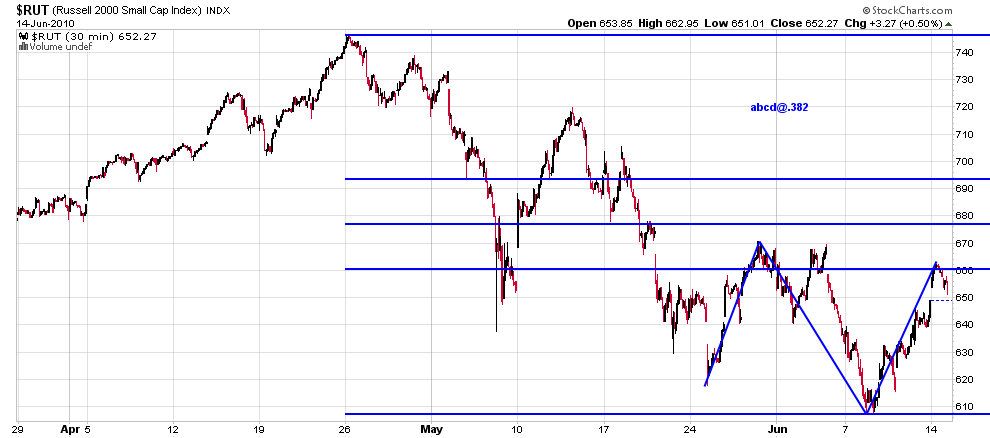
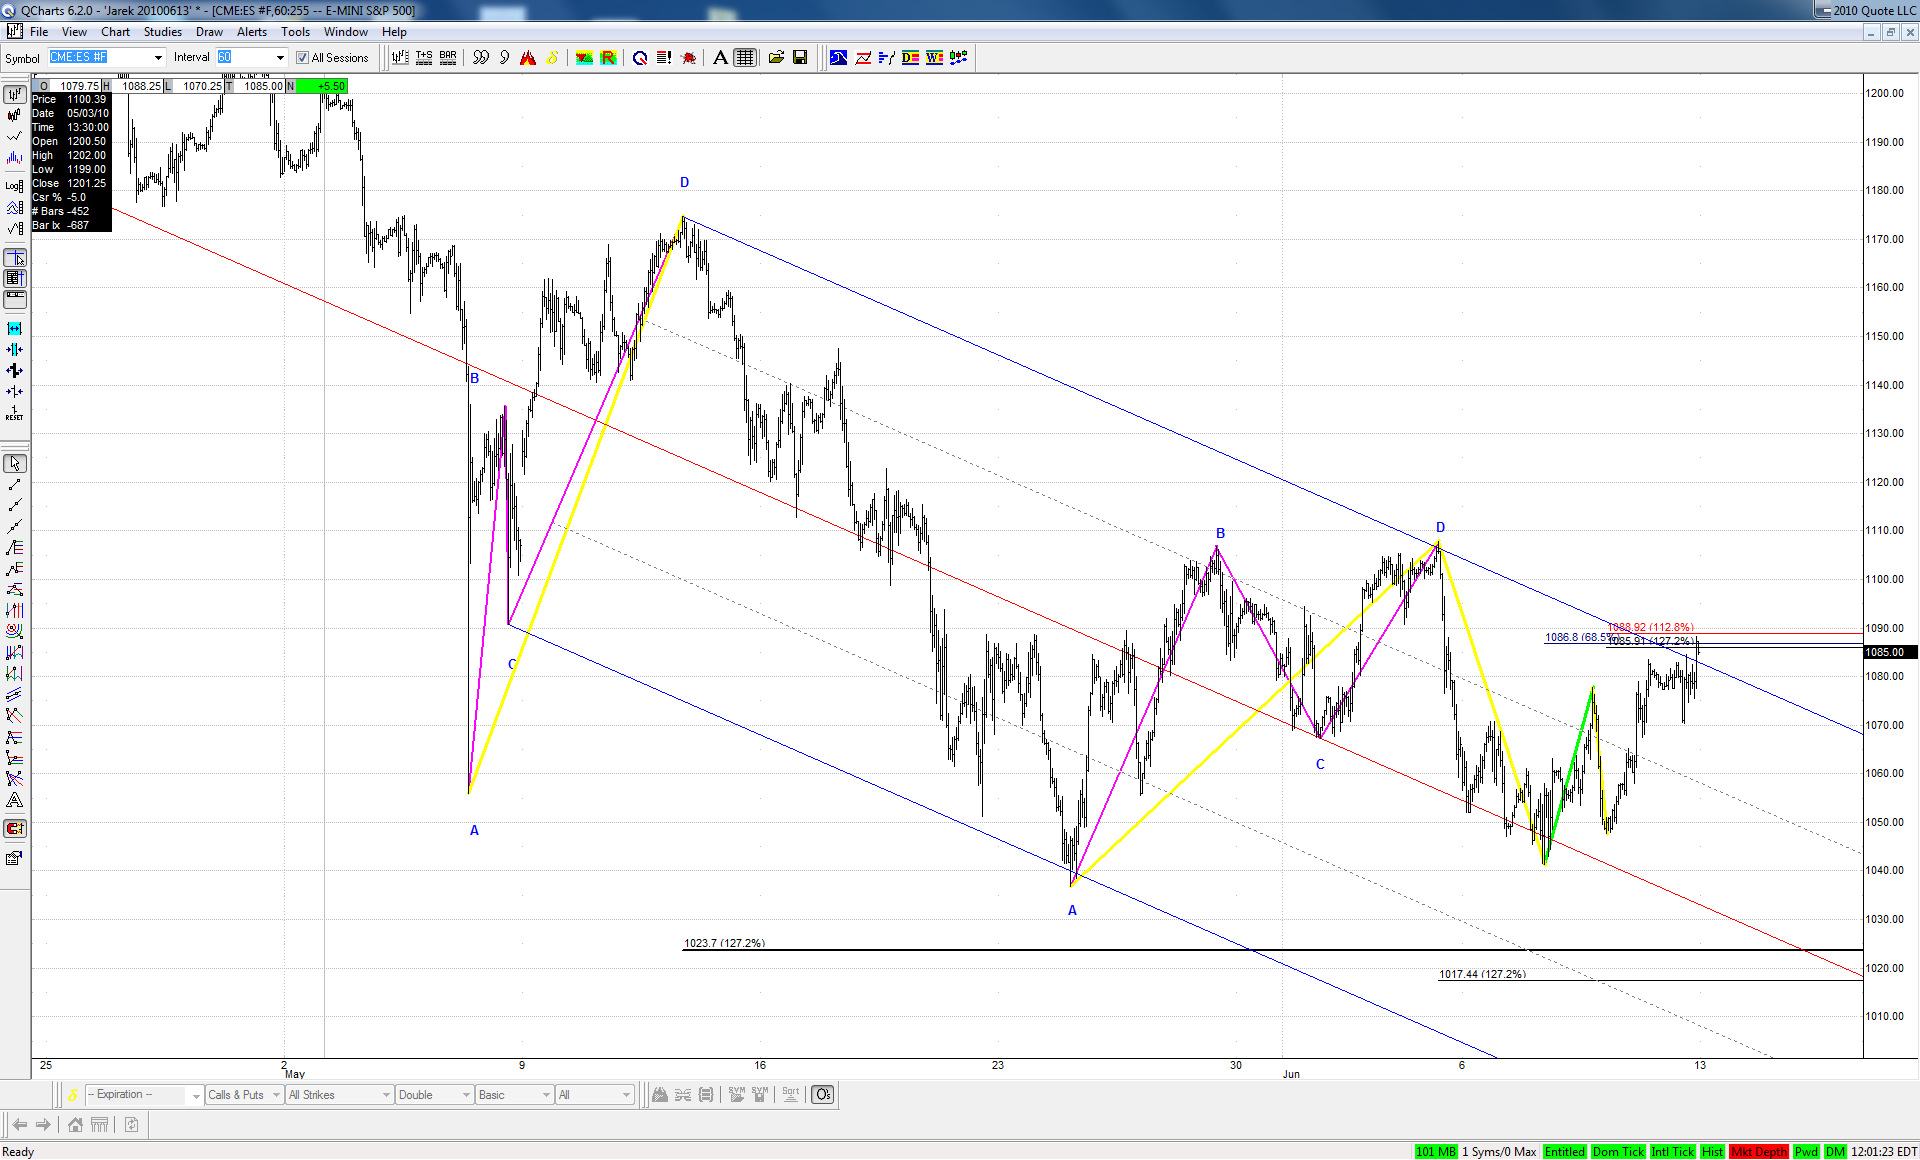
None of the 2 recent big bearish ABCDs made it to 1.272 of it and now bears may have to pay for it. Any move above Friday's high should confirm this:


Click image for original size
AL
albert
Rep: 99
Posts: 3,094
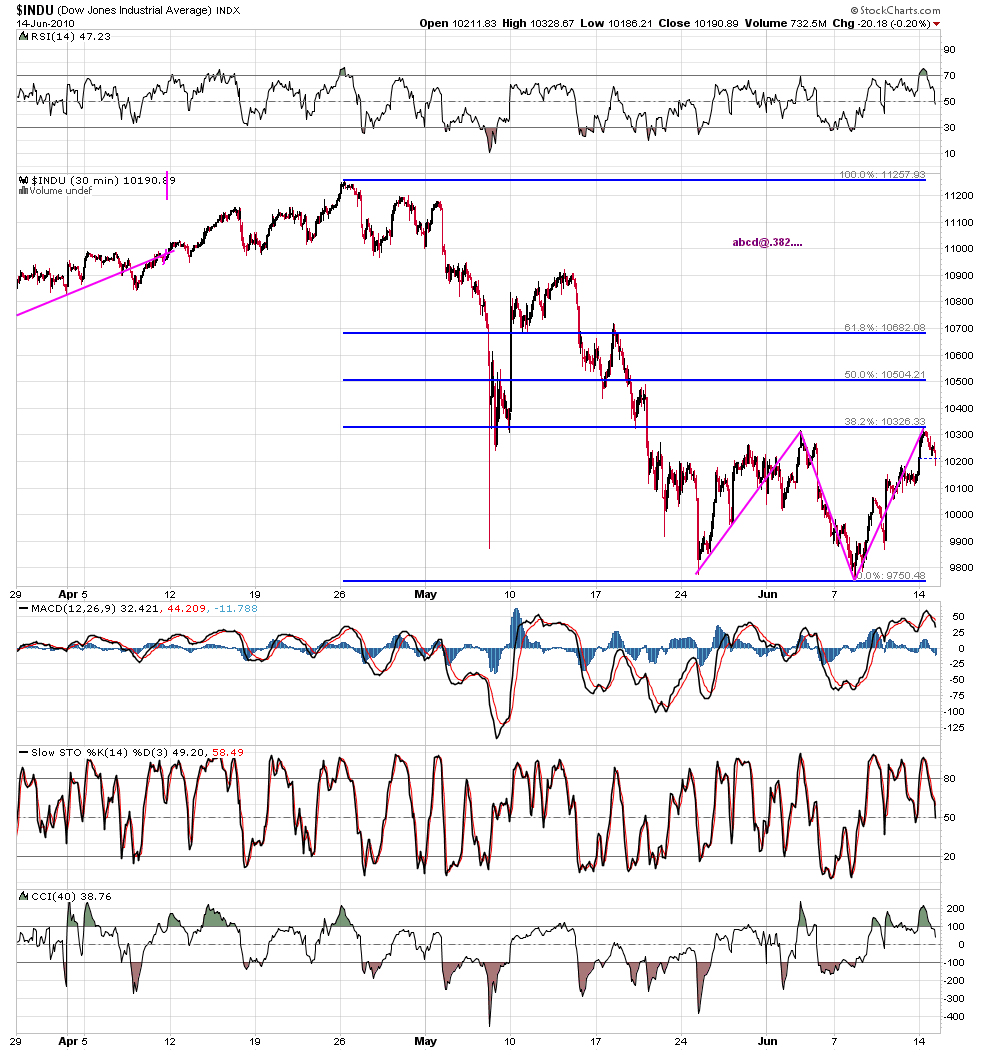
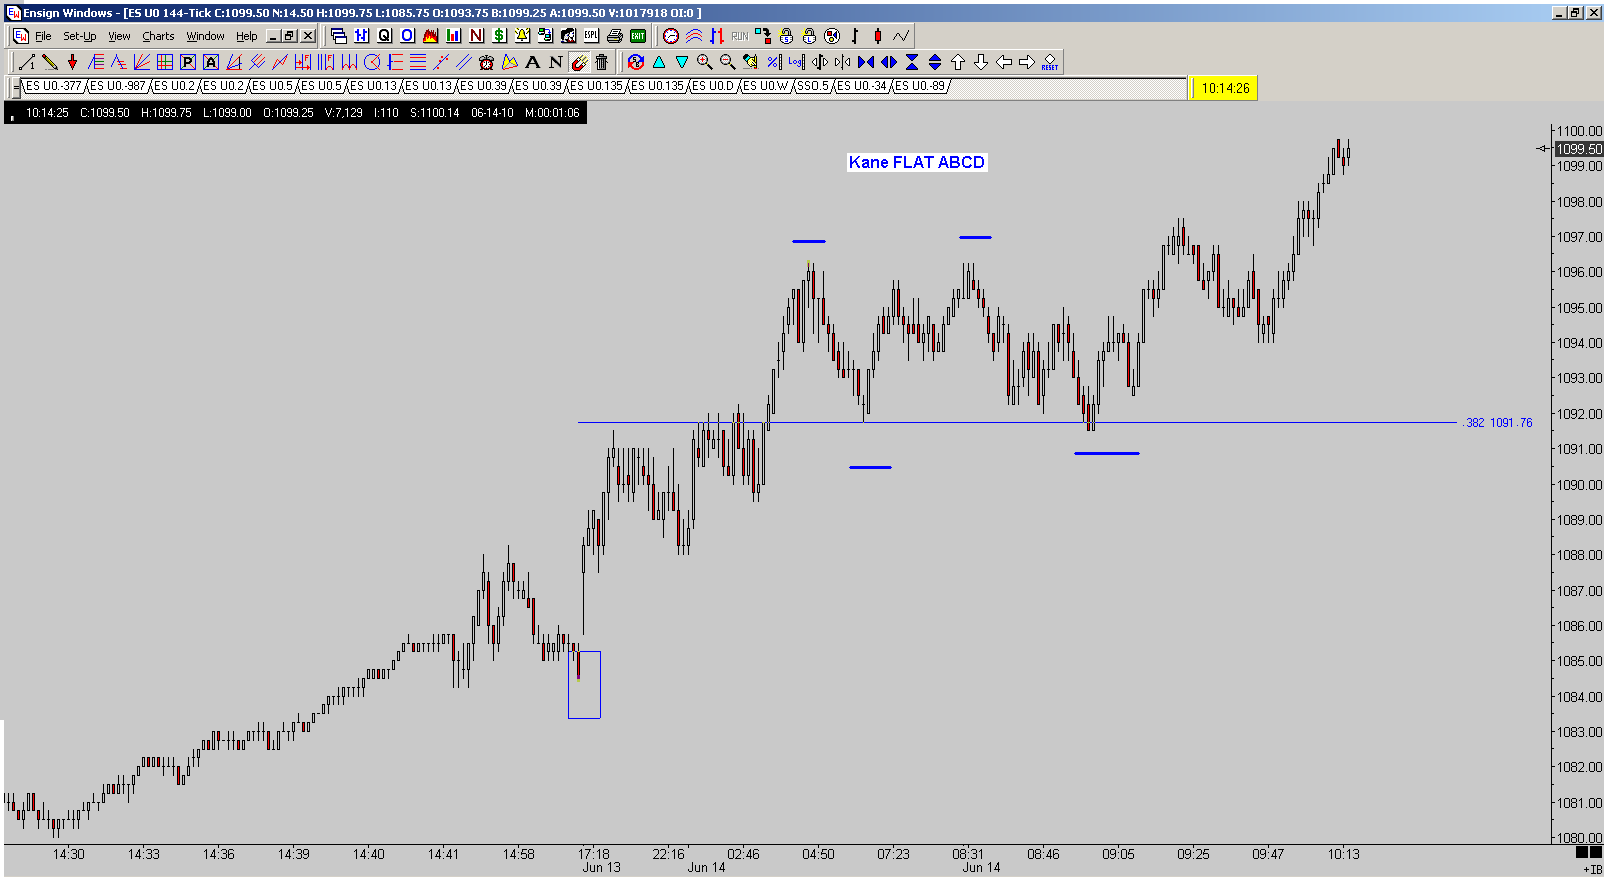
Kane FLAT ABCD completing at 0.382 Fibo Retrace of GLOBEX Lo-to-Hi.

Al Kamego
Click image for original size
JA
jarek
Rep: 94
Posts: 3,474
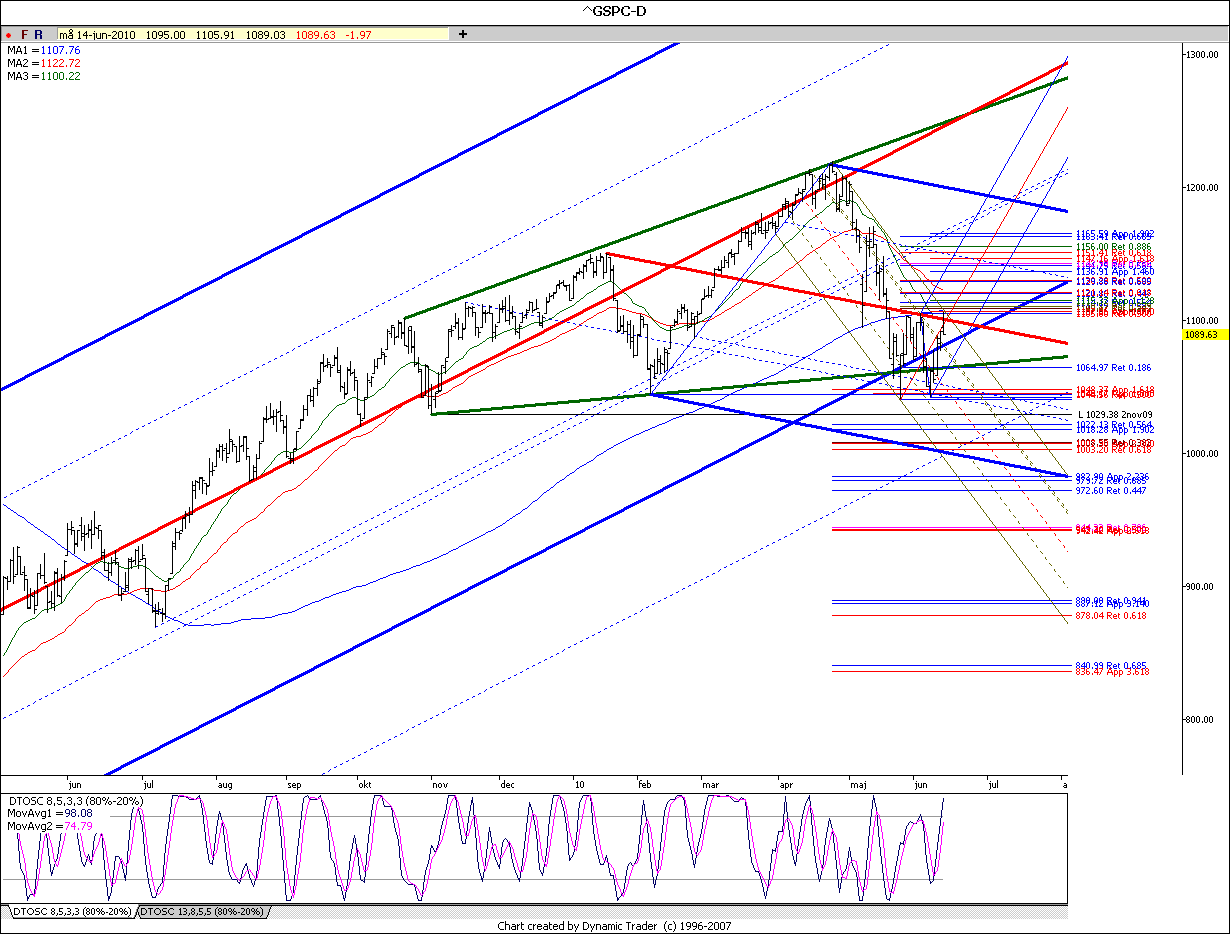
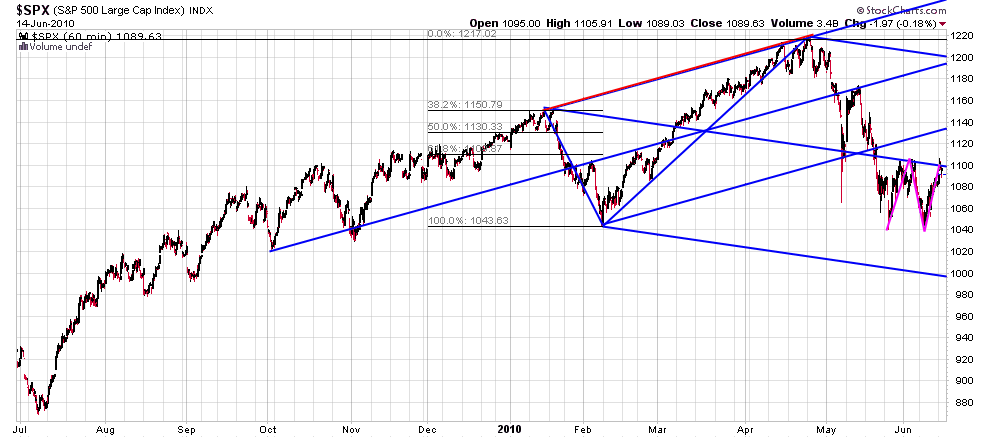
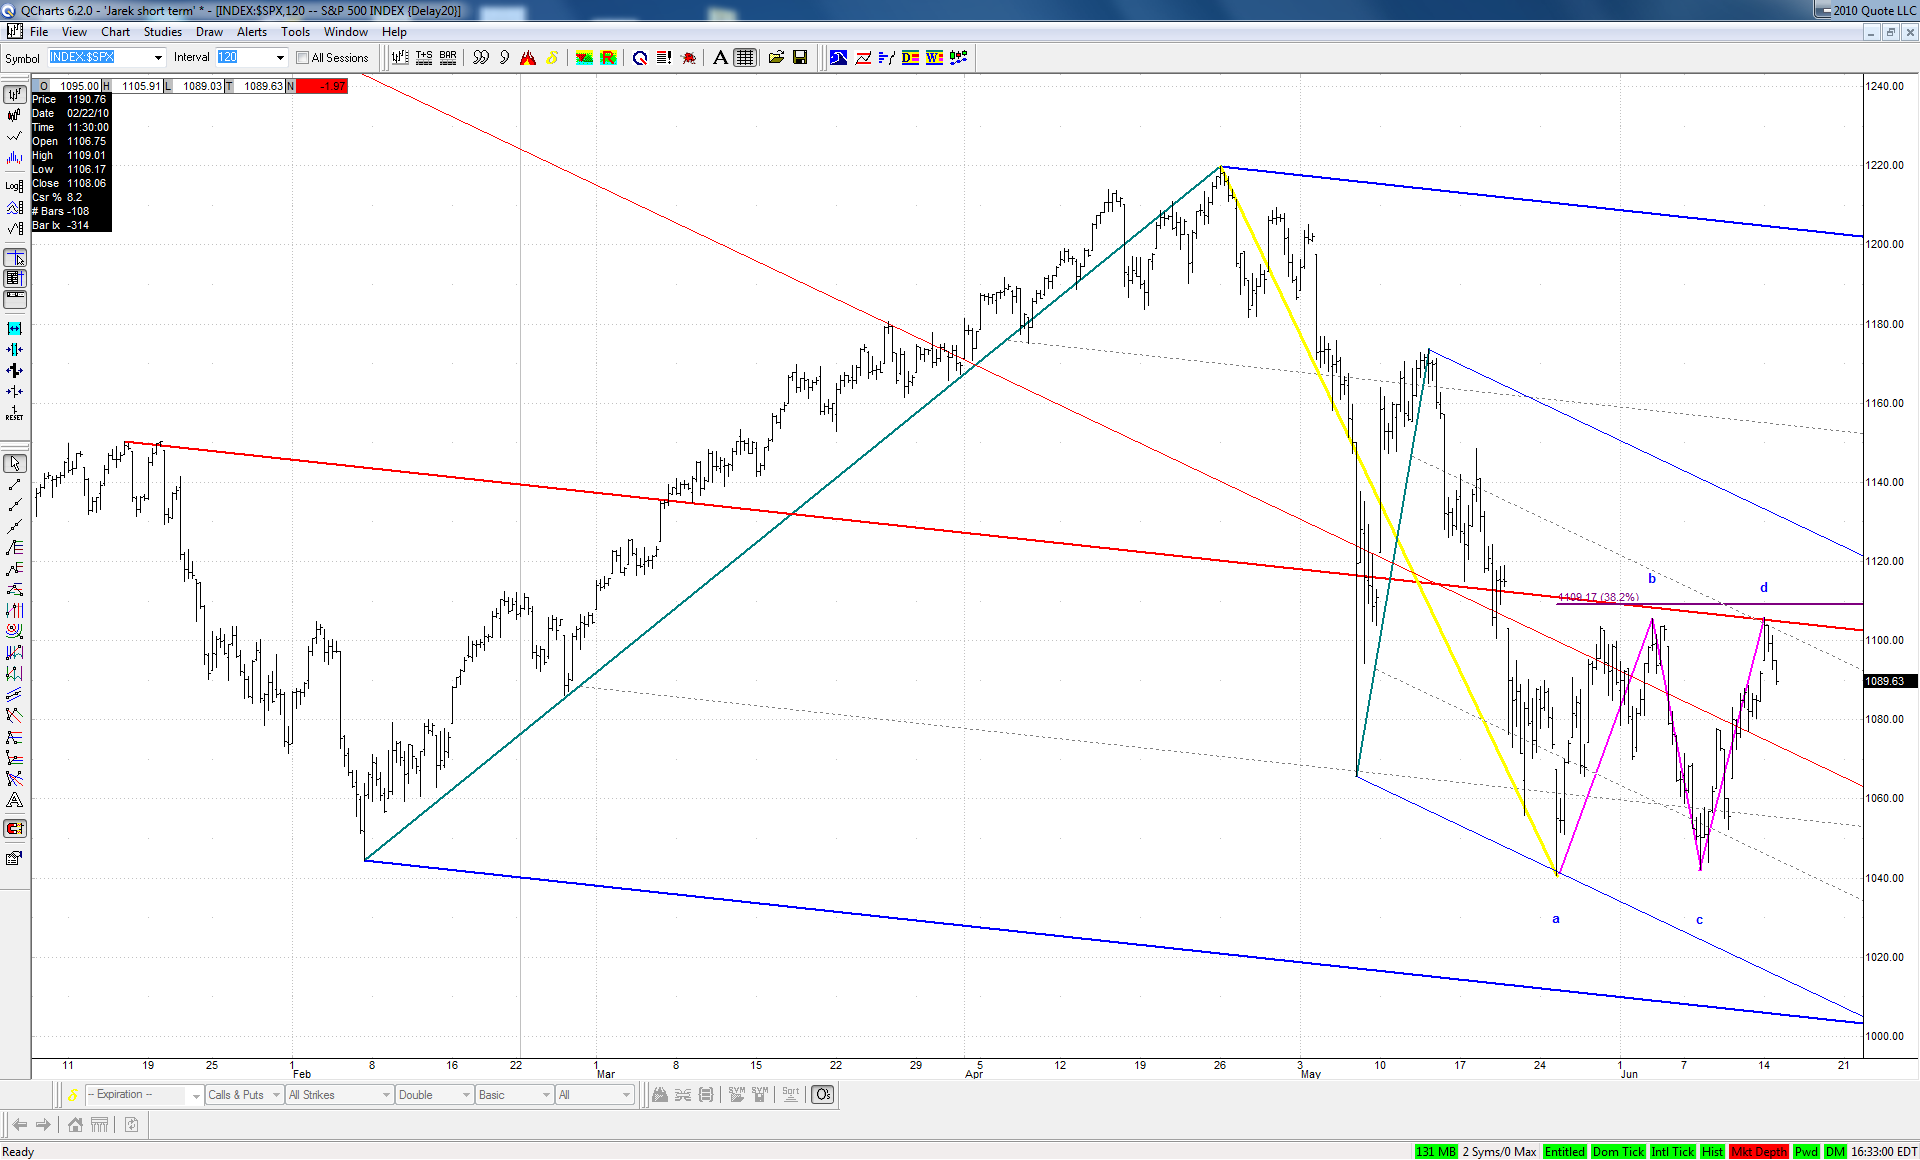
The bearish ABCD in ES was broken to the upside today which is always a bullish signal. A warning sign for the bulls however may come from the following SPX chart:


Click image for original size
MA
Mats
Rep: 100
Posts: 262
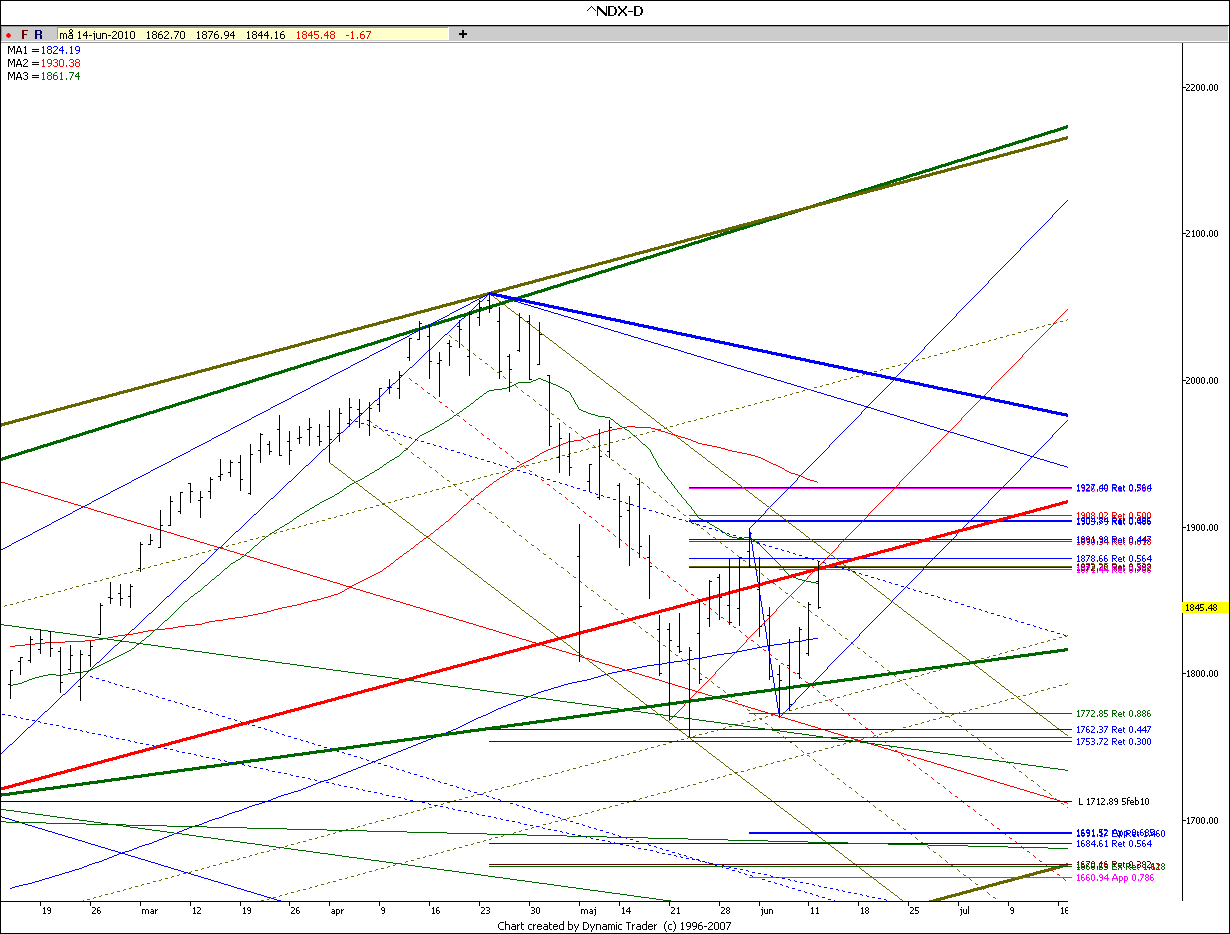
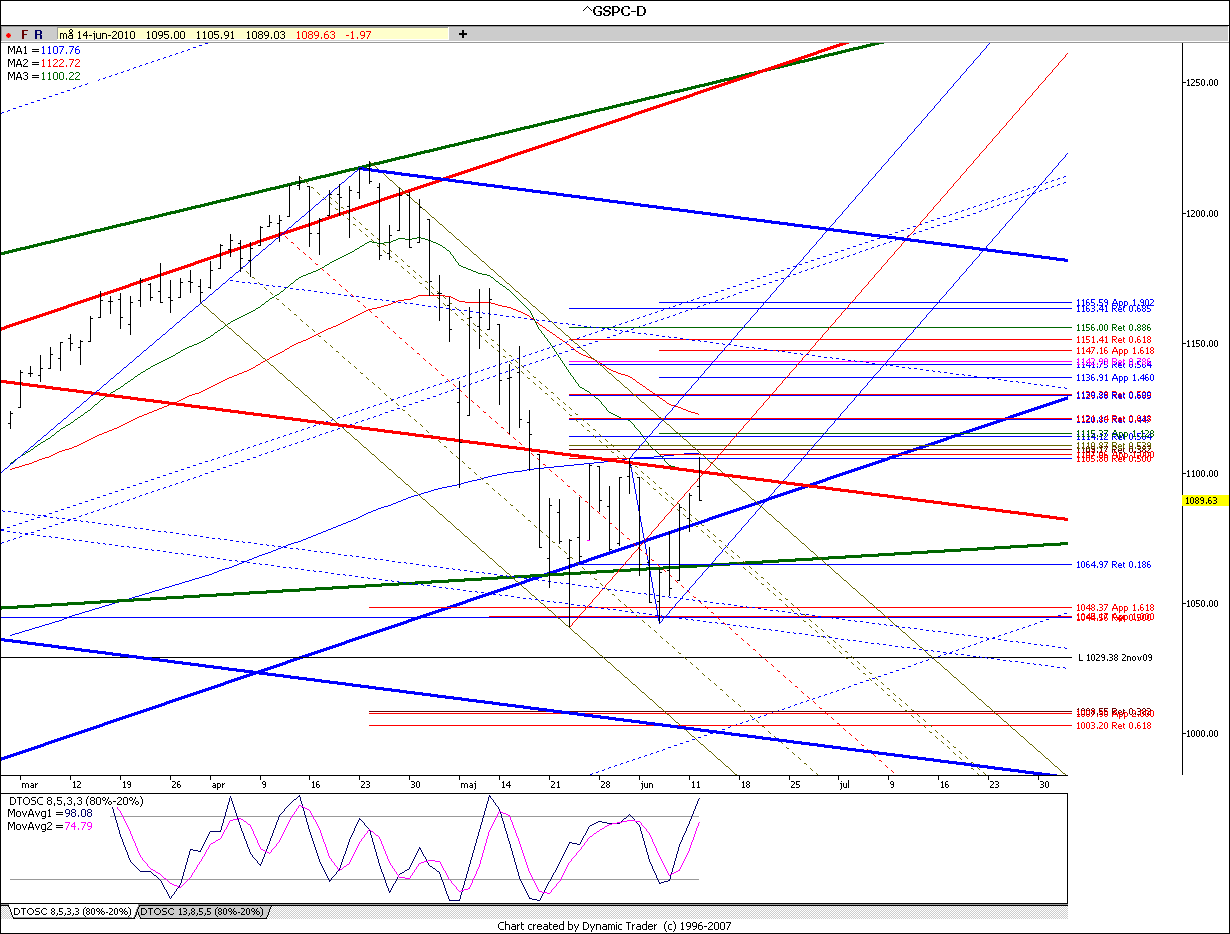
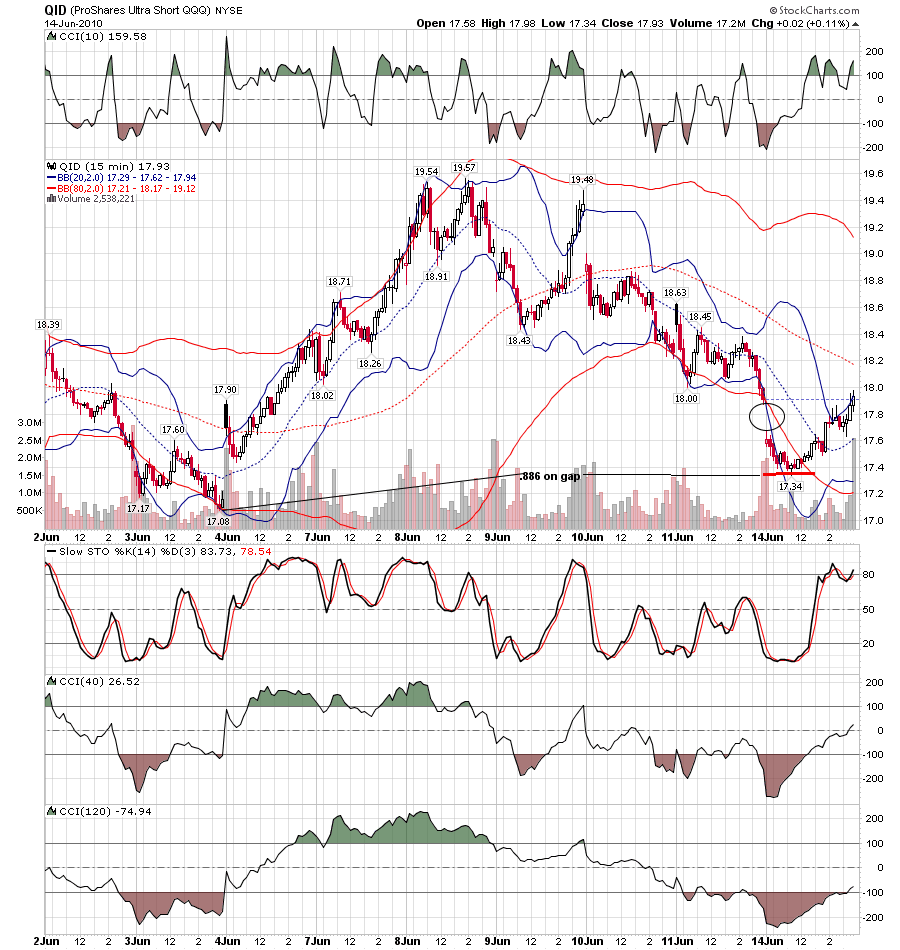
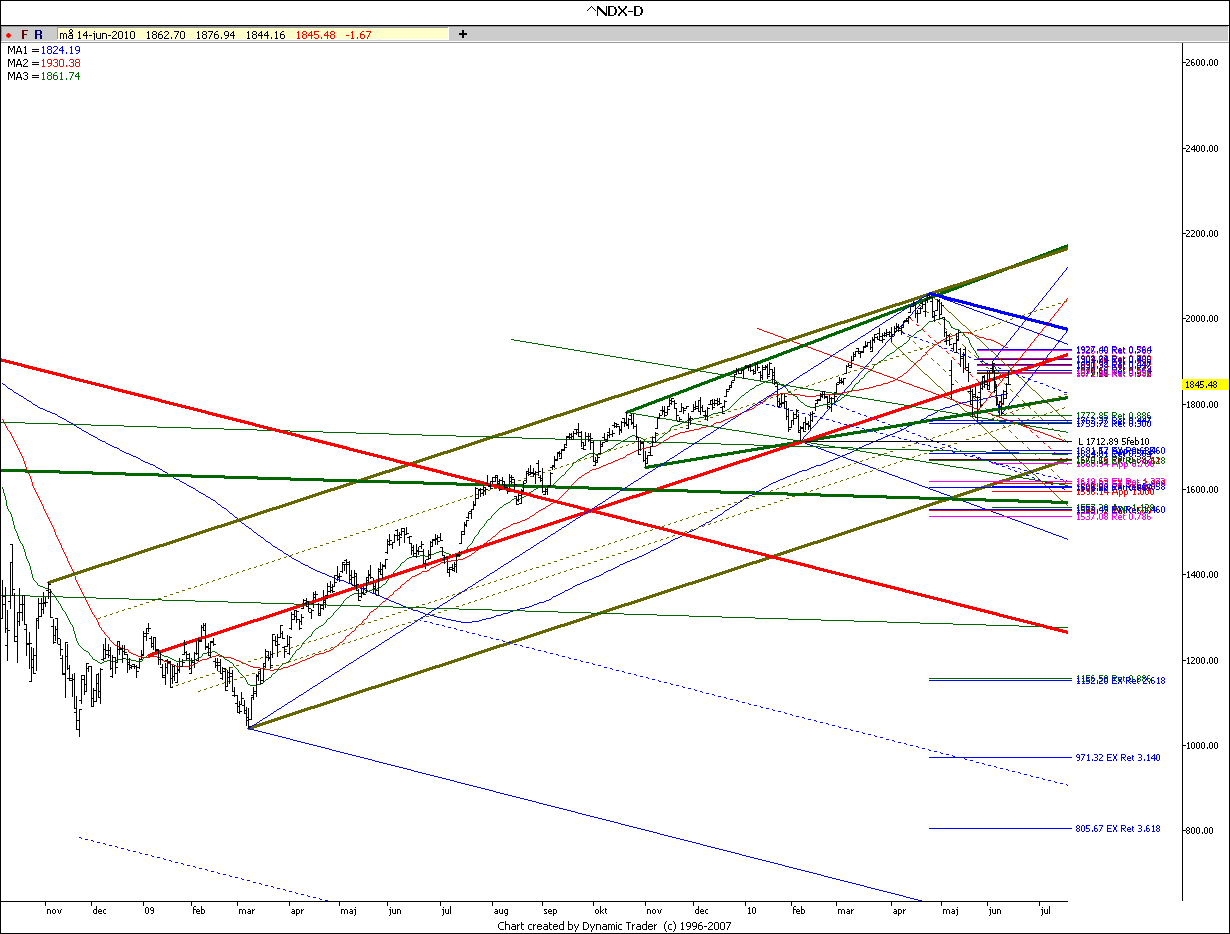
Thanks Jarek, Albert. I think there can still be a chance for bears. very bearish bars on dailybars today and they have not reached 0.447 yet.

Click image for original size

Click image for original size


Click image for original size


Click image for original size


Mats
RO
roofer
Rep: 3,689
Posts: 3,574
yep... time to decide...
Click image for original size

Click image for original size

Click image for original size
RO
roofer
Rep: 3,689
Posts: 3,574
so if the geometry was there... was there a predefined trade signal worth the risk?for me there was....
Click image for original size
RO
roofer
Rep: 3,689
Posts: 3,574
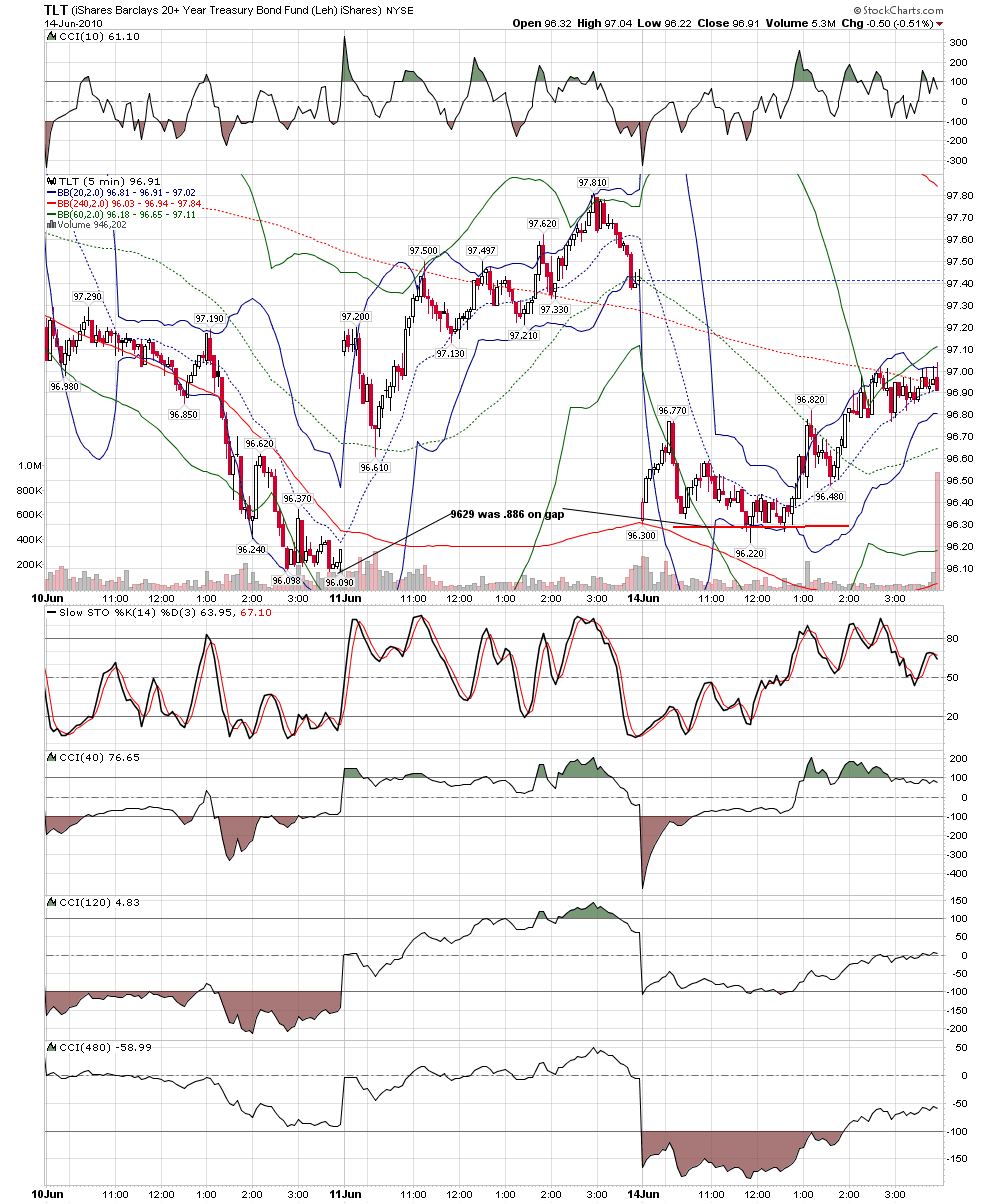
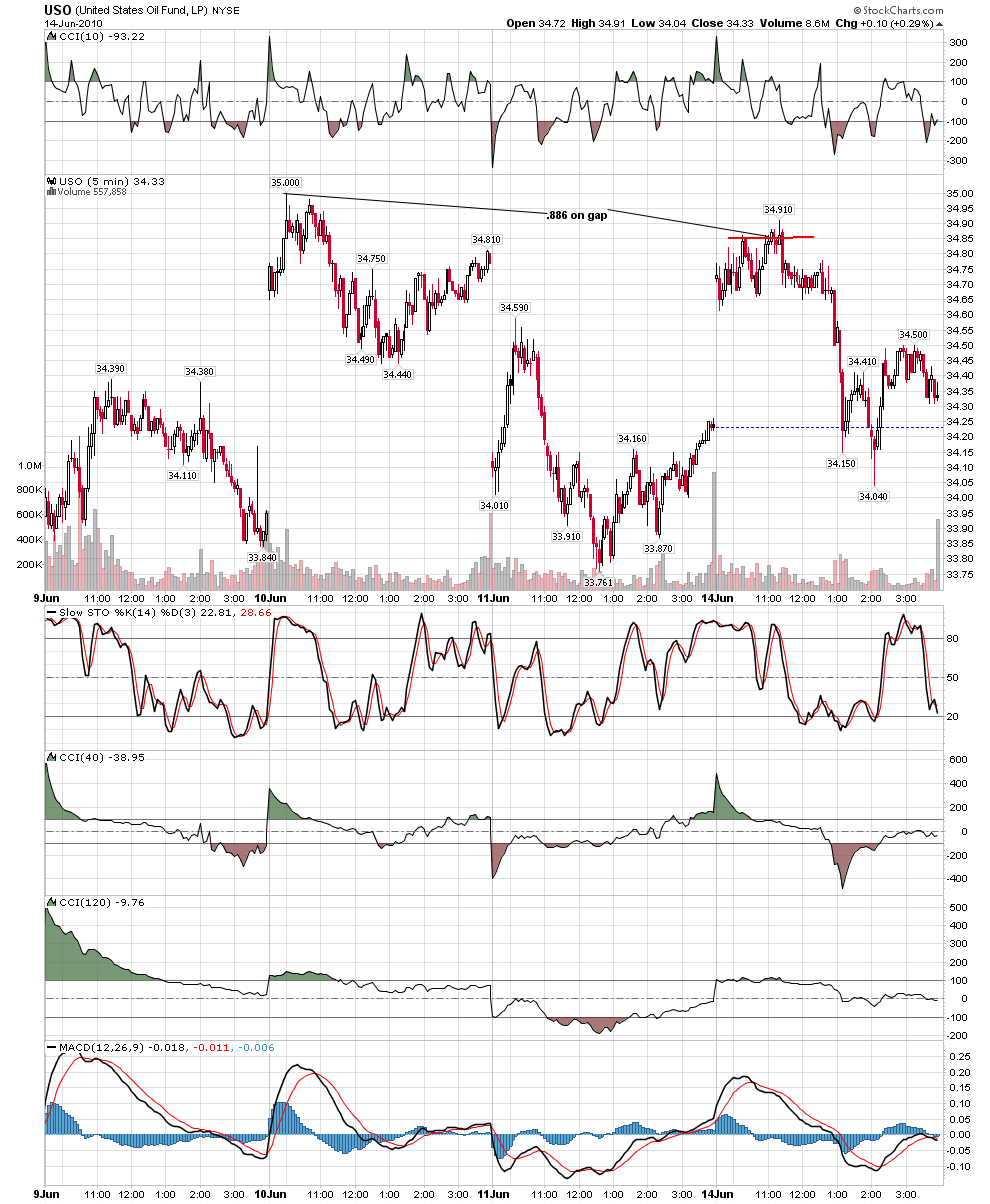
i have spoken of how important it is to me for it all to ''make sense''if the abcd's completing at .382's are to make sense, the the classic intermarket relationships should setup based on PREDEFINED TRADE SIGNALS....sell indexes, buy bonds, sell silver, sell oil...
Click image for original size

Click image for original size

Click image for original size
JI
jimkane
Rep: 3,058
Posts: 33,089
Really great posts, guys.
JI
jimkane
Rep: 3,058
Posts: 33,089
So, today's monster up day will be a decisive close above the 200 dma, after four tries. Will it be a headfake, and this pattern in here plays out to the downside? Or will it bring in huge buying interest, on no volume, of course? When I watched this thing 'test' and bounce on that low to the tick I knew they were in full manipulation mode, so I just don't see any downside. My play is always what I see not what I 'think', but it will take 'shock event' news to drive this below the key 'fake' support area, in my opinion. Another day, another series of great potential trades, just holding the nose and going with the taxpayer induced ramp. That's all one can do, I feel.
RO
roofer
Rep: 3,689
Posts: 3,574
it was a remarkable day.. by 11 i was stopped out of all my trades at be....called it a day...
JI
jimkane
Rep: 3,058
Posts: 33,089
Originally posted by jarek

The bearish ABCD in ES was broken to the upside today which is always a bullish signal. A warning sign for the bulls however may come from the following SPX chart:


Click image for original size


It is still within the range for this ABCD, and this is a very critical spot in my opinion. With the breach of the 200 dma to the upside with a strong daily close it is perfectly set up for a snap reversal headfake, especially with all the bullish news quips about how the bulls have now 'won' and the breakout will be profound. I still can't imagine anything but strong acceleration up, but I always feel that way at any setup, and I take that as a good sign. If I feel there is no way it will hold, that's what it seems to do (this is my 'normal guy' feeling, not my trained trader instinct I am talking about here). So, I will be watching this critical area very closely indeed.
JI
jimkane
Rep: 3,058
Posts: 33,089
Very weak after cash finish, one point from the RTH LOD. This gives some promise for that potential bearish ABCD, especially coming into the usually weak triple witch June OpEx week after time period. I can't wait for next week and maybe some real action. Today was a real dud. Ho-hum, yawn, zzzzzzzzzzz, I need to go outside and do some work and wake up. See ya Sunday night.