Chart to look at
Here is something to look at its my first time trying to upload a chart with text and analysis but I hope it works...
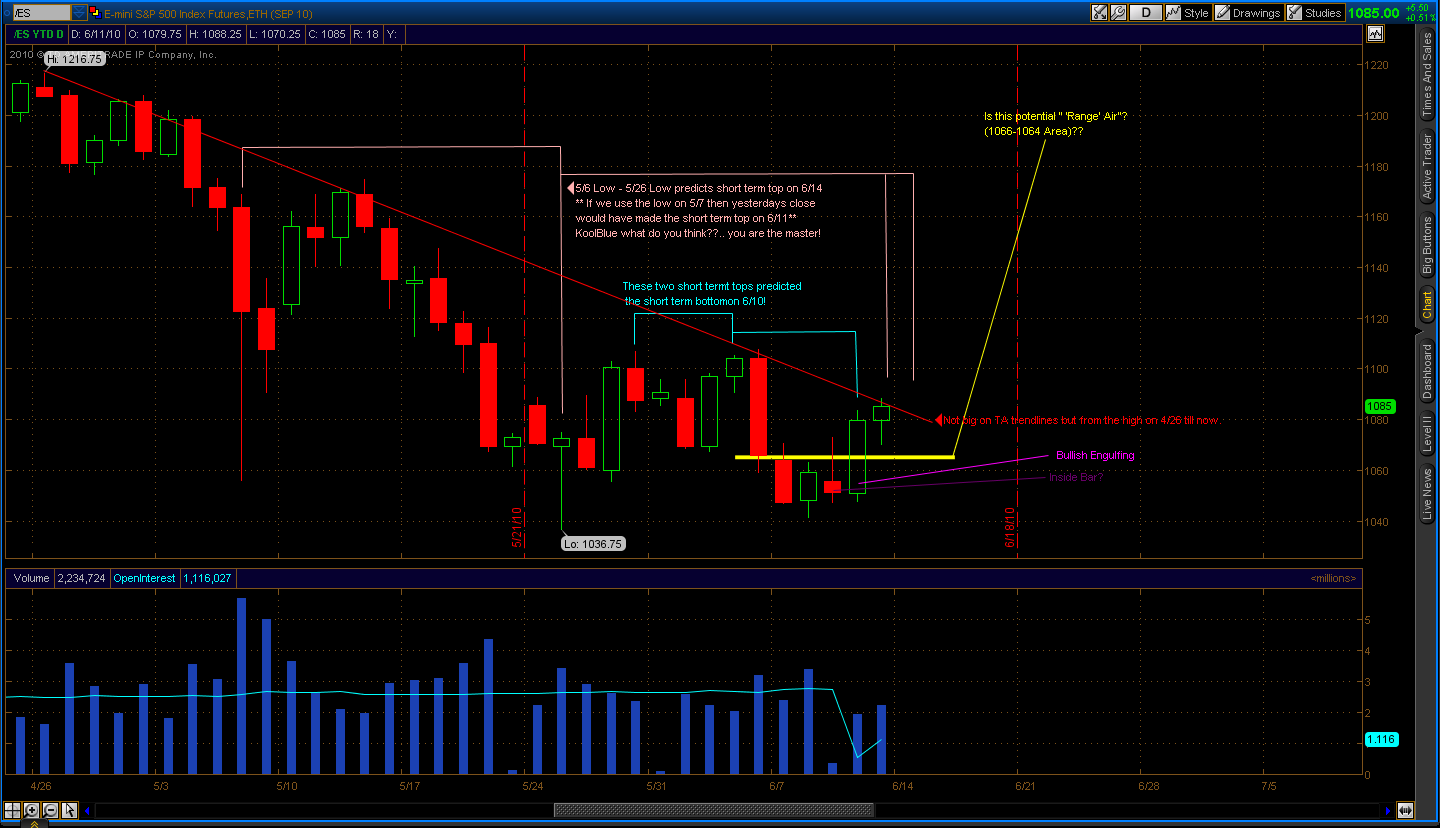
If I have used Kools cycles correctly it looks like we have come to a short term peak. Either happened on Friday or will on Monday. I am thinking Friday was the peak though as we have run into a trendline from the 4/26 high.
What is interesting to reach this short term peak was the days before it we had an inside bar, followed by a bullish engulfing bar + a Kool's cycle that predicted a short term low...
If we look at the volume, this is the first time during this downtrend from the 4/26 high, that a move up happened on increasing volume.
I have a couple questions posted on this chart:
Is that Range Air in the 1066-1064 area (Yellow)?
and
Is what I have been calling an inside bar on 6/9 correct (purple)?
Here is a possible scenario that can get played out:
We have reached a short term peak now. BBY and housing numbers brings the market down to take out the 'range air'.
From there we rally until 6/23 which, right now, predicts a short term peak; from the 5/25 - 6/8 low.
This might be convulted but I hope it makes sense and helps.
Lets discuss this chart and upcoming week.
Click image for original size
If I have used Kools cycles correctly it looks like we have come to a short term peak. Either happened on Friday or will on Monday. I am thinking Friday was the peak though as we have run into a trendline from the 4/26 high.
What is interesting to reach this short term peak was the days before it we had an inside bar, followed by a bullish engulfing bar + a Kool's cycle that predicted a short term low...
If we look at the volume, this is the first time during this downtrend from the 4/26 high, that a move up happened on increasing volume.
I have a couple questions posted on this chart:
Is that Range Air in the 1066-1064 area (Yellow)?
and
Is what I have been calling an inside bar on 6/9 correct (purple)?
Here is a possible scenario that can get played out:
We have reached a short term peak now. BBY and housing numbers brings the market down to take out the 'range air'.
From there we rally until 6/23 which, right now, predicts a short term peak; from the 5/25 - 6/8 low.
This might be convulted but I hope it makes sense and helps.
Lets discuss this chart and upcoming week.
I don't use candle but I'll try to answer some of these....an inside bar has it's entire range included in the previous days, weeks, months , years range...so if looking at a daily chart the high and low ( not just the body of your candles) is contained within the range of the previous bar.
I think that is engulfing. You seem to be use "all sessions" which doesn't show the gaps and doesn't isolate just the RTH session - 9:30 - 4:15 eastern time so that is a bit different from what I use.
I wouldn't call that range air but we haven't specifically defined that so perhaps Kool and Phileo can refine that for. The cycles are Kools so he can help with that.....I like that trendline...I hope thathelped somewhat..
Click image for original size
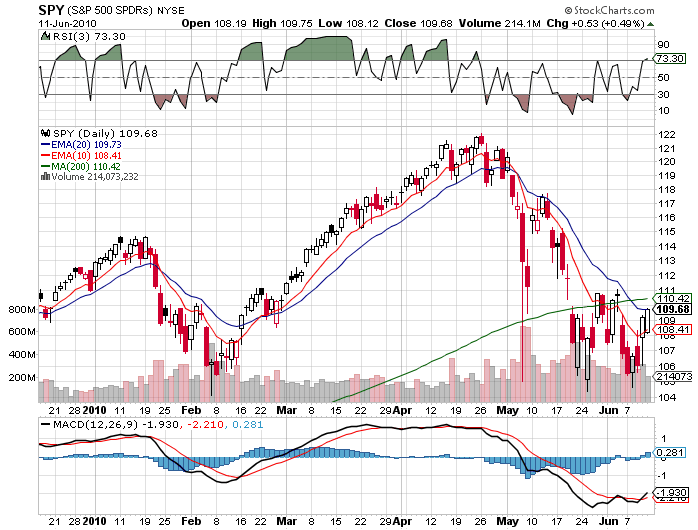
The more I look at the charts, the more I am also biased short for Monday for the following reasons:
- SPY closed just under a declining 20d EMA 109.73 (1086.75 in ES)
- 200d SMA is at 110.4 (1094 in SPY)
- RSI(3) is overbought
- already had 2 consecutive up days.
- mutual fund monday win rate since the start of this correction (Apr 26/10) is 25%
An opening gap on Monday above 1093 (that's 50% of Friday's Range and 33% of 5d ATR) or Euro above 1.2230 to open NY Session would negate my short bias. Furthermore, since Friday was an NR6 day, staying above 1088 for any length of time sets up for a bullish breakout above 1094. First touch of 1075 should be tradeable for a 2pt bounce, but if any subsequent tests of that level fails to hold, that could trigger profit taking down to 1068-1065. I think 1081 will be a good target for any mean reversion trade.
Click image for original size
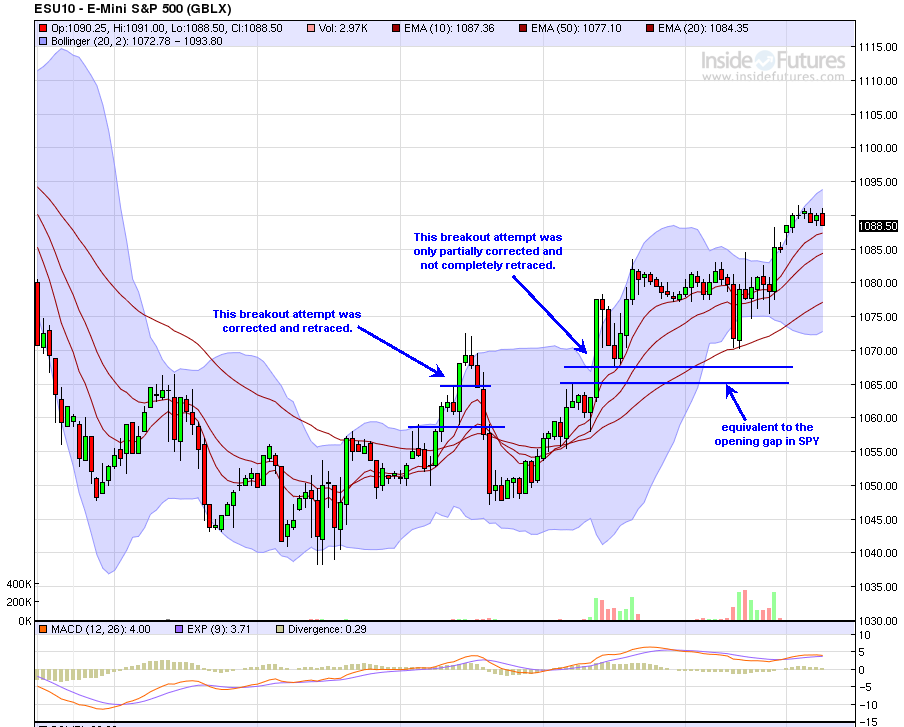
I see a gap between 1065 and 1068.
It's similar to Bruce's definition of an "air"
http://www.mypivots.com/Board/Topic/5507/1/price-bar-overlap
probably the biggest difference is that the "air" gap I've highlighted occured outside of RTH.
Any thoughts Bruce?
Emini Day Trading /
Daily Notes /
Forecast /
Economic Events /
Search /
Terms and Conditions /
Disclaimer /
Books /
Online Books /
Site Map /
Contact /
Privacy Policy /
Links /
About /
Day Trading Forum /
Investment Calculators /
Pivot Point Calculator /
Market Profile Generator /
Fibonacci Calculator /
Mailing List /
Advertise Here /
Articles /
Financial Terms /
Brokers /
Software /
Holidays /
Stock Split Calendar /
Mortgage Calculator /
Donate
Copyright © 2004-2023, MyPivots. All rights reserved.
Copyright © 2004-2023, MyPivots. All rights reserved.