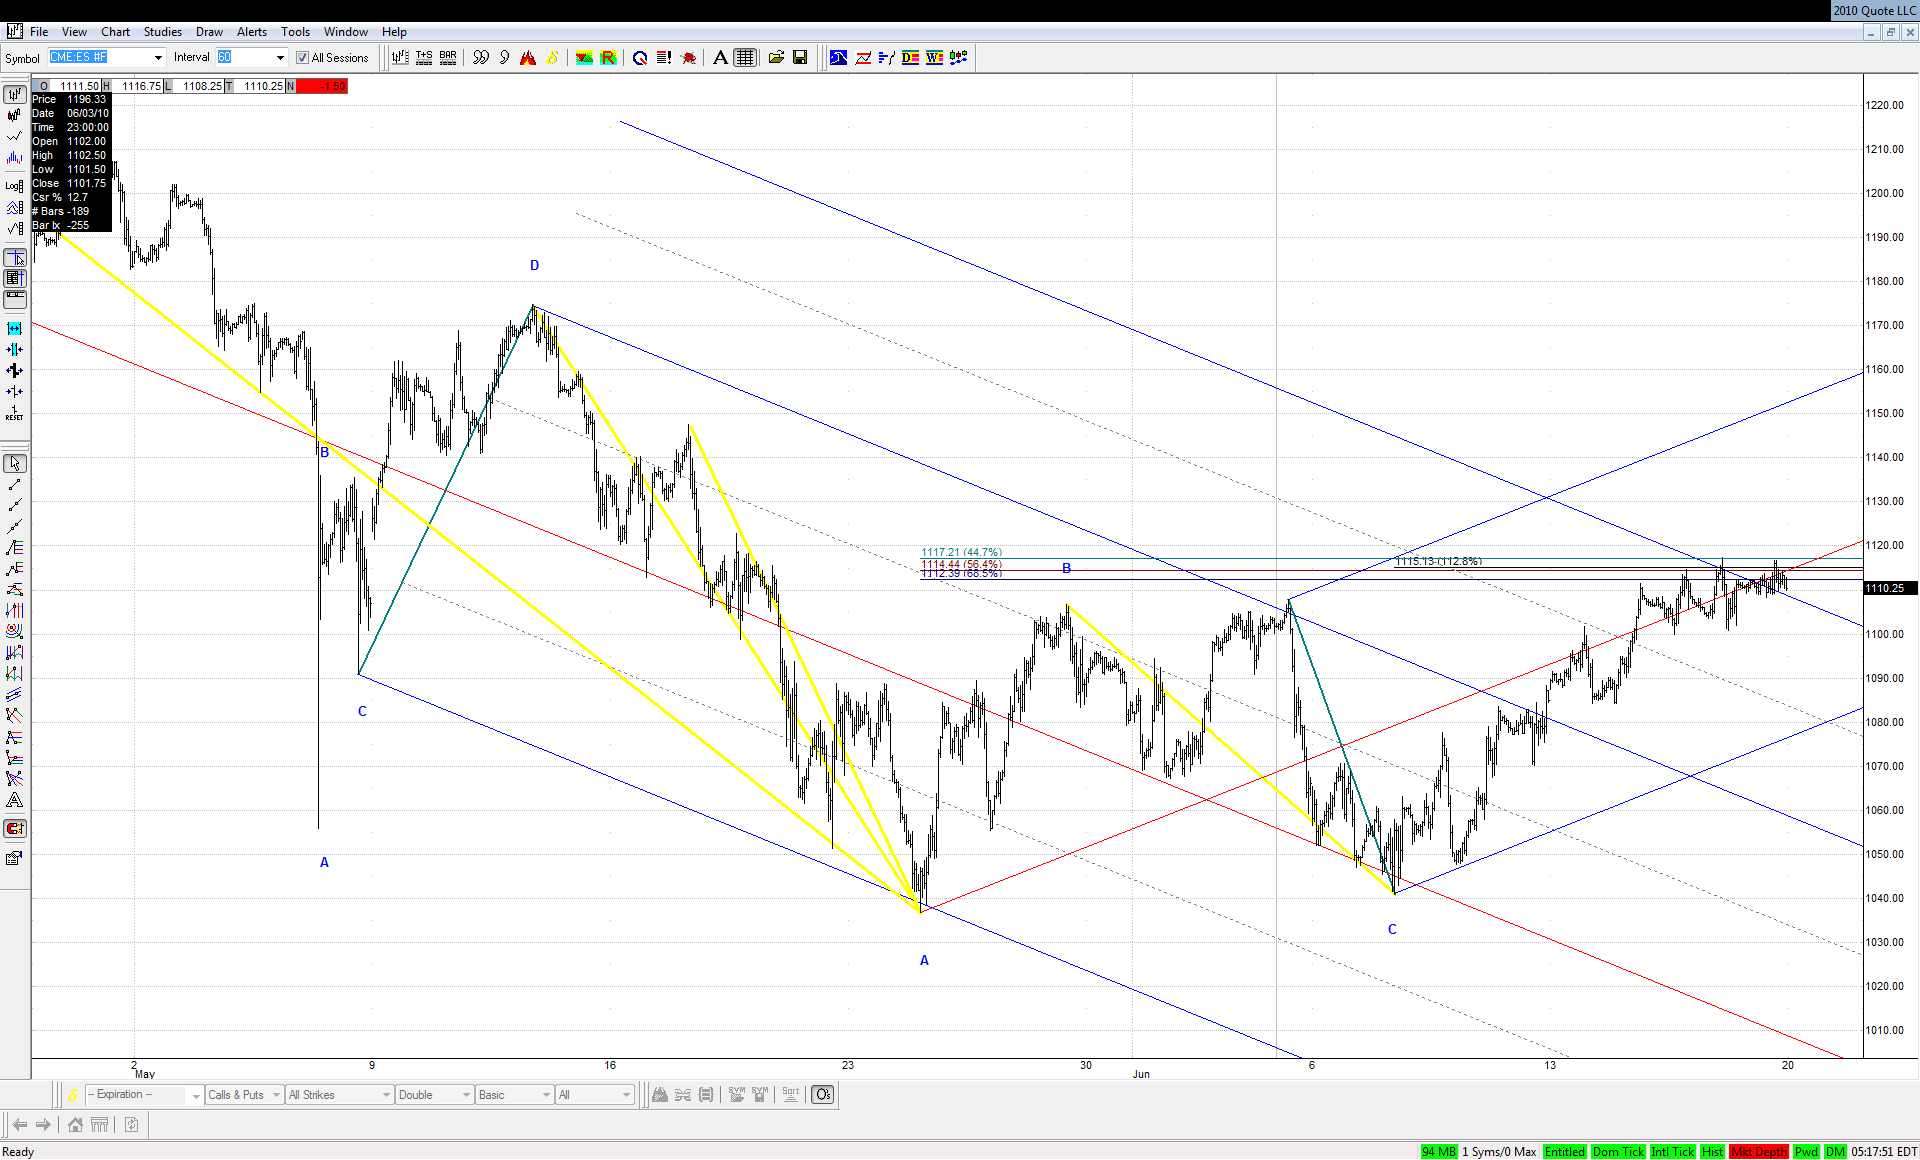
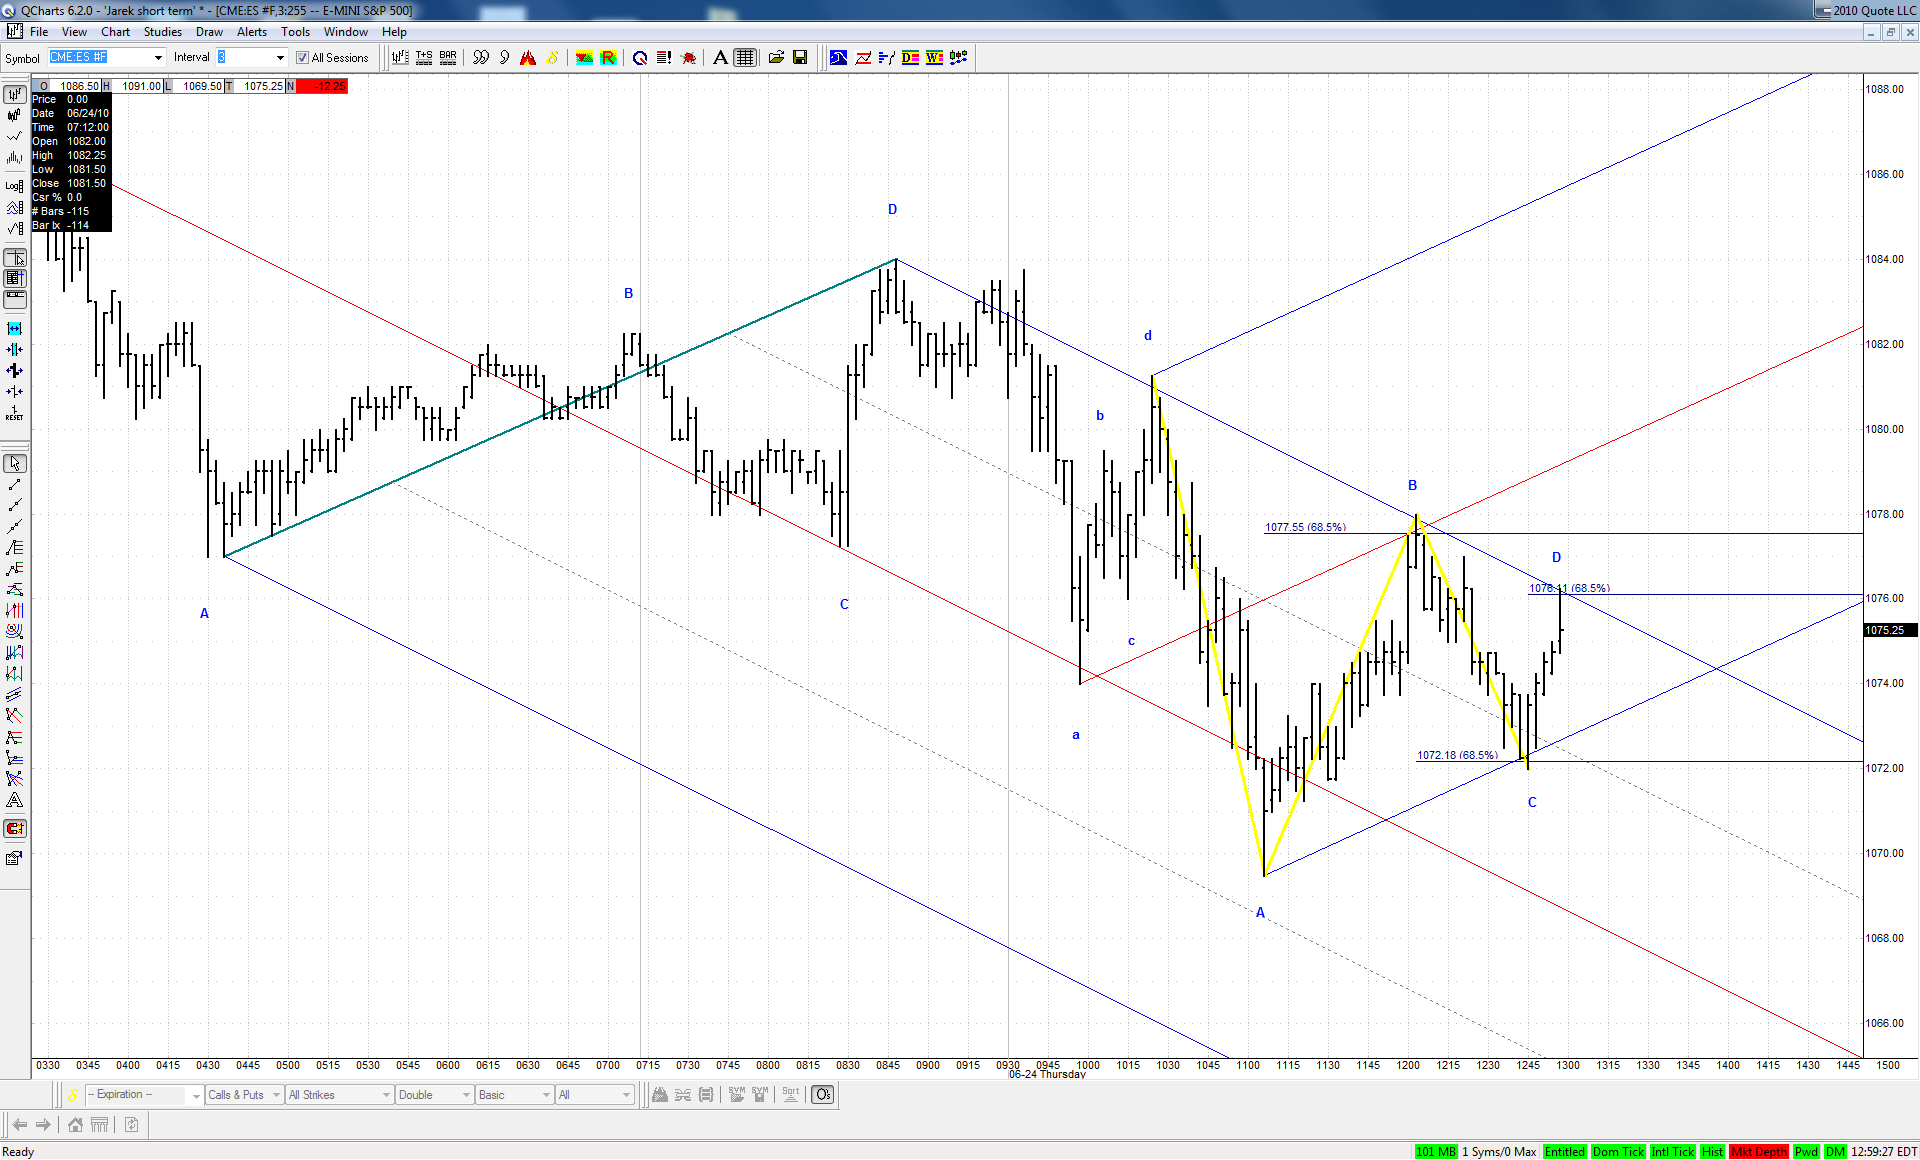
Here is this potential bearish ABCD looming over the market for some time already:
Unfortunately it can go much higher and still remain a Double Bottom ABCD, so the picture is rather unclear at the moment.
JI
jimkane
Rep: 3,058
Posts: 33,089
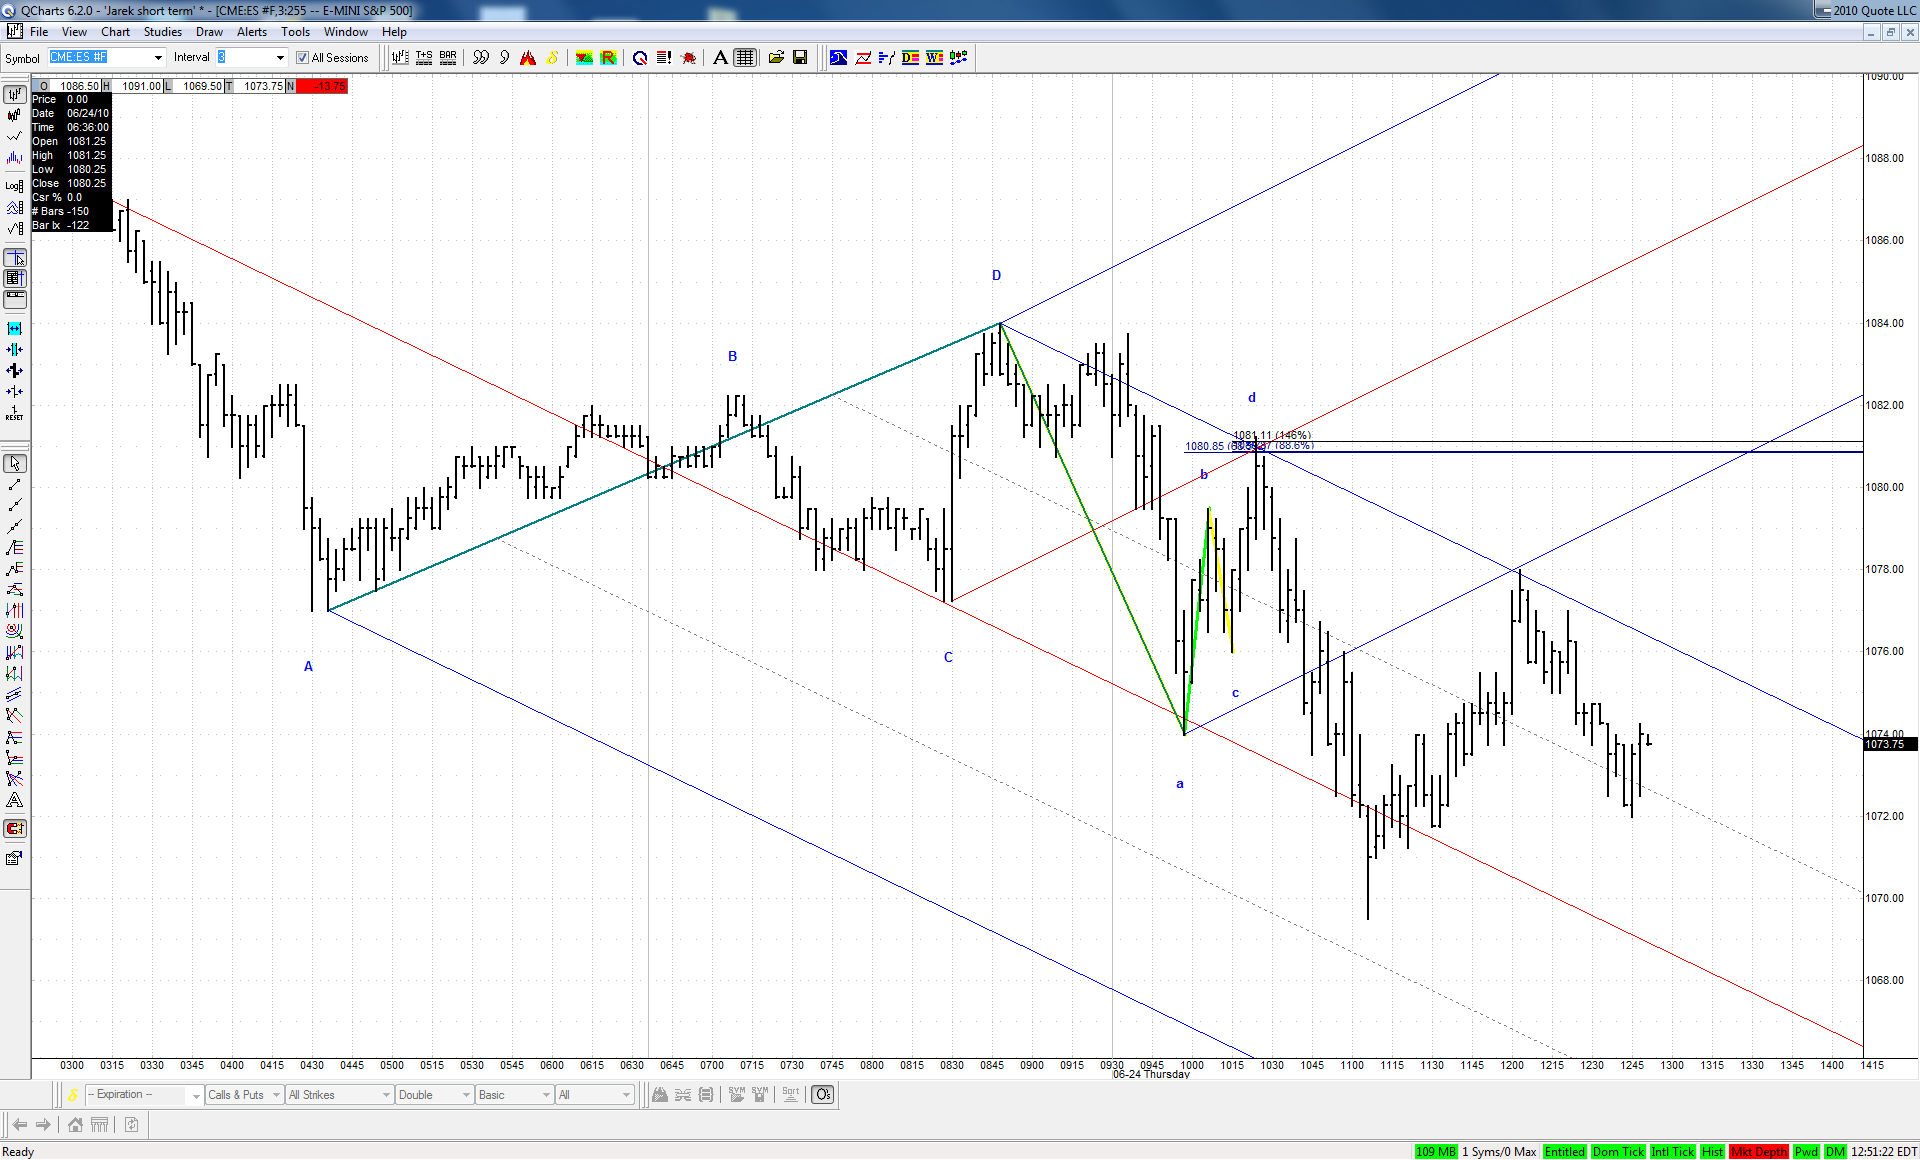
So, where in here (intraday) will the bulls try to make a stand? Was that it there at 72? Or will the bears grind it down all day? Are you looking at the higher timeframe setups? I can't trade the 3-min ES unless I know where the weekly, daily, 60-min, and 13-min charts are, what they are telling me.
JI
jimkane
Rep: 3,058
Posts: 33,089
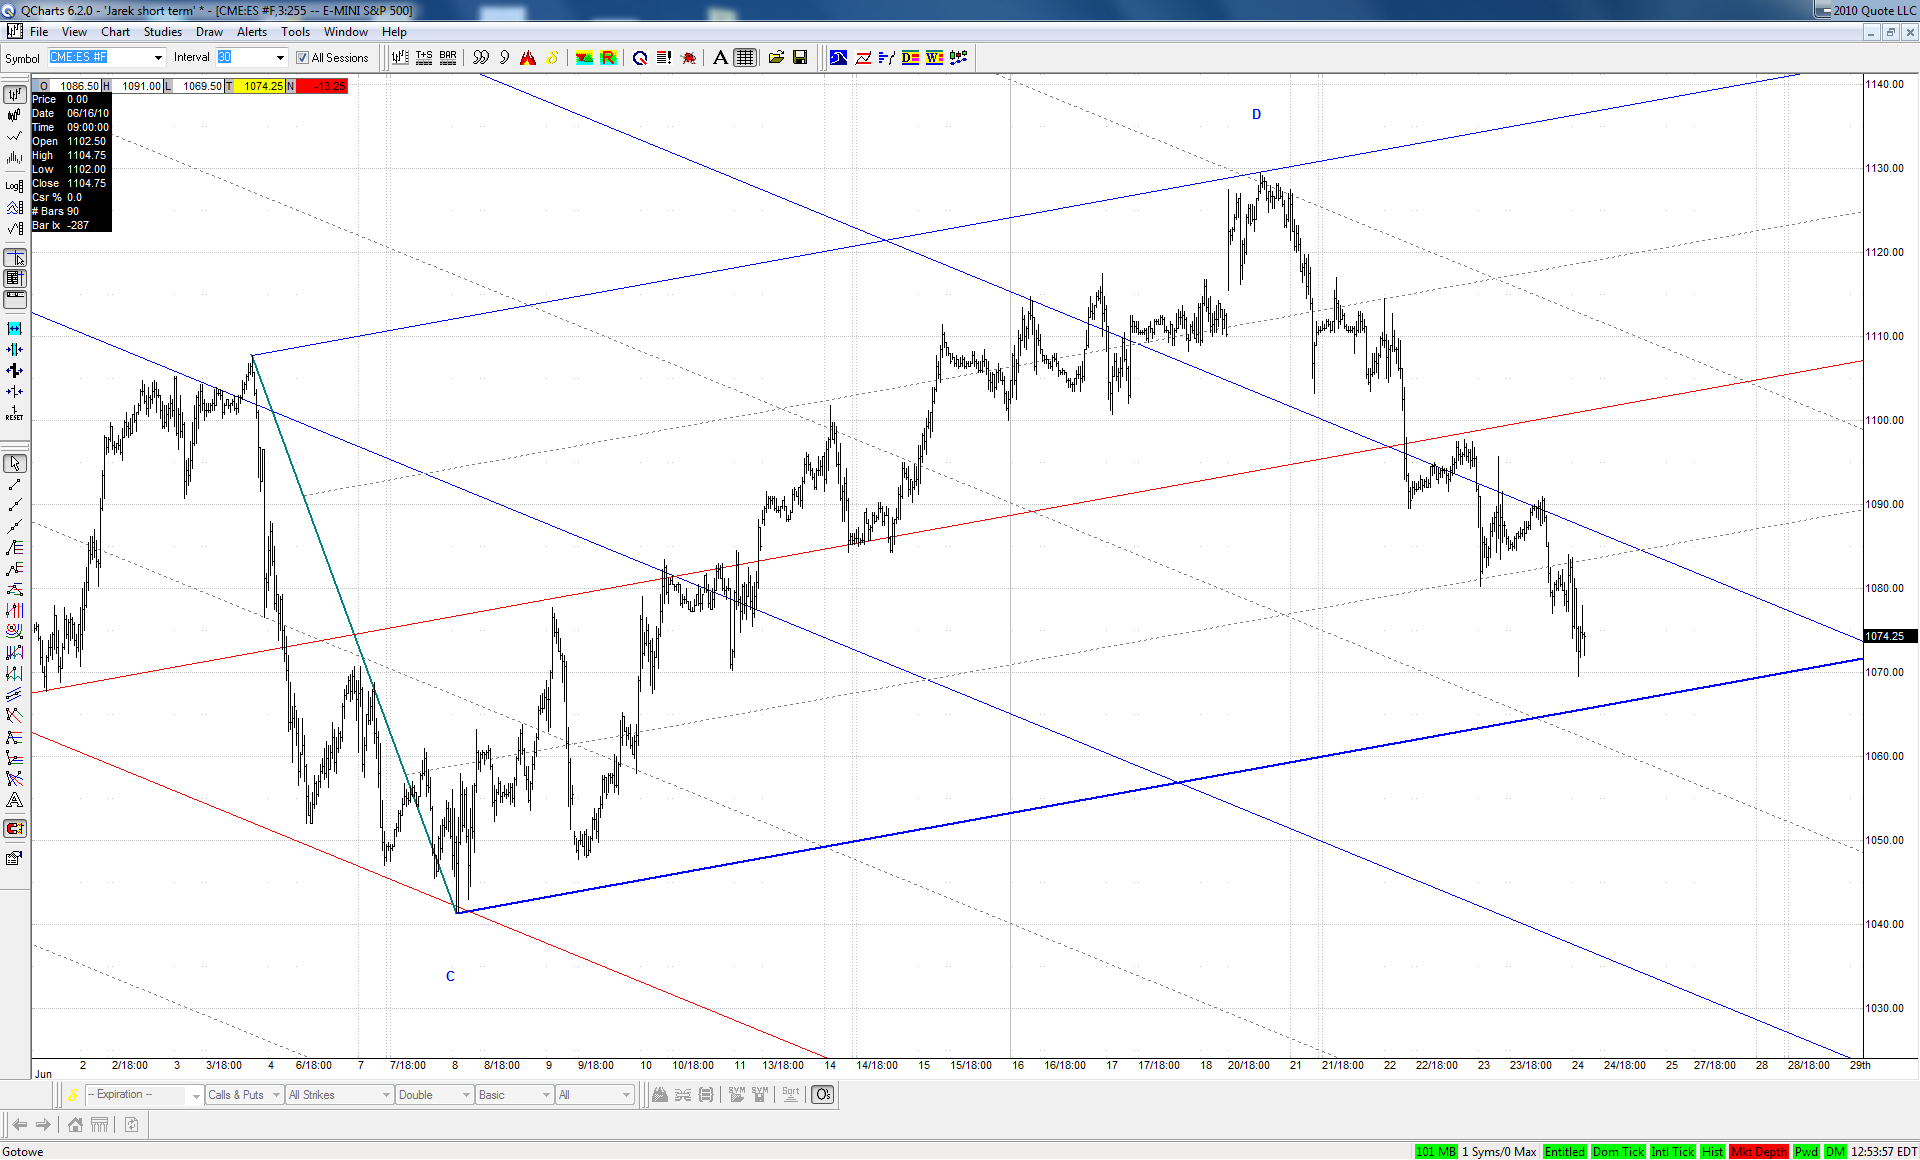
Great work, jarek. That's why I am watching for potential upward pressure in here. If that first chart area goes (goes here means 'gives way'), this might take out the key 1040 area and really get moving. And that last chart shows why I think this is stalling here, and how I am using that for clues for the push up off 72 that I mentioned.
JI
jimkane
Rep: 3,058
Posts: 33,089
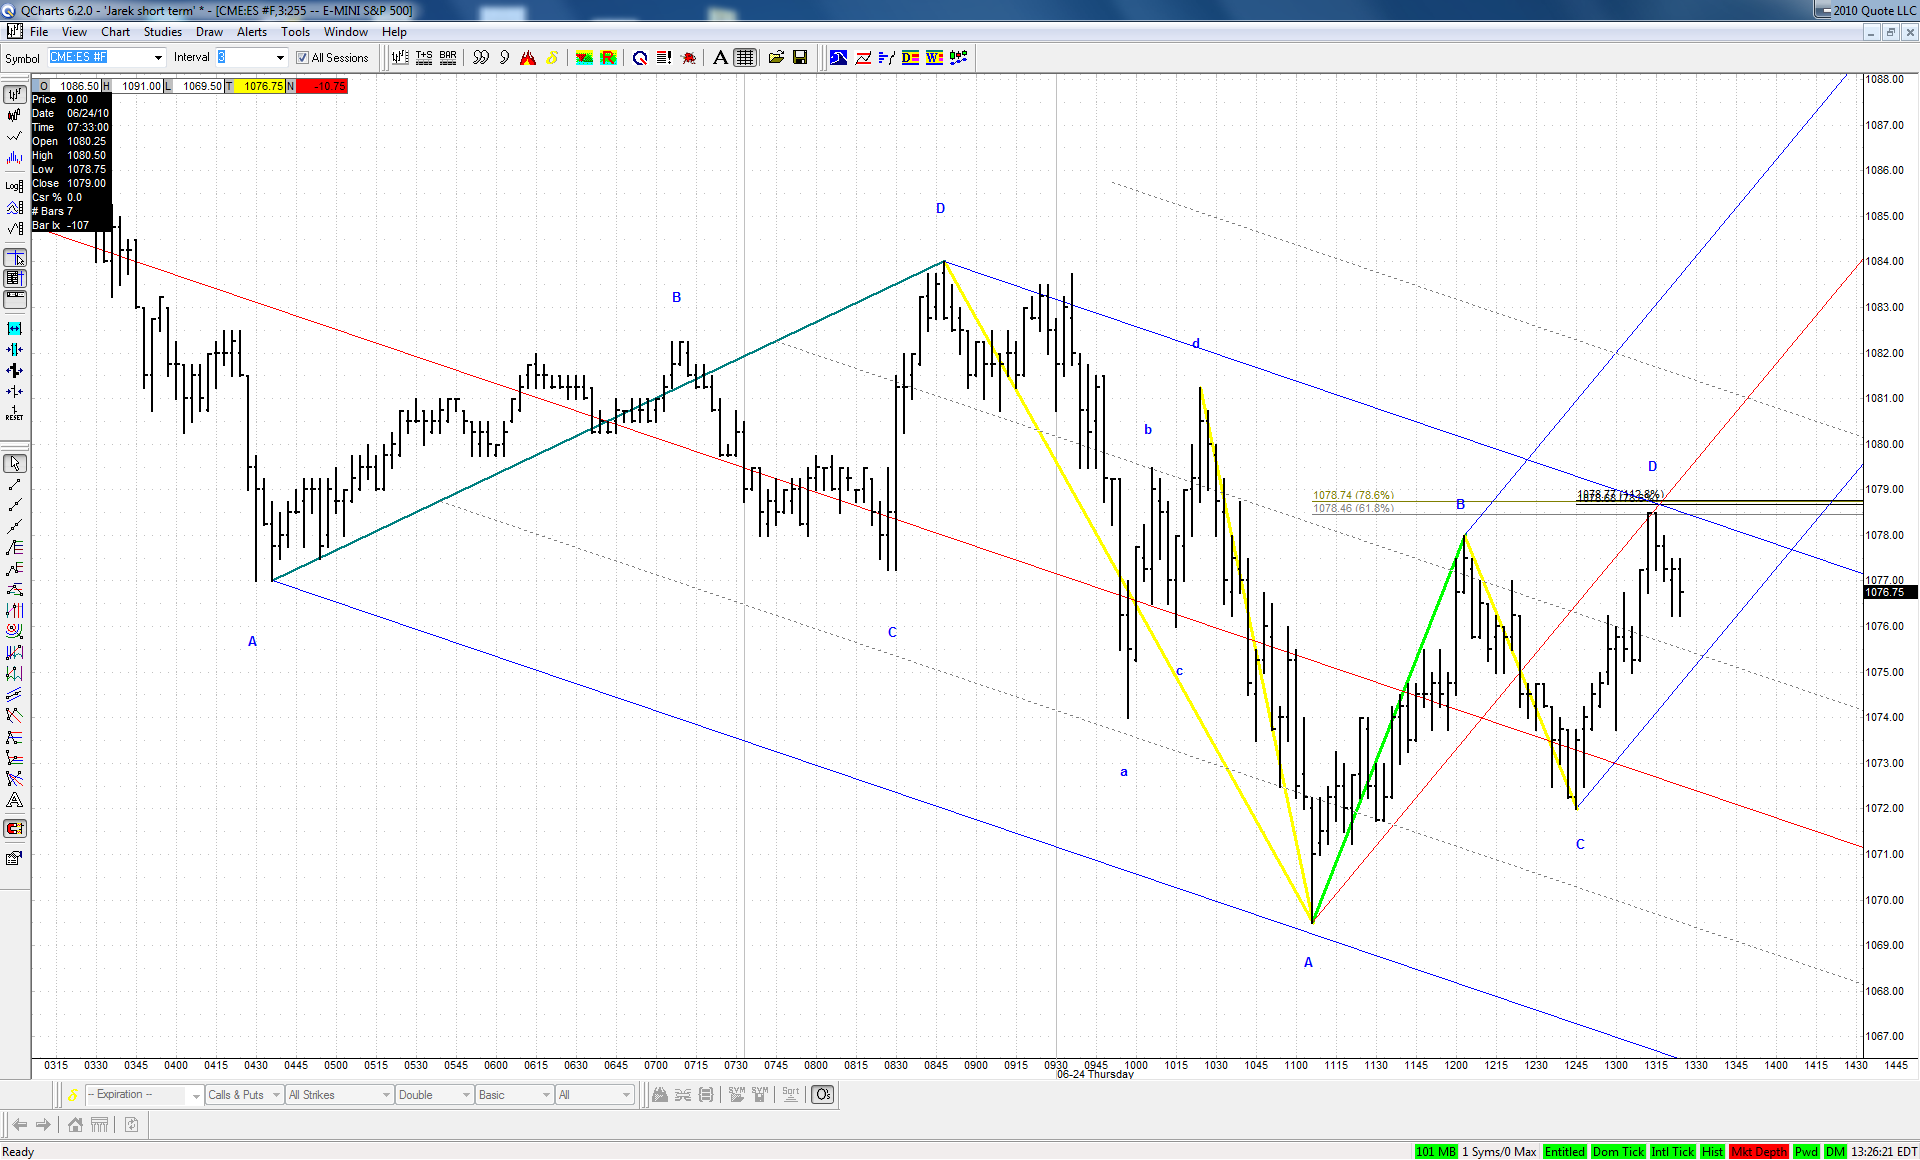
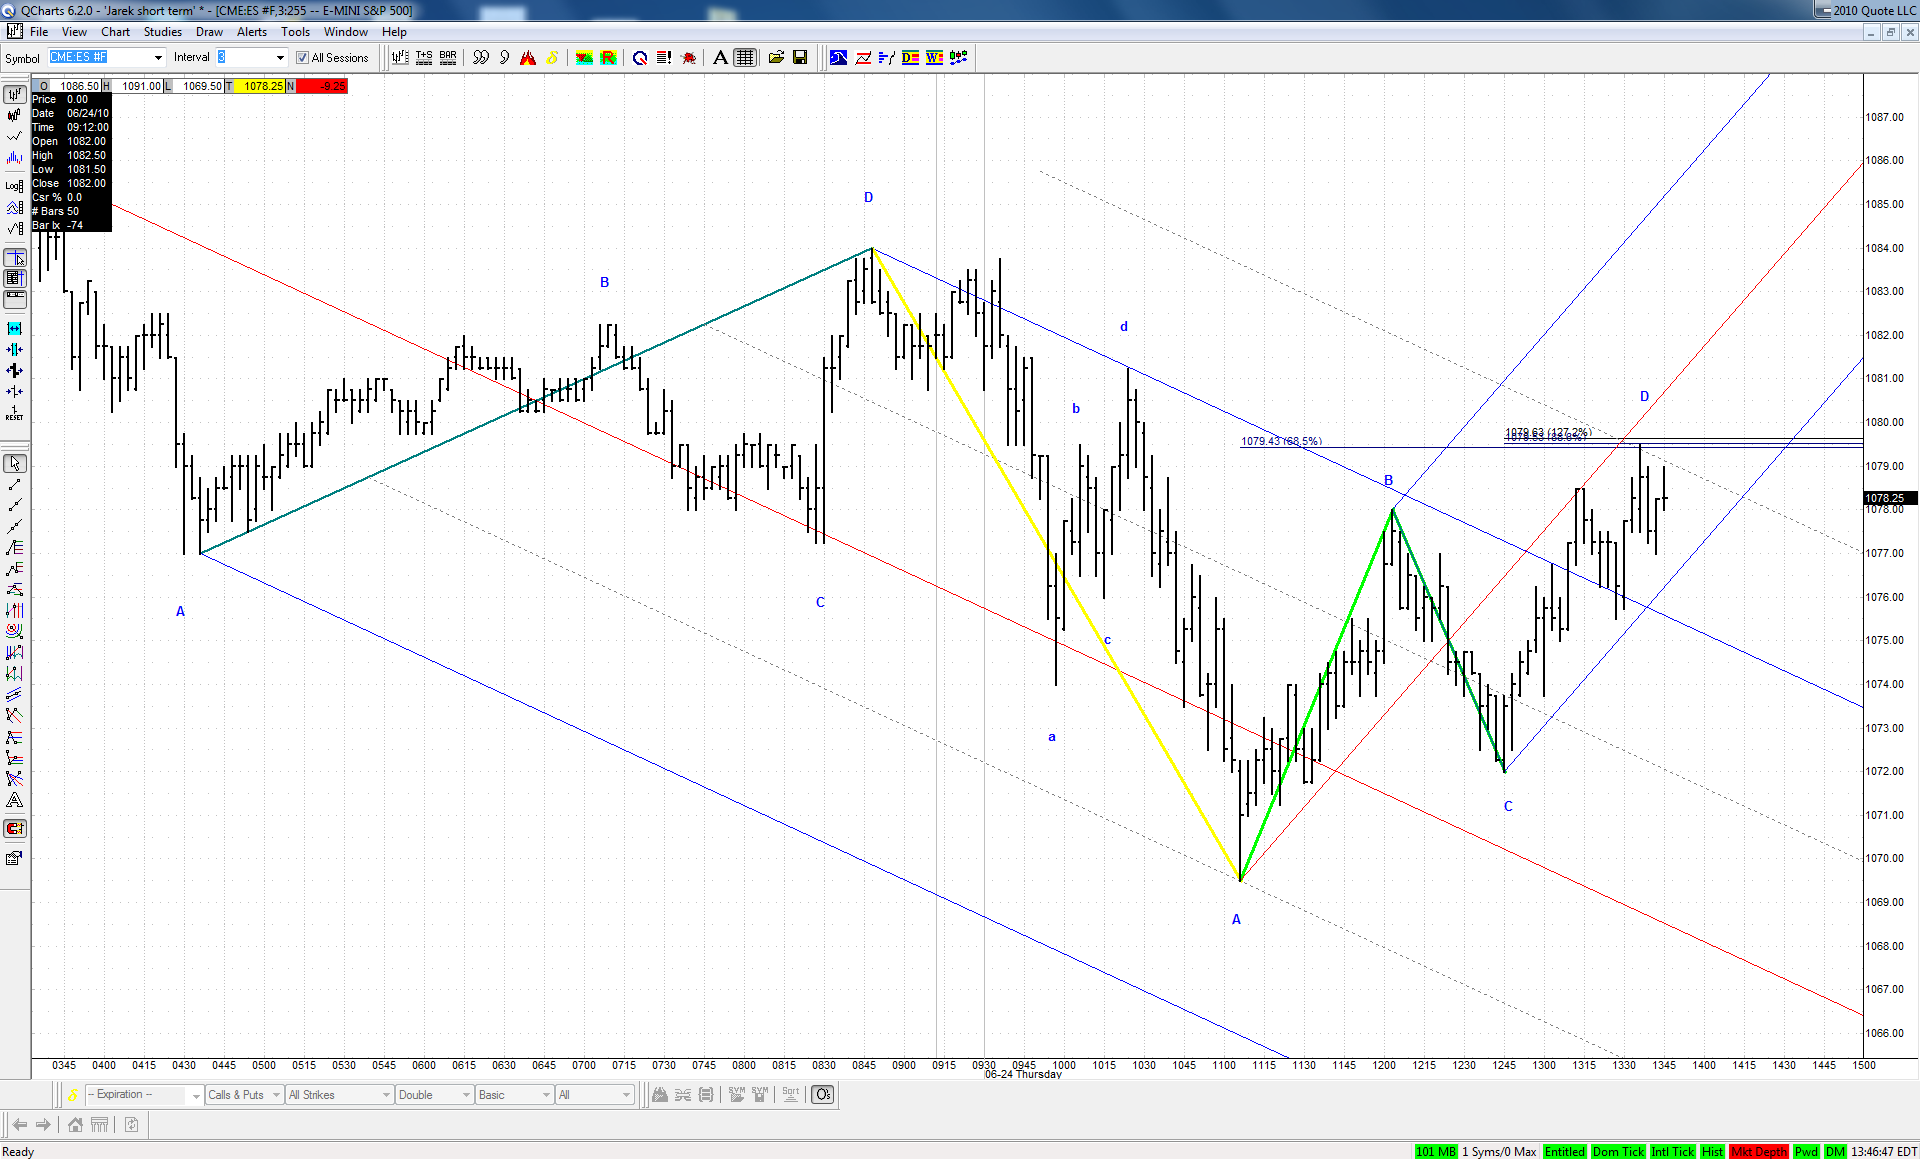
Now staying with the long side bias intraday off the 72. I'm watching here at 78.50 (in case), but more interested in the ABCD area just above.
JI
jimkane
Rep: 3,058
Posts: 33,089
Great chartwork, jarek. Most of your charts look like near clones of mine now. Hence my 78.50 watch. But, it wants higher, and I suspect more than that full ABCD, but that's where I'll be watching now.