Crude oil 5896
Hey Vo!..contact me again! I deleted the e-mail!!!.....
Click image for original size
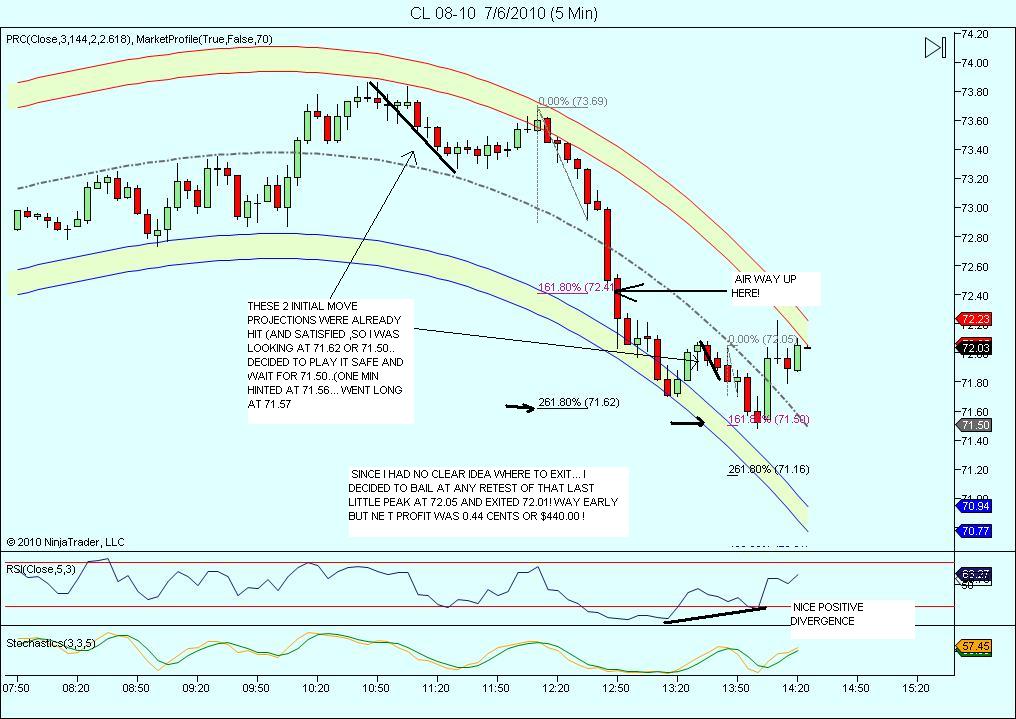
You can see from both charts that a decent low is due in the june-july timeframe. Longs have to be cautious later as there is a well known seasonal trade coming where they sell around the 14th-15th and cover near the end of the month.
Originally posted by koolblue
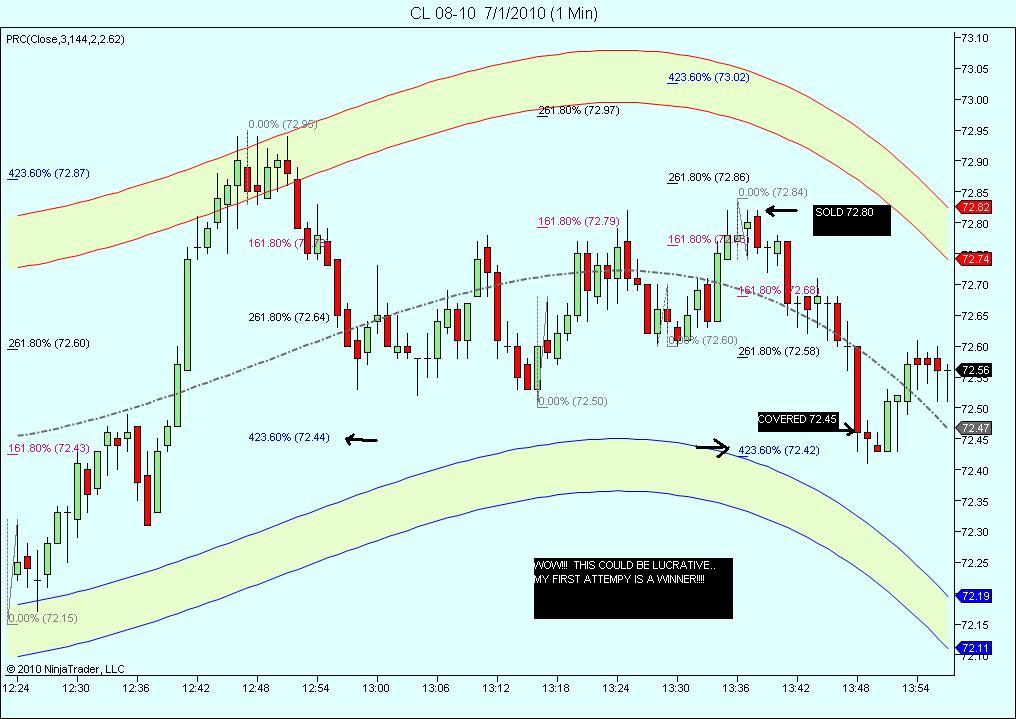
Originally posted by sjzenofriend, if you open up the chart, you will see more... the projections were fairly obvious and the one min chart (not shown, confirmed the short term peak around 72.85. the 5 min rsi(5 period), not shown also was very overbought so i jumped in on a short...my one min chart showed the decline would go to 72.64, so i bailed a little in front of it at 72.70 for my exit. Same techniques as i have used on the es for years.
Nice one Kool.What made you sell up there?
Thanks I think I see now. You wait for the initial move to get your price projection, then you try and fade the area of your projection? Do you need your indicators to be oversold also?
I remember learning your techniques for cycles like 5 years ago!
But can you give a quick definition of the 'initial move'?
Thanks Kool I been learning a lot from you and practicing your techniques in real time.
Good job so far on the CL endeavor.
Click image for original size
Emini Day Trading /
Daily Notes /
Forecast /
Economic Events /
Search /
Terms and Conditions /
Disclaimer /
Books /
Online Books /
Site Map /
Contact /
Privacy Policy /
Links /
About /
Day Trading Forum /
Investment Calculators /
Pivot Point Calculator /
Market Profile Generator /
Fibonacci Calculator /
Mailing List /
Advertise Here /
Articles /
Financial Terms /
Brokers /
Software /
Holidays /
Stock Split Calendar /
Mortgage Calculator /
Donate
Copyright © 2004-2023, MyPivots. All rights reserved.
Copyright © 2004-2023, MyPivots. All rights reserved.