MyPivots
Sign In
JA
jarek
Rep: 94
Posts: 3,474
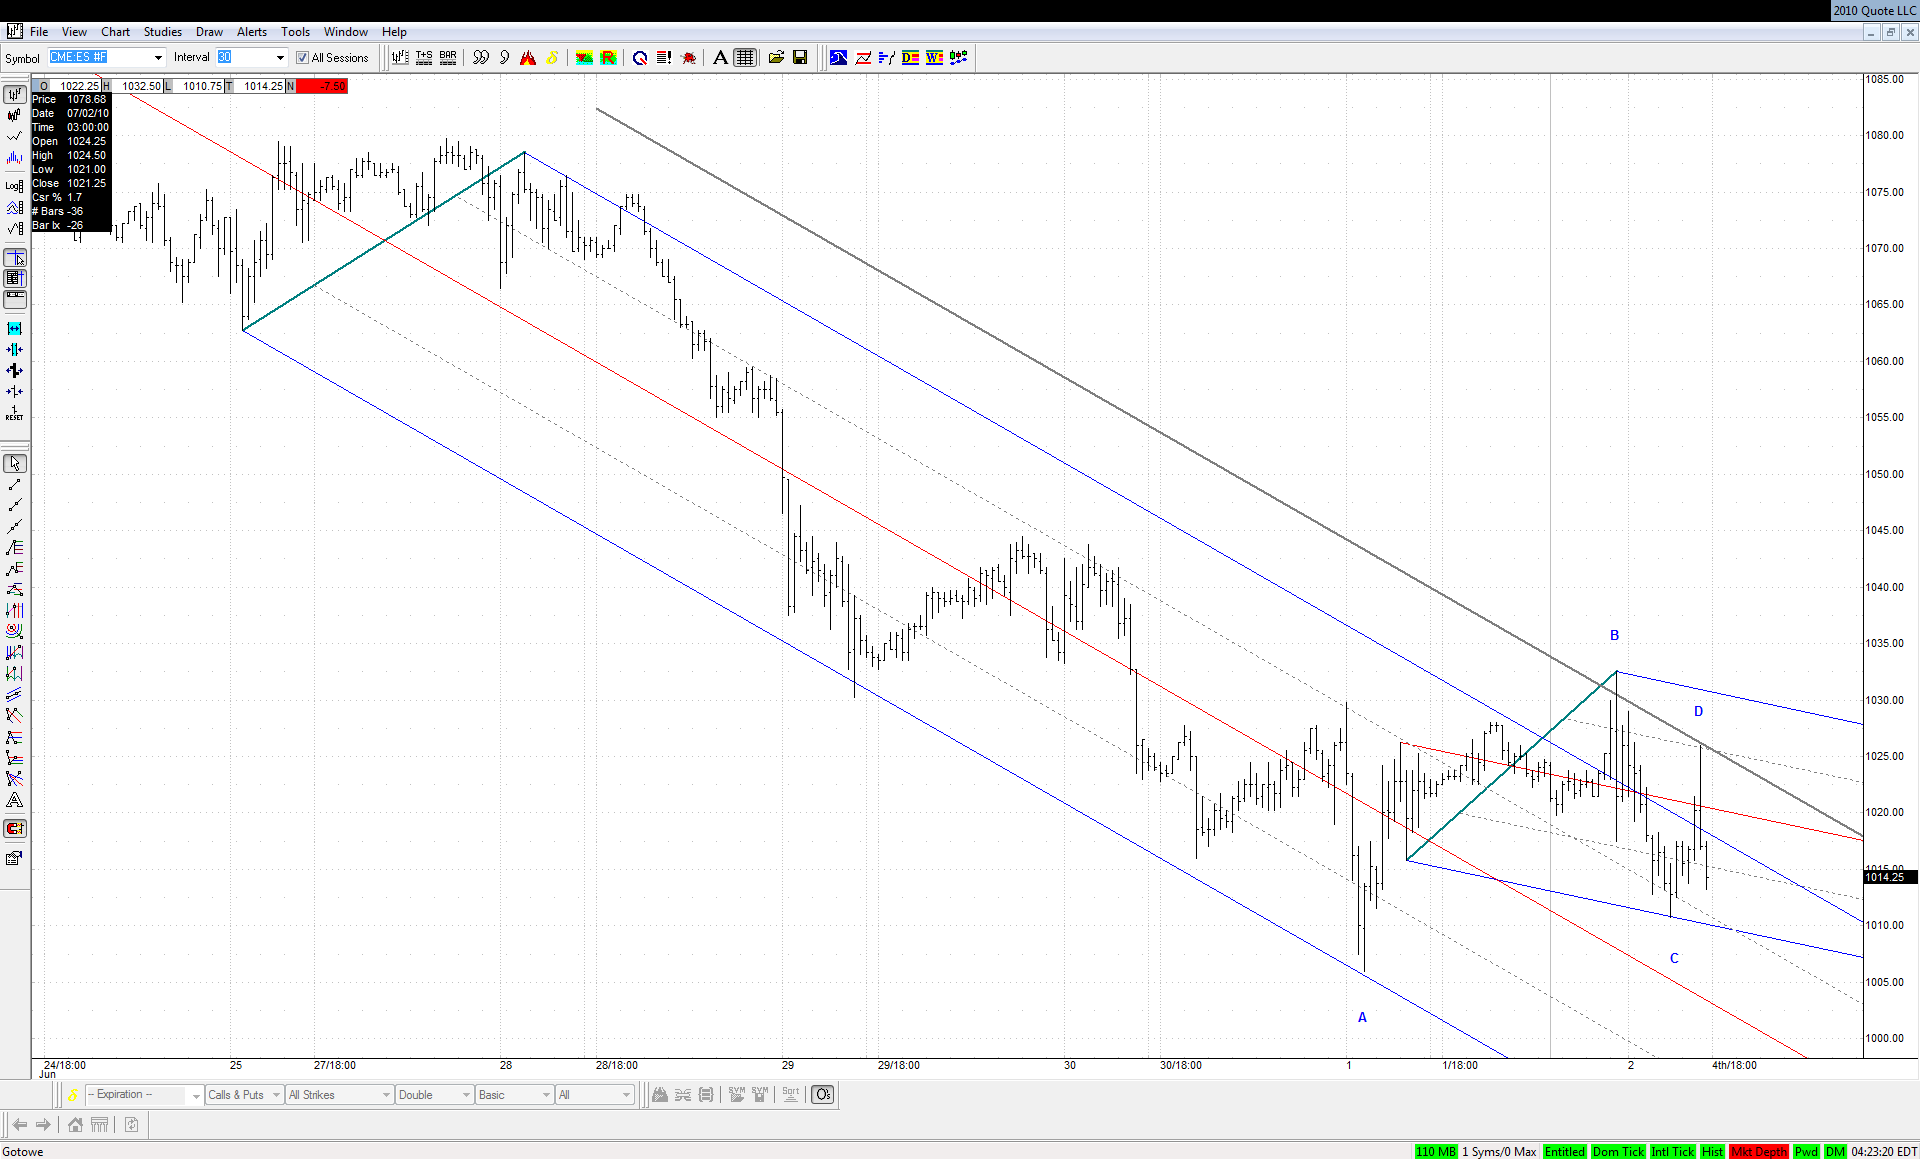
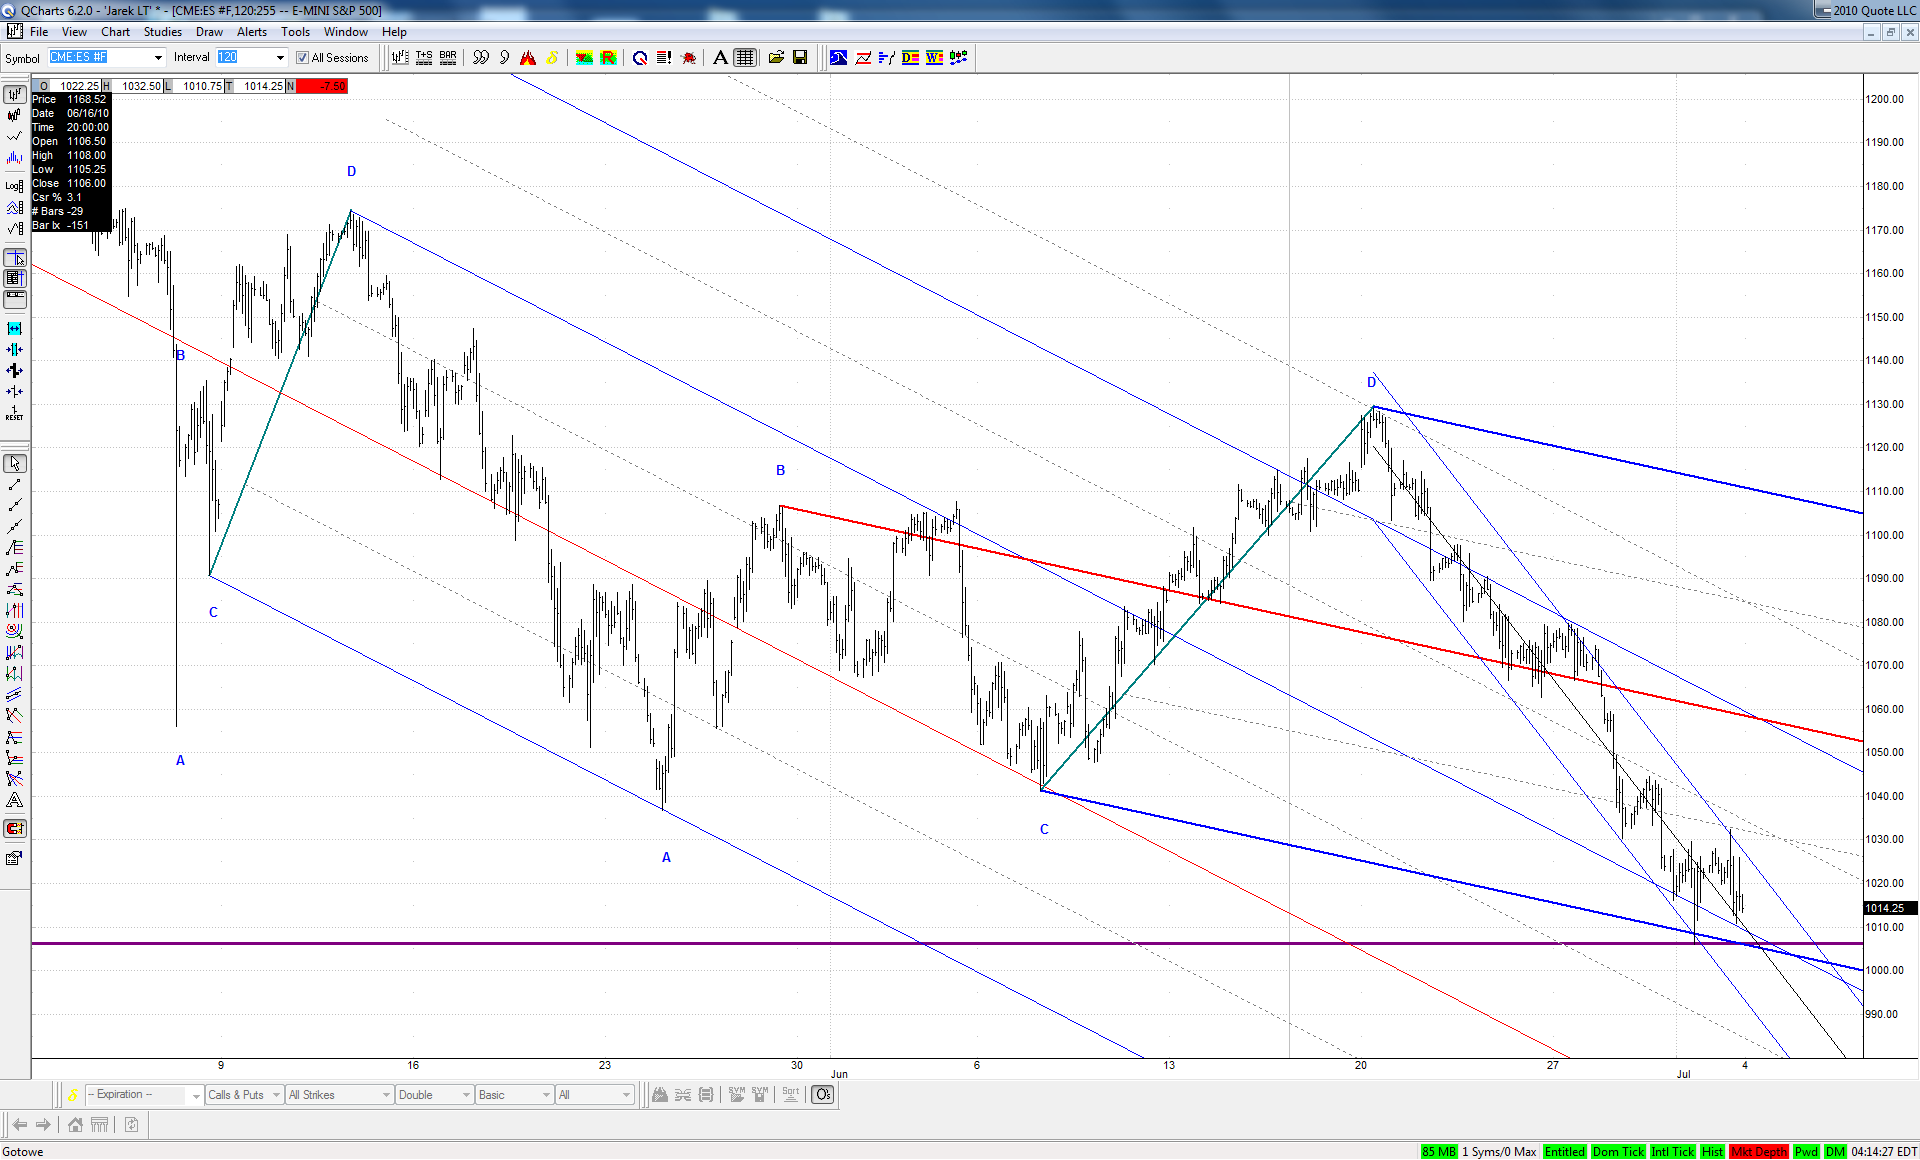
We began last week right above the ML of the downsloping set anchored at points B, C and D of our bearish ABCD and we finished the week right above the lower ML of this set, while bouncing exactly off it on Thursday:


Click image for original size


Notice the line convergence at 1000-1010 level. This is why potential break of the last low should result in acceleration of the move to the downside.
JA
jarek
Rep: 94
Posts: 3,474
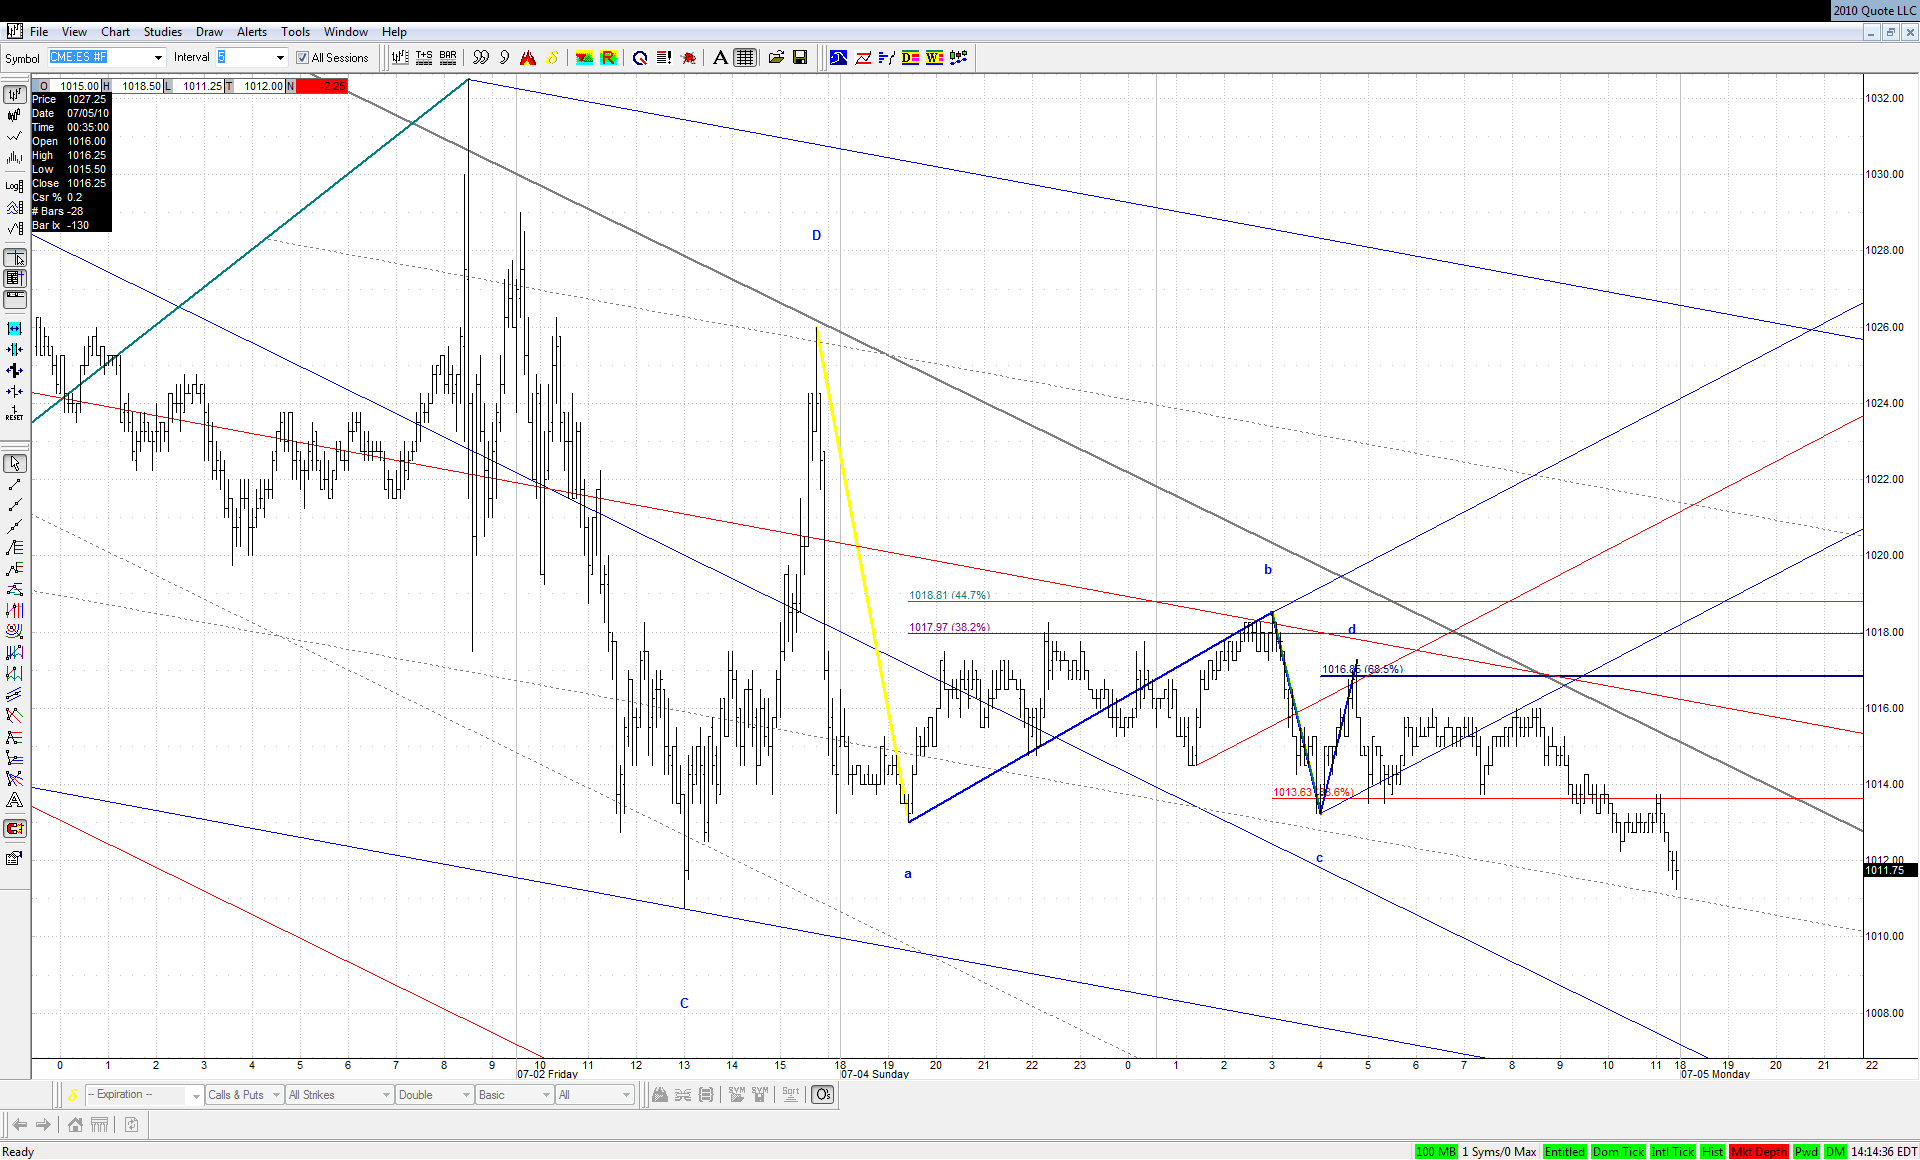
Jim mentioned on Friday some super key lines right at the area of the late day high for potential completion of .685 bearish 4PT. Here are the best lines I could find beside the one shown on my last Friday's chart:


Click image for original size
JA
jarek
Rep: 94
Posts: 3,474
I will be leaving for a well deserved vacation later this week and won't be posting here for some time. I thought it was a good chance for a recap of some of the longer term charts.

We just had a clear acceleration to the downside right through the ML of our old good DJIA upsloping set:

Click image for original size
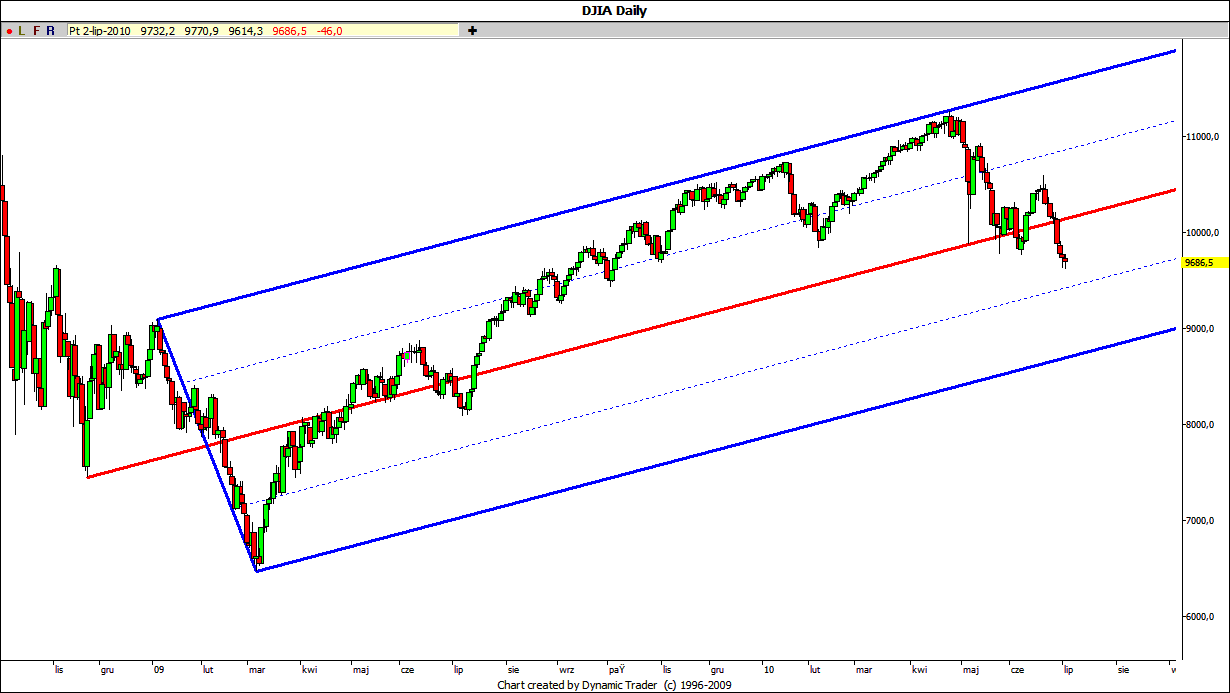

This suggest that the target for the decline is the lower ML at around 8700 or a good 10% below the current levels.


The rise in gold hasn't exactly reached 1.272 of the Dec 09 - Feb 10 bullish ABDC, but was close enough to call it potentially completed:


Click image for original size
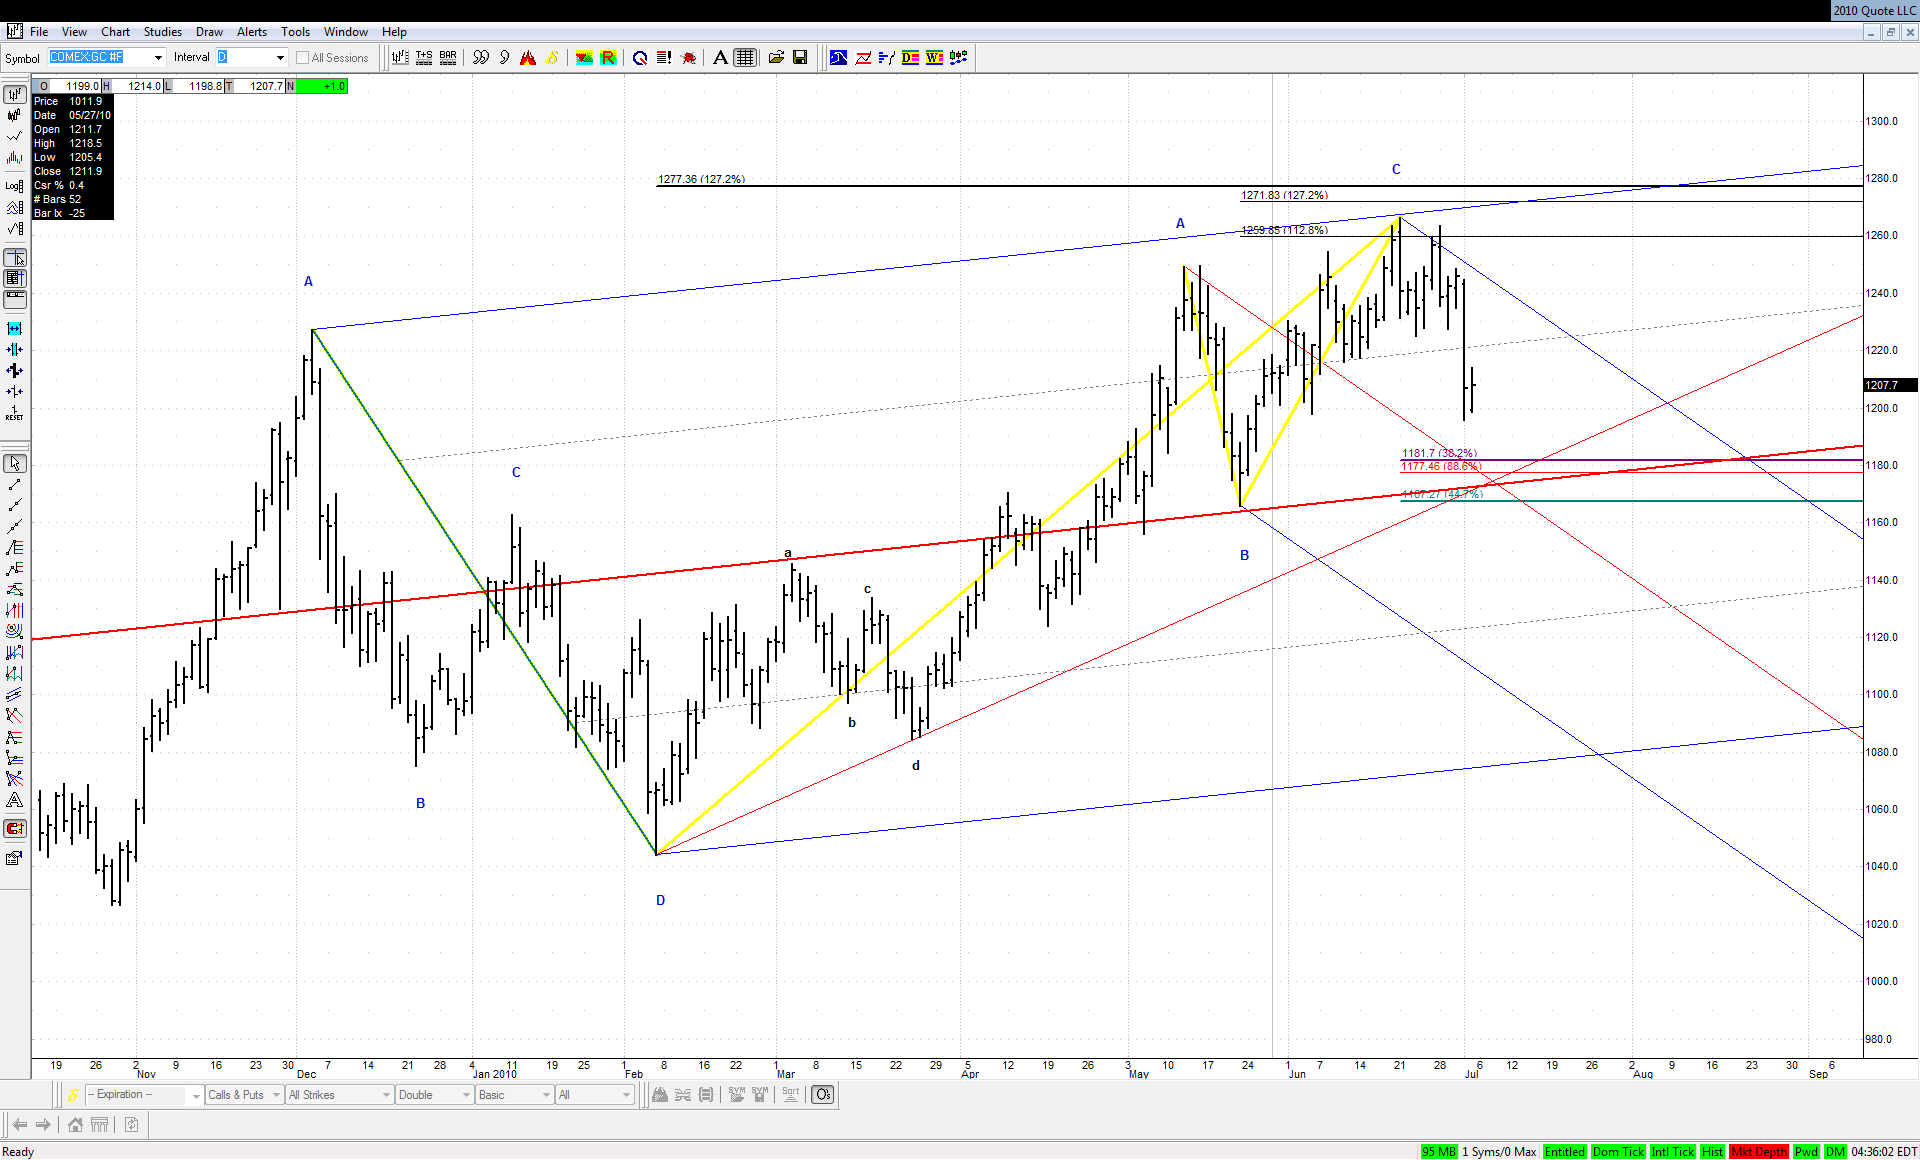

If this rise from February is not meant to be Wave 5 of some degree than bulls have to defend the 1175 level.


The rates are going lower as predicted here some time ago. Bulls weren't able to contain the decline with the help of a bullish flat ABCD:


Click image for original size
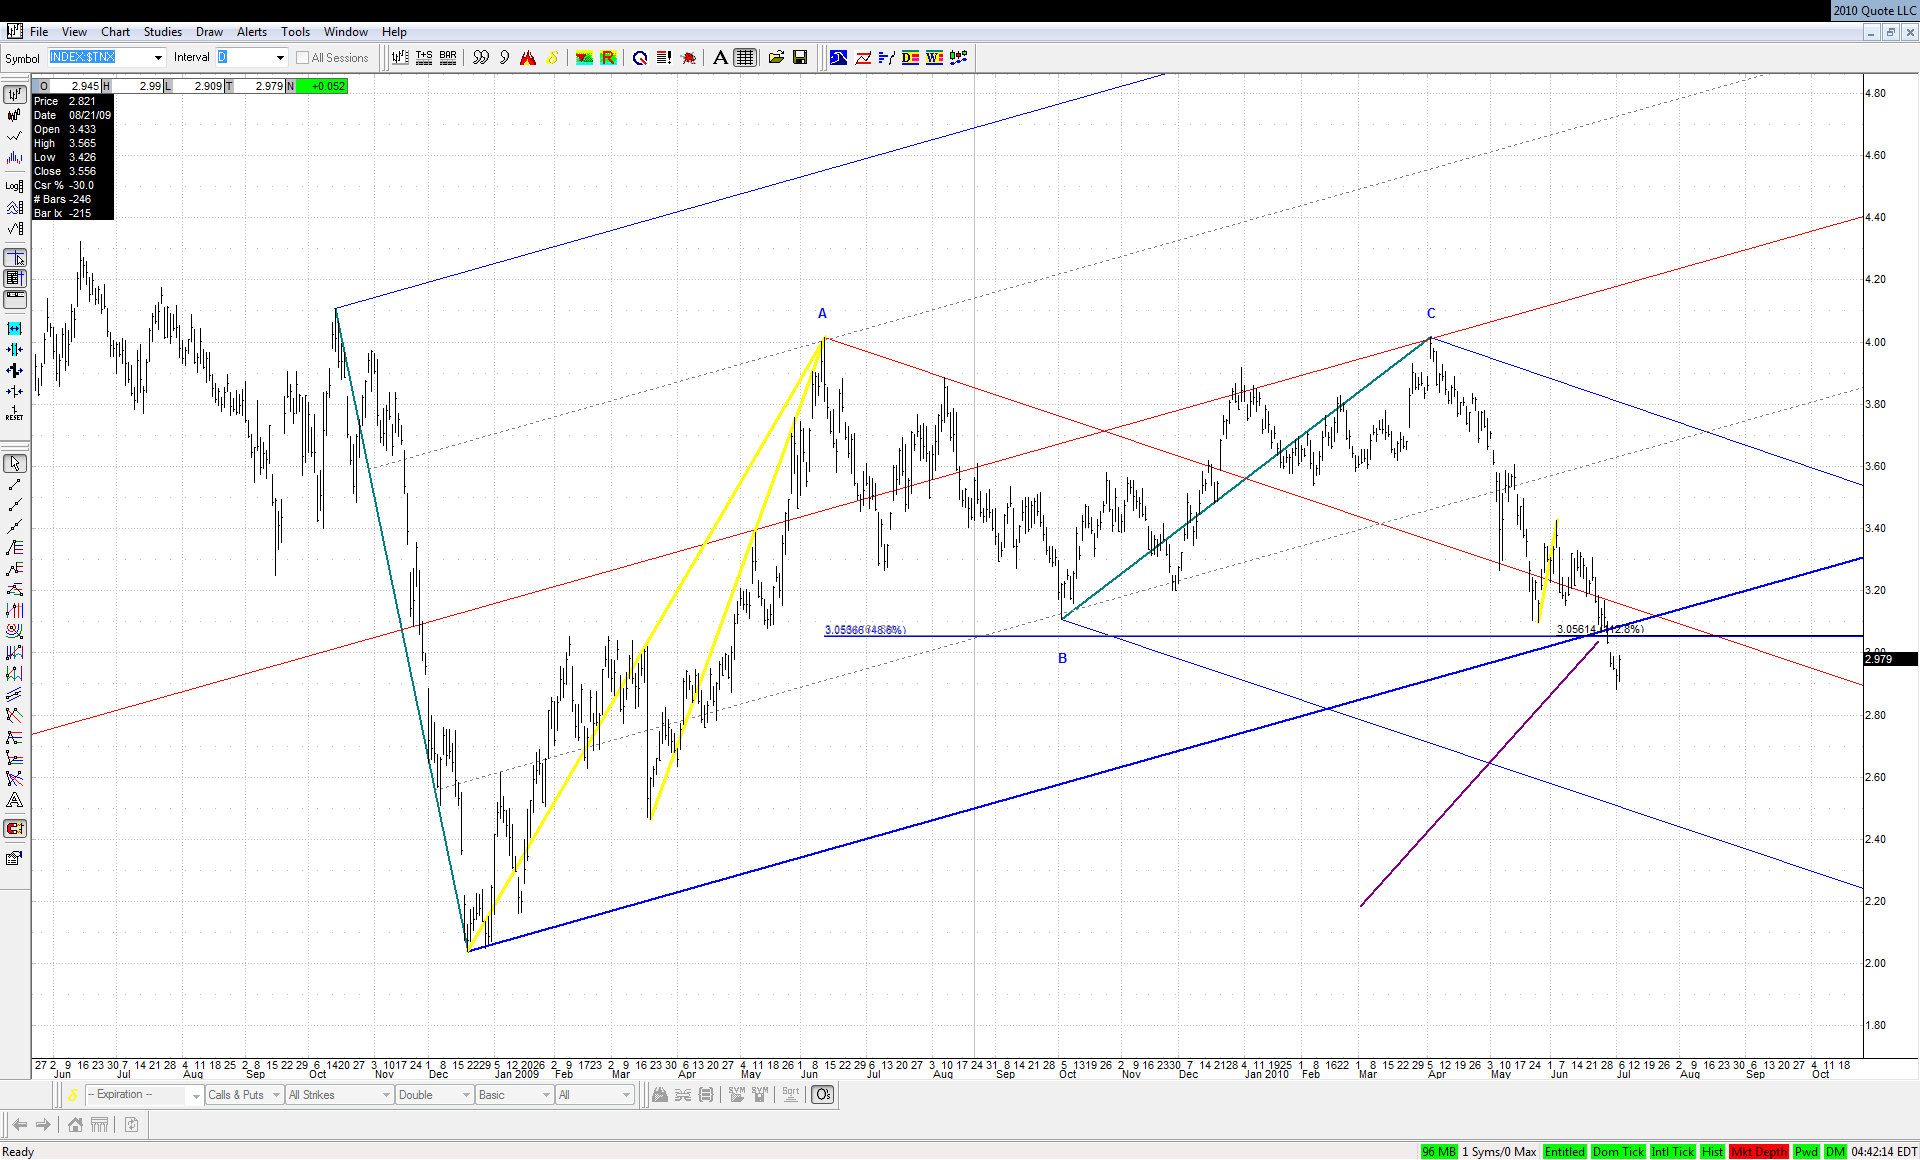

The lower ML of the downsloping set at 2.50 might be the next target
JI
jimkane
Rep: 3,058
Posts: 33,089
Great work, jarek.

Imagine rates at 2.50! And some say there is no deflation 'yet'. If rates do keep going down the market should follow.
JI
jimkane
Rep: 3,058
Posts: 33,089
Also, could this be a 3-4-5 headfake below the key area and then up? Up for a big move (and the market up, too), or up for a 'backtest' of the line/area, and then to that 2.50?
JA
jarek
Rep: 94
Posts: 3,474
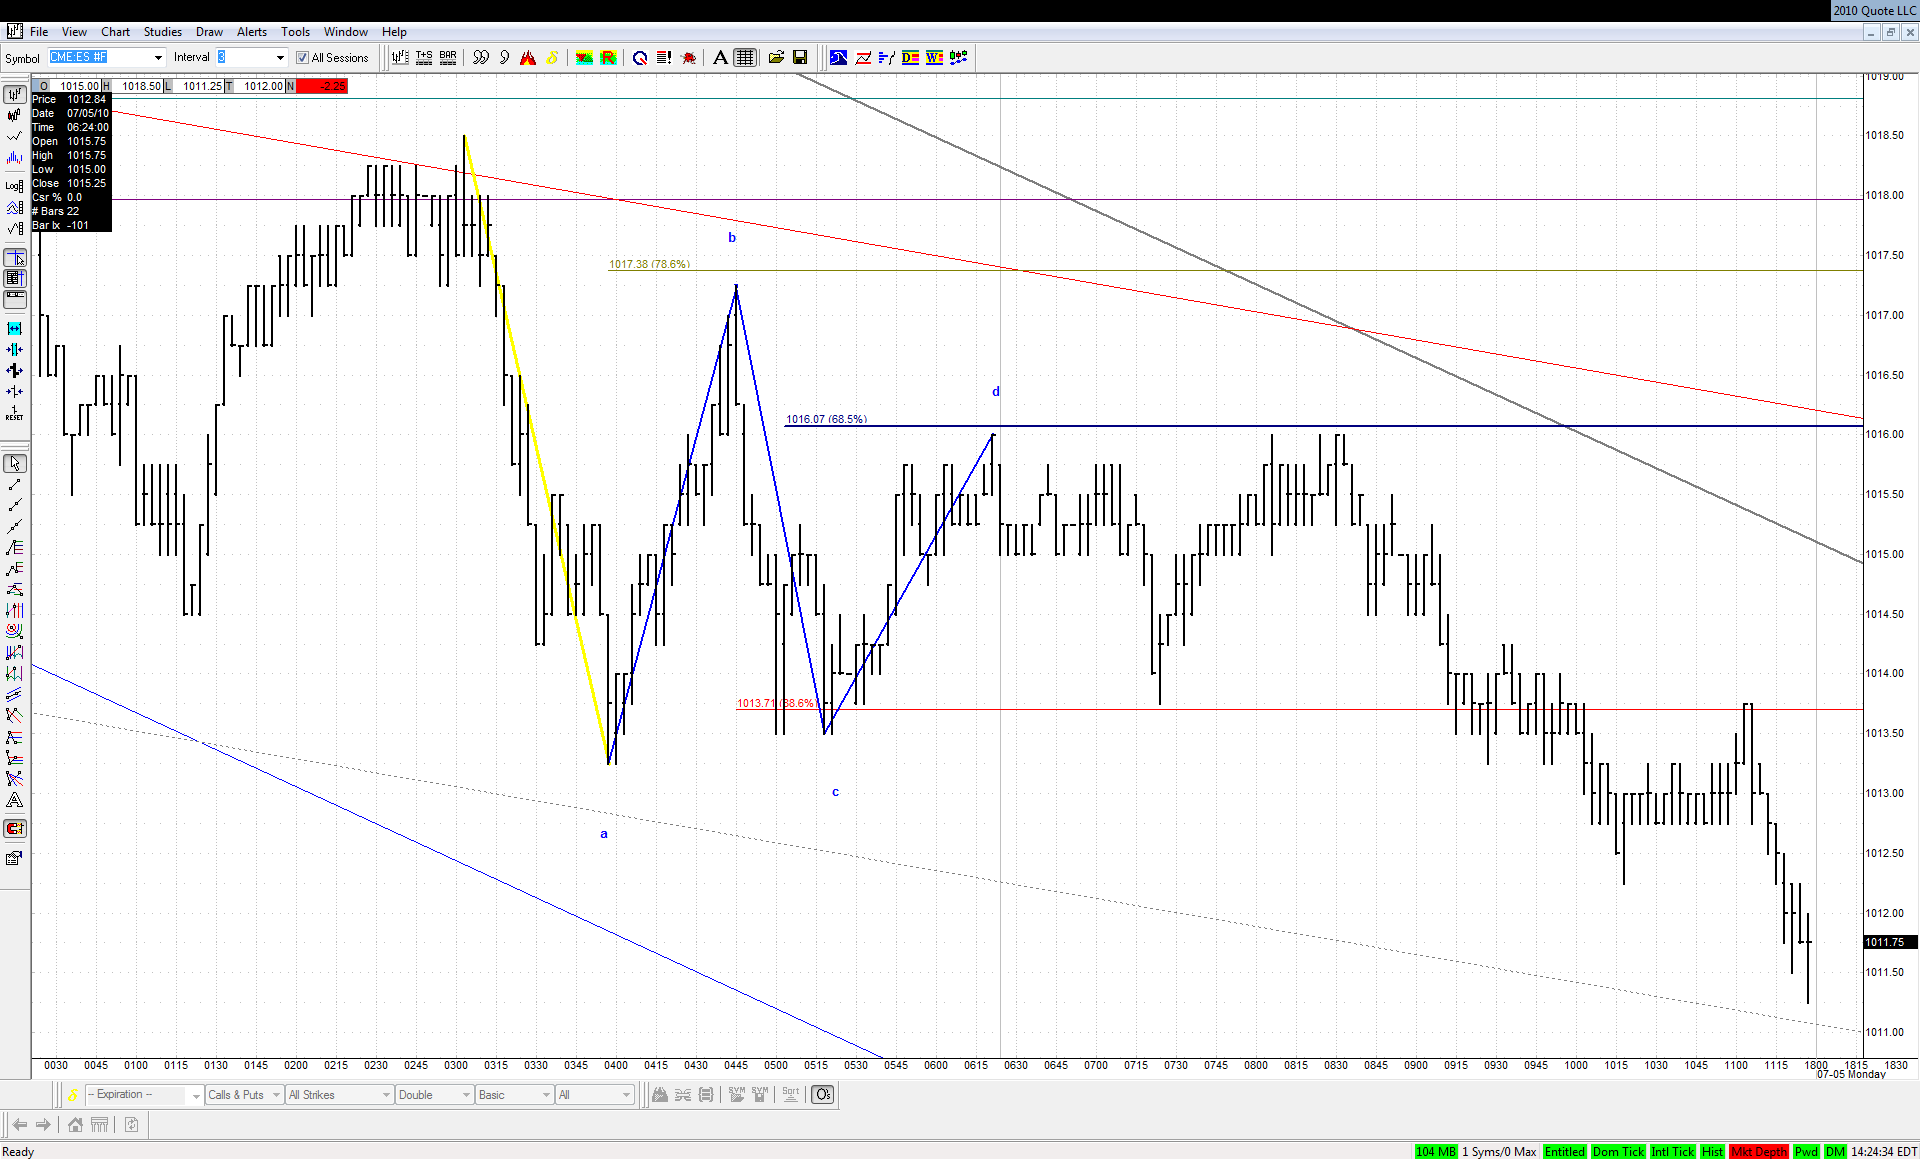
Here is something really interesting to ponder. We have a big bearish Flat ABCD above and the first thrust down off it was corrected by .685 4PT. But when we look at the potential first thrust down off this .685 4PT than it was also corrected by .685 4PT:


Click image for original size


We can also find another potential .685 4PT of smaller degree:


Click image for original size


Coincidence?
JI
jimkane
Rep: 3,058
Posts: 33,089
It's loving those .685's lately. Like roofer pointed out many times in the past about patterns/setups coming and going and returning and so on, lately it's all about the .685, and .685 4PT's. Very interesting.
JI
jimkane
Rep: 3,058
Posts: 33,089
Very interesting action. ES hits 1002.75, and is now 8 points off the low. A 'test' of the 1,000 level and a snap bebound so far...
JI
jimkane
Rep: 3,058
Posts: 33,089
This thing's a rocketship right now...
JI
jimkane
Rep: 3,058
Posts: 33,089
11 points off the low! Look at that little flat 'W2' ABCD to get in with right after it reversed, too.
JI
jimkane
Rep: 3,058
Posts: 33,089
Now up 14.25 off the low! Looks like I may be staying up a bit longer...
JA
jarek
Rep: 94
Posts: 3,474
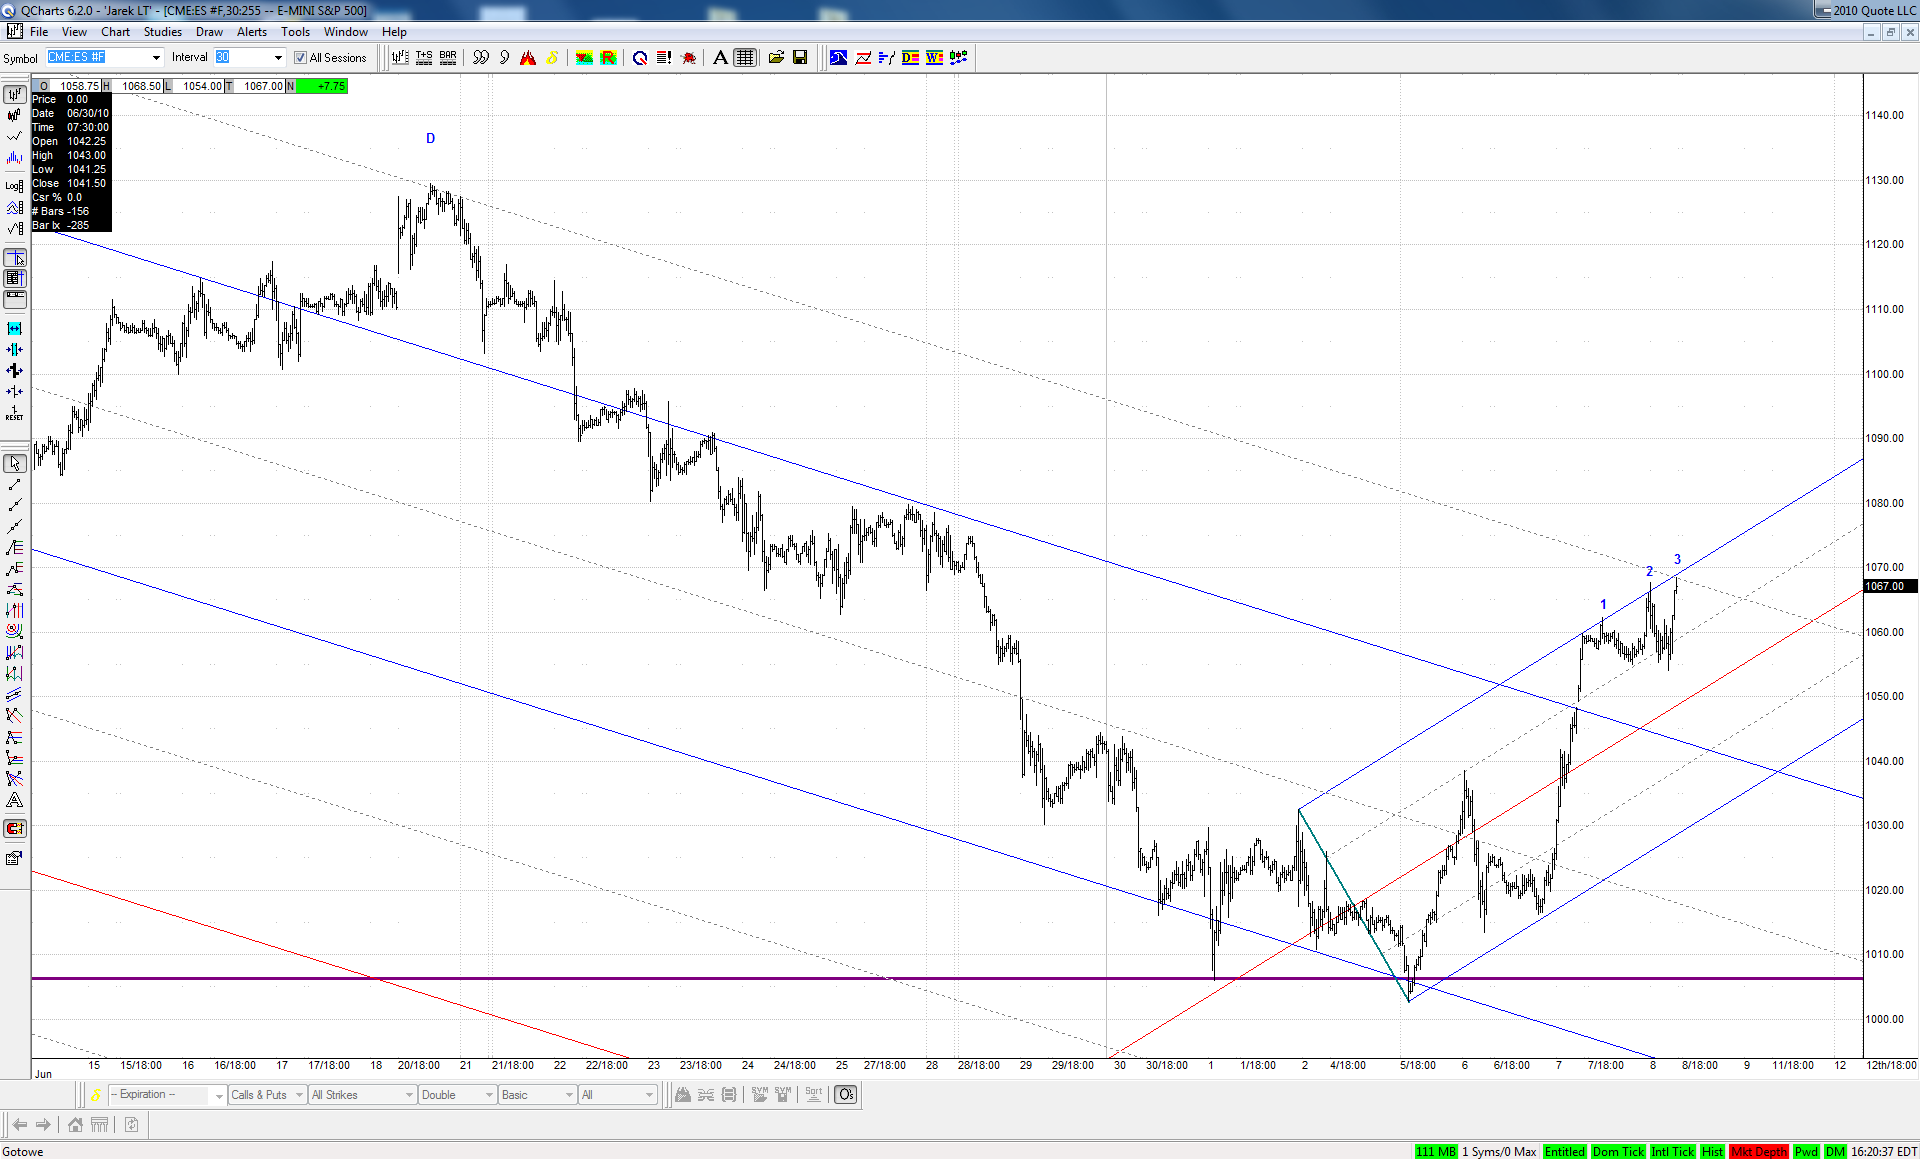
For me it was a clear 3D right into one of my key downsloping lines:


Click image for original size


Time for a well deserved correction tomorrow