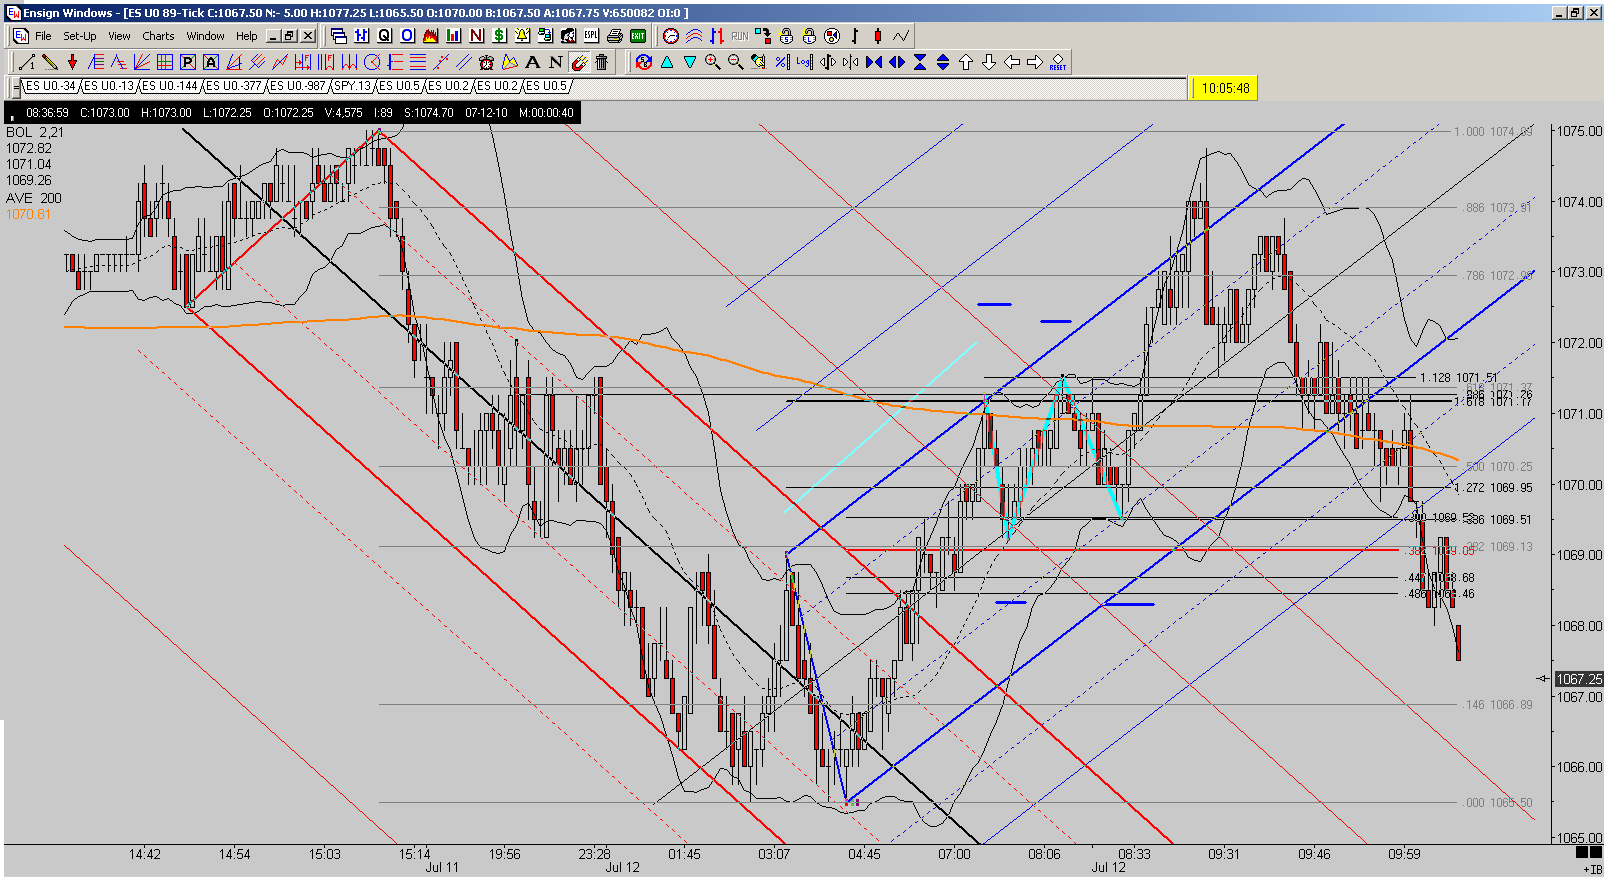
Kane TD ABCD. I thought I had a sweet sell setup, what I thought was a pretty good Kane Pattern-Line-Fib, completing at 0.618 Fibo Retrace of the GLOBEX Hi-to-Lo, confluent with a Kane DB ABCD also completing at 0.618 Fibo Retrace of the GLOBEX Hi-to-Lo (& 1.618),a Trader's Dream, & 200 SMA touching price. I "put on the blinders" entered & stared at the price action, and completely missed the Kane TD BUY setup completing at a 0.300 Fibo Retrace! The C-to-D leg of the Kane TD ABCD also formed a Kane Pattern-Line-Fib. The Kane TD ABCD/Pattern-Line-Fib trumped the previous setup. I must make a note in my Trading Plan about "keeping the blinders off" when I enter a trade!
Good Trading,
Al Kamego
PS I am still paper trading!
Al KAmego
JI
jimkane
Rep: 3,058
Posts: 33,089
From my post on 7/7/2010:
The high I have was at 99.25. The thing that is so incredible to me is what my lines showed. This went right to my key lines, the same ones I had on the 7th when I posted the above, and 'tested' the area multiple times. Then this morning in GLOBEX it does this super-sweet 15-min traded timeframe ABCD, and I had two lines on that one chart from the higher timeframe, just a little bit apart from each other (they were coming from the much higher timeframe, and I was watching the 3-min, and the lines were about 1.00-1.25 points apart), and the ABCD completed right between the lines. I also had another line from the more recent action, and it hit that one to the tick. There was other stuff, too, but this lays out just how amazing this was, and not unexpected to me.
If you are a mentor student of mine and want to see this workup, make a note and ask me at our next session.
Great work, iso, you had this nailed. Kudo's to everyone who posted on this area.
Originally posted by jimkane
If the upcoming key area can be overcome, the next levels I am watching are about (very appx. right now) 67-71, 84, and most critically, 96-98.
The high I have was at 99.25. The thing that is so incredible to me is what my lines showed. This went right to my key lines, the same ones I had on the 7th when I posted the above, and 'tested' the area multiple times. Then this morning in GLOBEX it does this super-sweet 15-min traded timeframe ABCD, and I had two lines on that one chart from the higher timeframe, just a little bit apart from each other (they were coming from the much higher timeframe, and I was watching the 3-min, and the lines were about 1.00-1.25 points apart), and the ABCD completed right between the lines. I also had another line from the more recent action, and it hit that one to the tick. There was other stuff, too, but this lays out just how amazing this was, and not unexpected to me.
If you are a mentor student of mine and want to see this workup, make a note and ask me at our next session.
Great work, iso, you had this nailed. Kudo's to everyone who posted on this area.
JI
jimkane
Rep: 3,058
Posts: 33,089
How's that for a lack of follow-through? Is this a little 'W2' ABCD here? I'll watch for clues, but so far the bulls haven't been able to make any stand with that little push up. That's not a good sign for those poor bovines... The ursines are still the animal to be right now, it seems.
JI
jimkane
Rep: 3,058
Posts: 33,089
Well, power to the ursines. Watch and see if this 1.272 push here sends it up, or if they break it down from here. This would be one more additional, and useful, clue for me.
JI
jimkane
Rep: 3,058
Posts: 33,089
It may just chop and grind here with a slight downward bias, but if this area gives way and it breaks down, it might really sell swiftly. This is something I'm inclined to give it a chance to do, just in case.