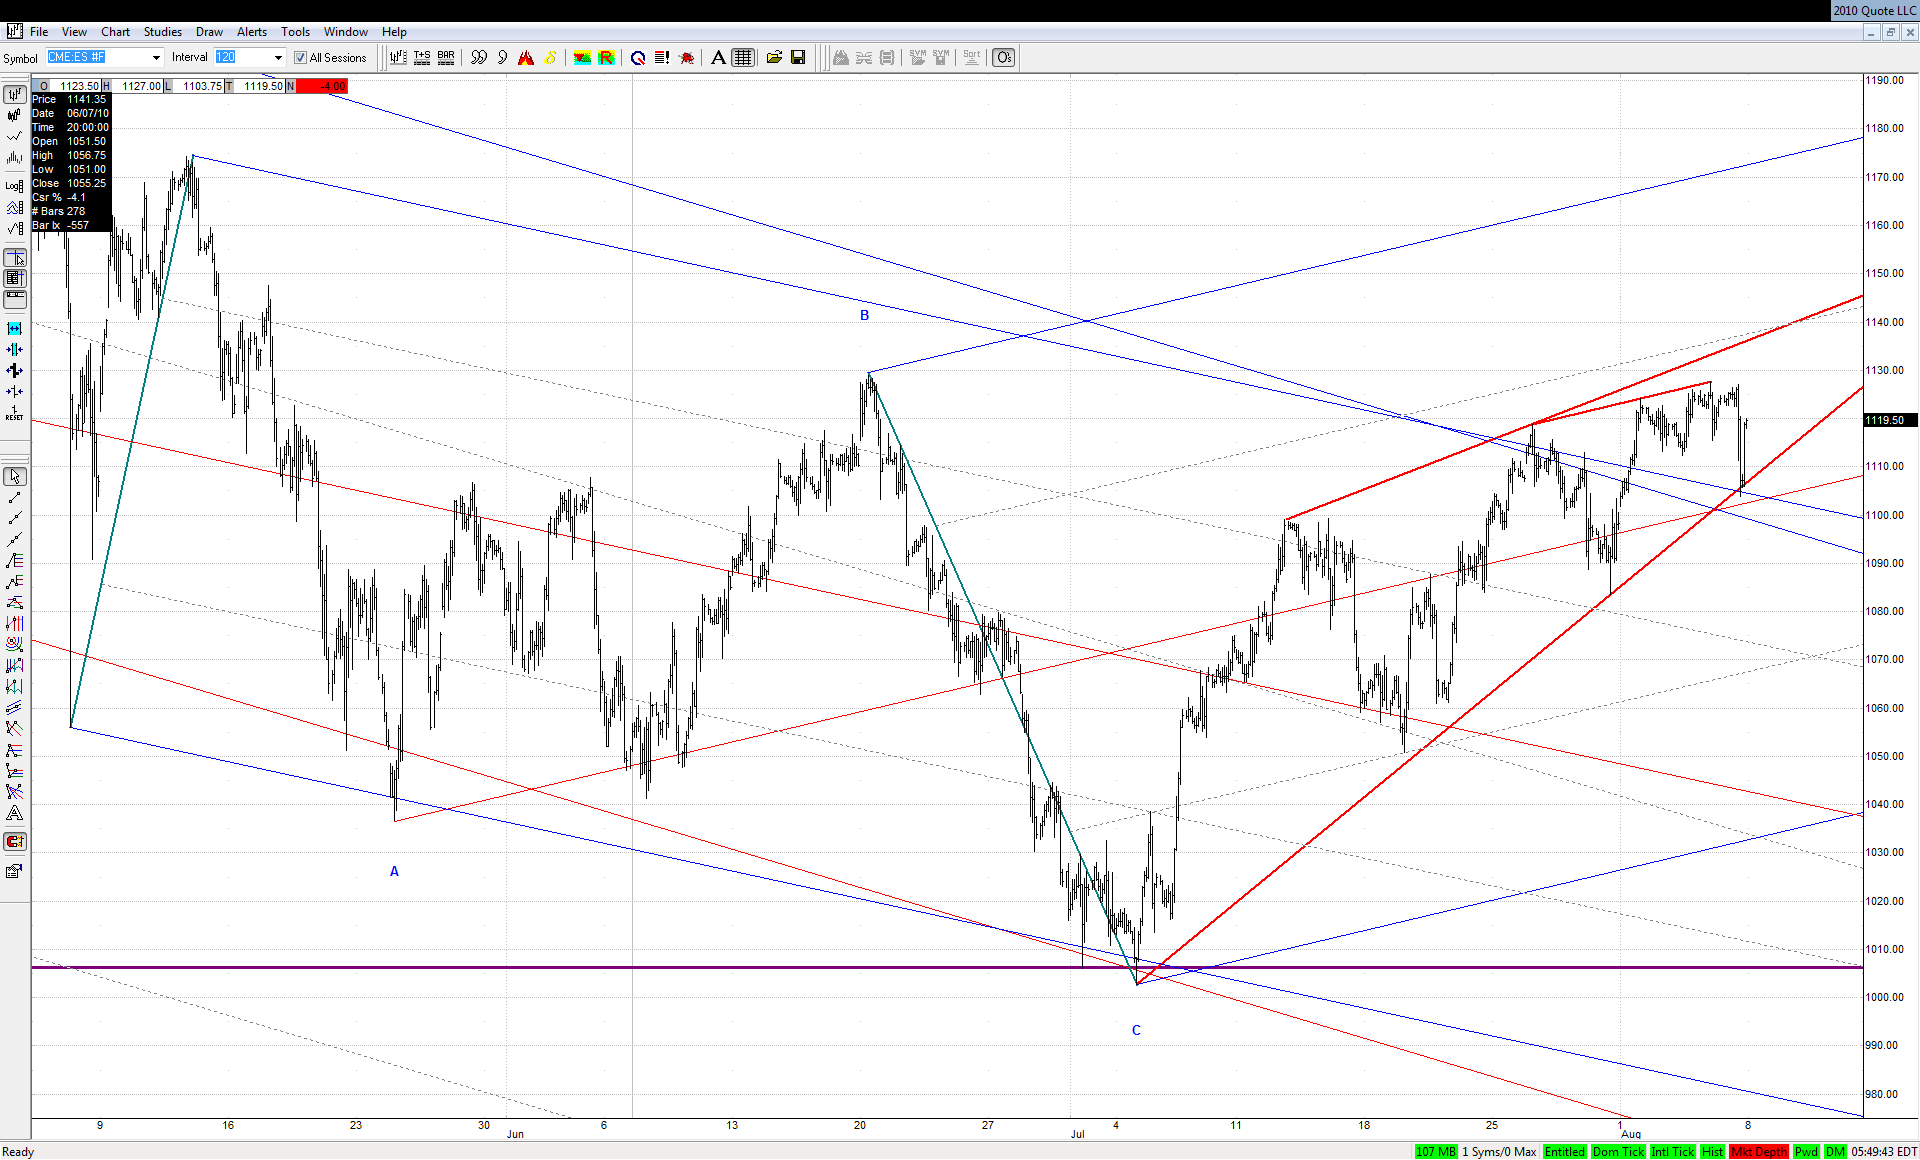
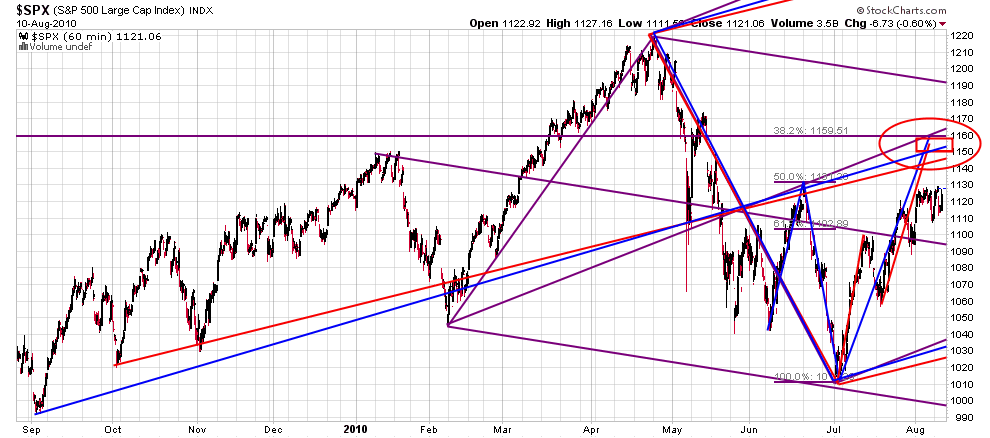
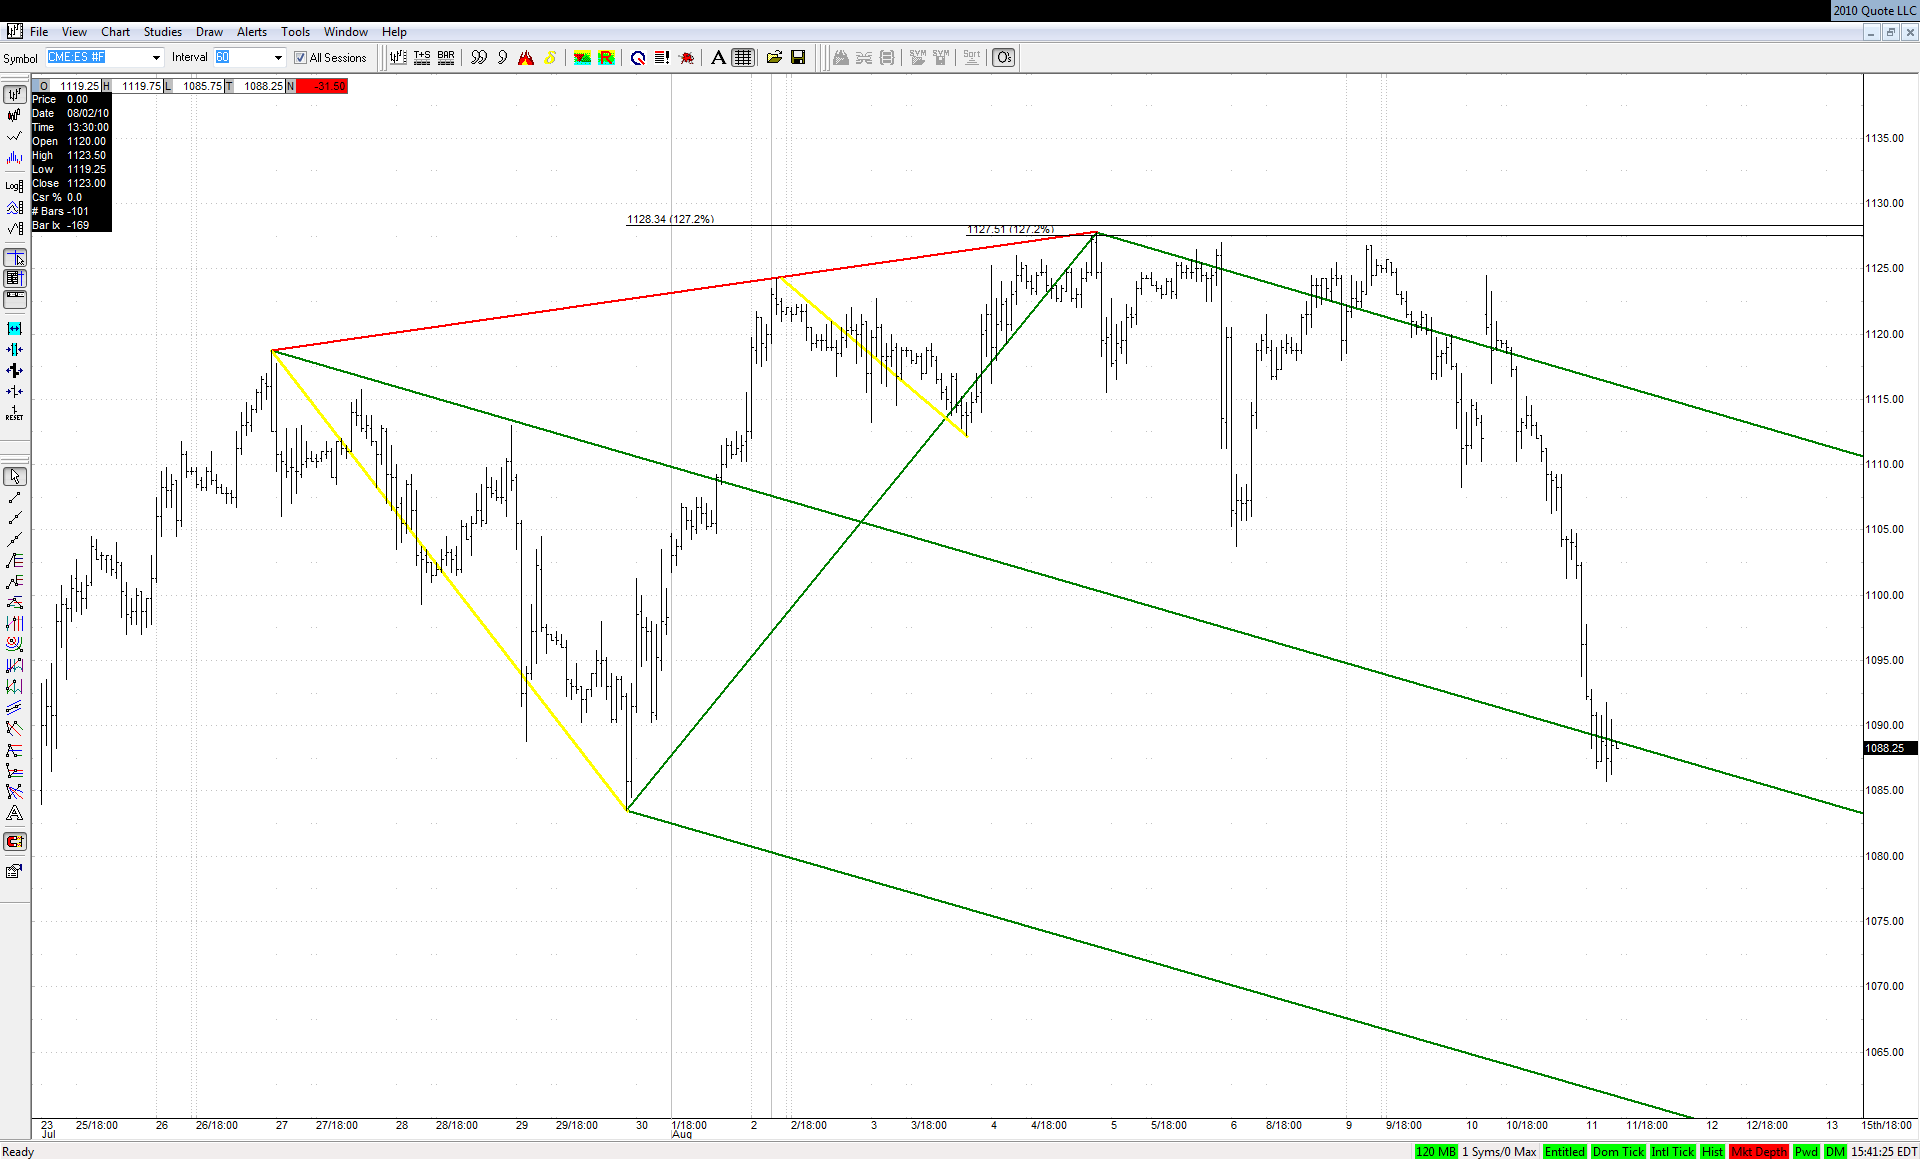
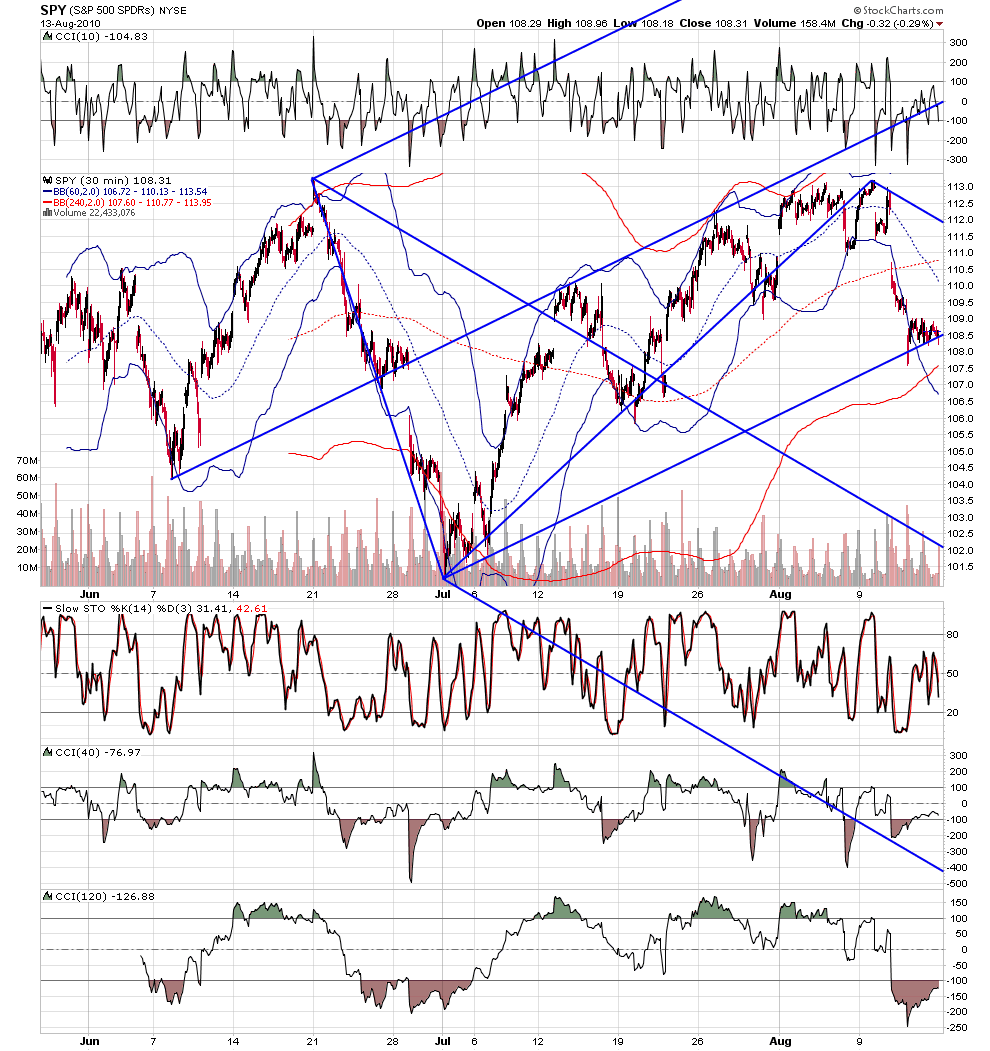
Looks like Friday's low was well justified geometrically:
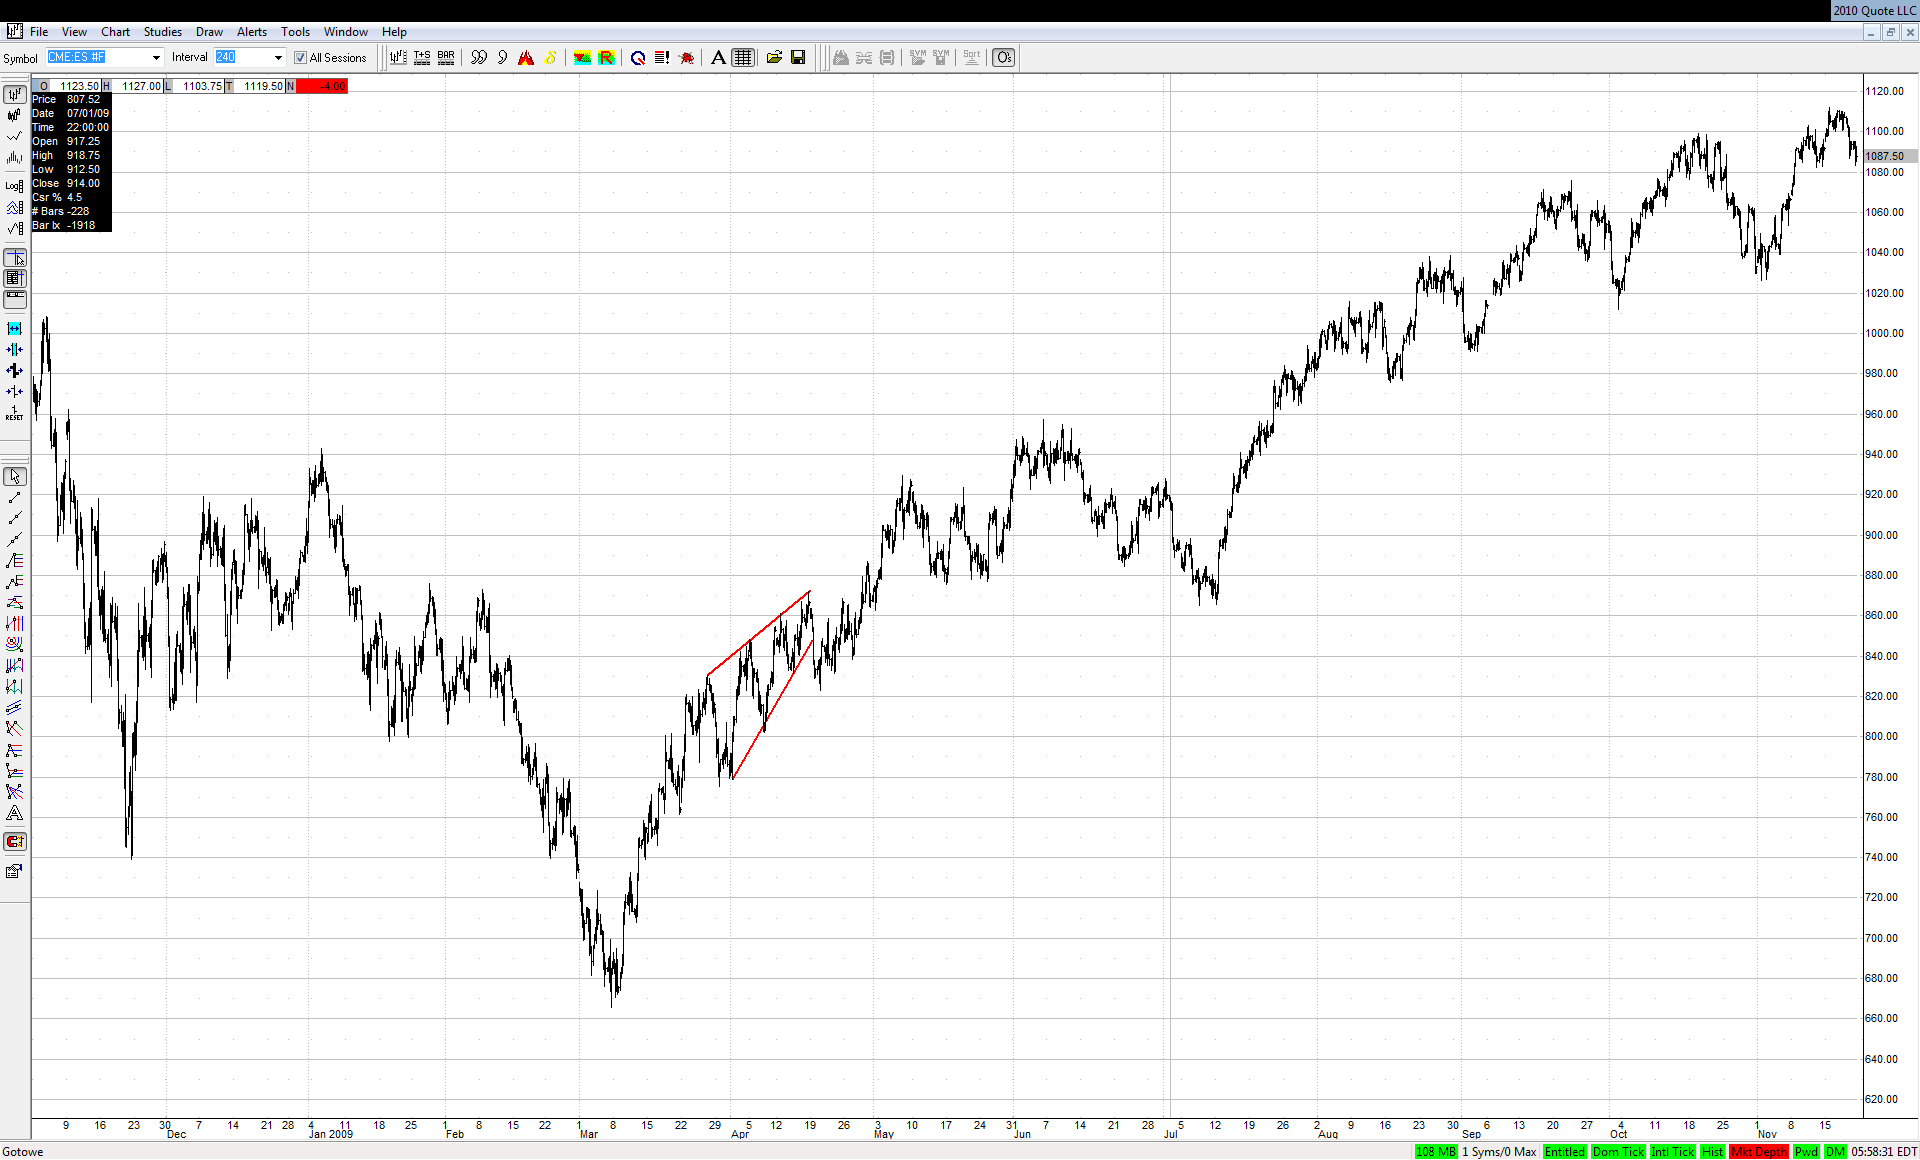
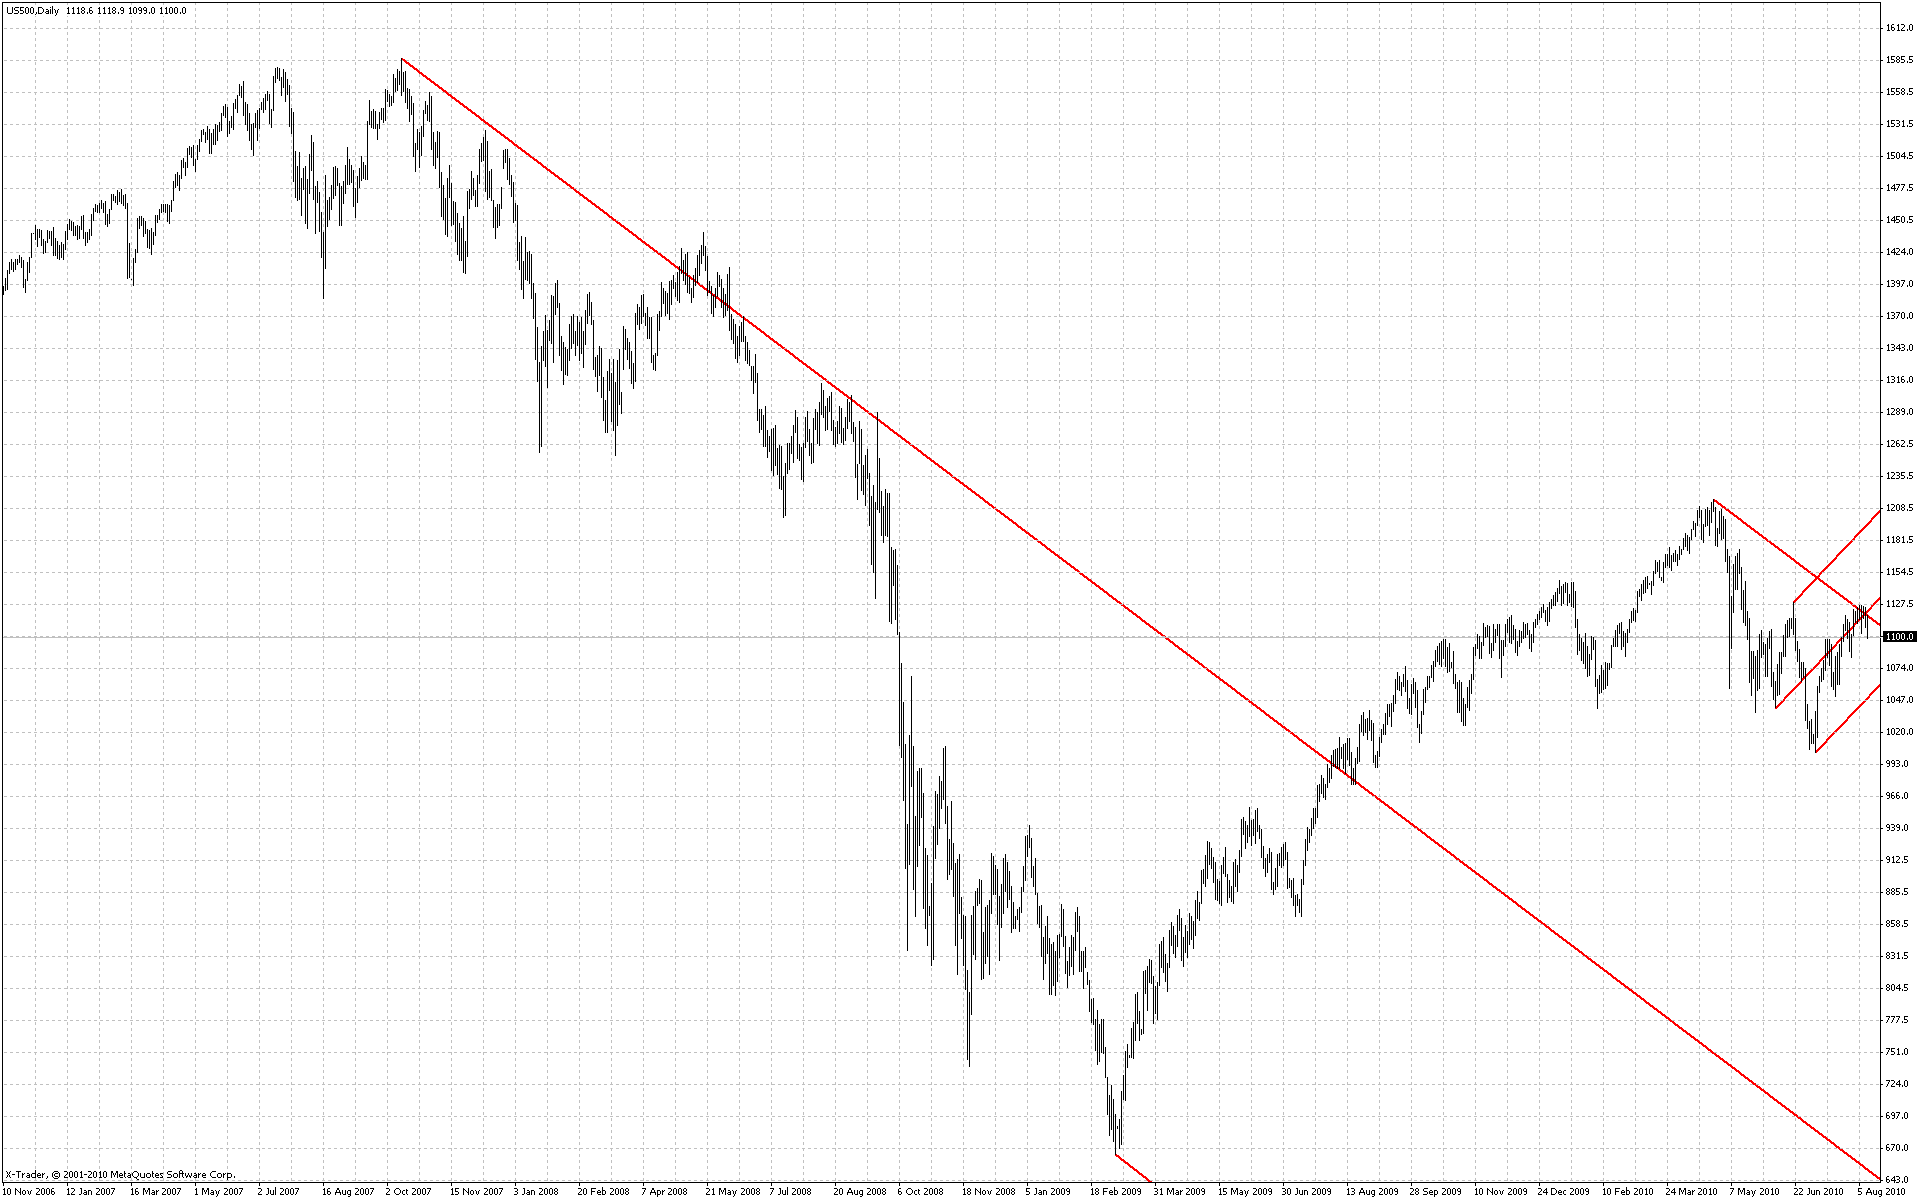
Roofer's The Trade setup shown here on Friday hasn't play out yet. If it fails despite its 90% success rate, I would expect a strong move up, since when great setups fail they usually fail badly. The whole investment world is watching this developing wegde which is bears really last hope. It reminds me of a similar wedge in April 09 when the bearishness was at least as high as it is now. We all know what happened afterwards:
JA
jarek
Rep: 94
Posts: 3,474
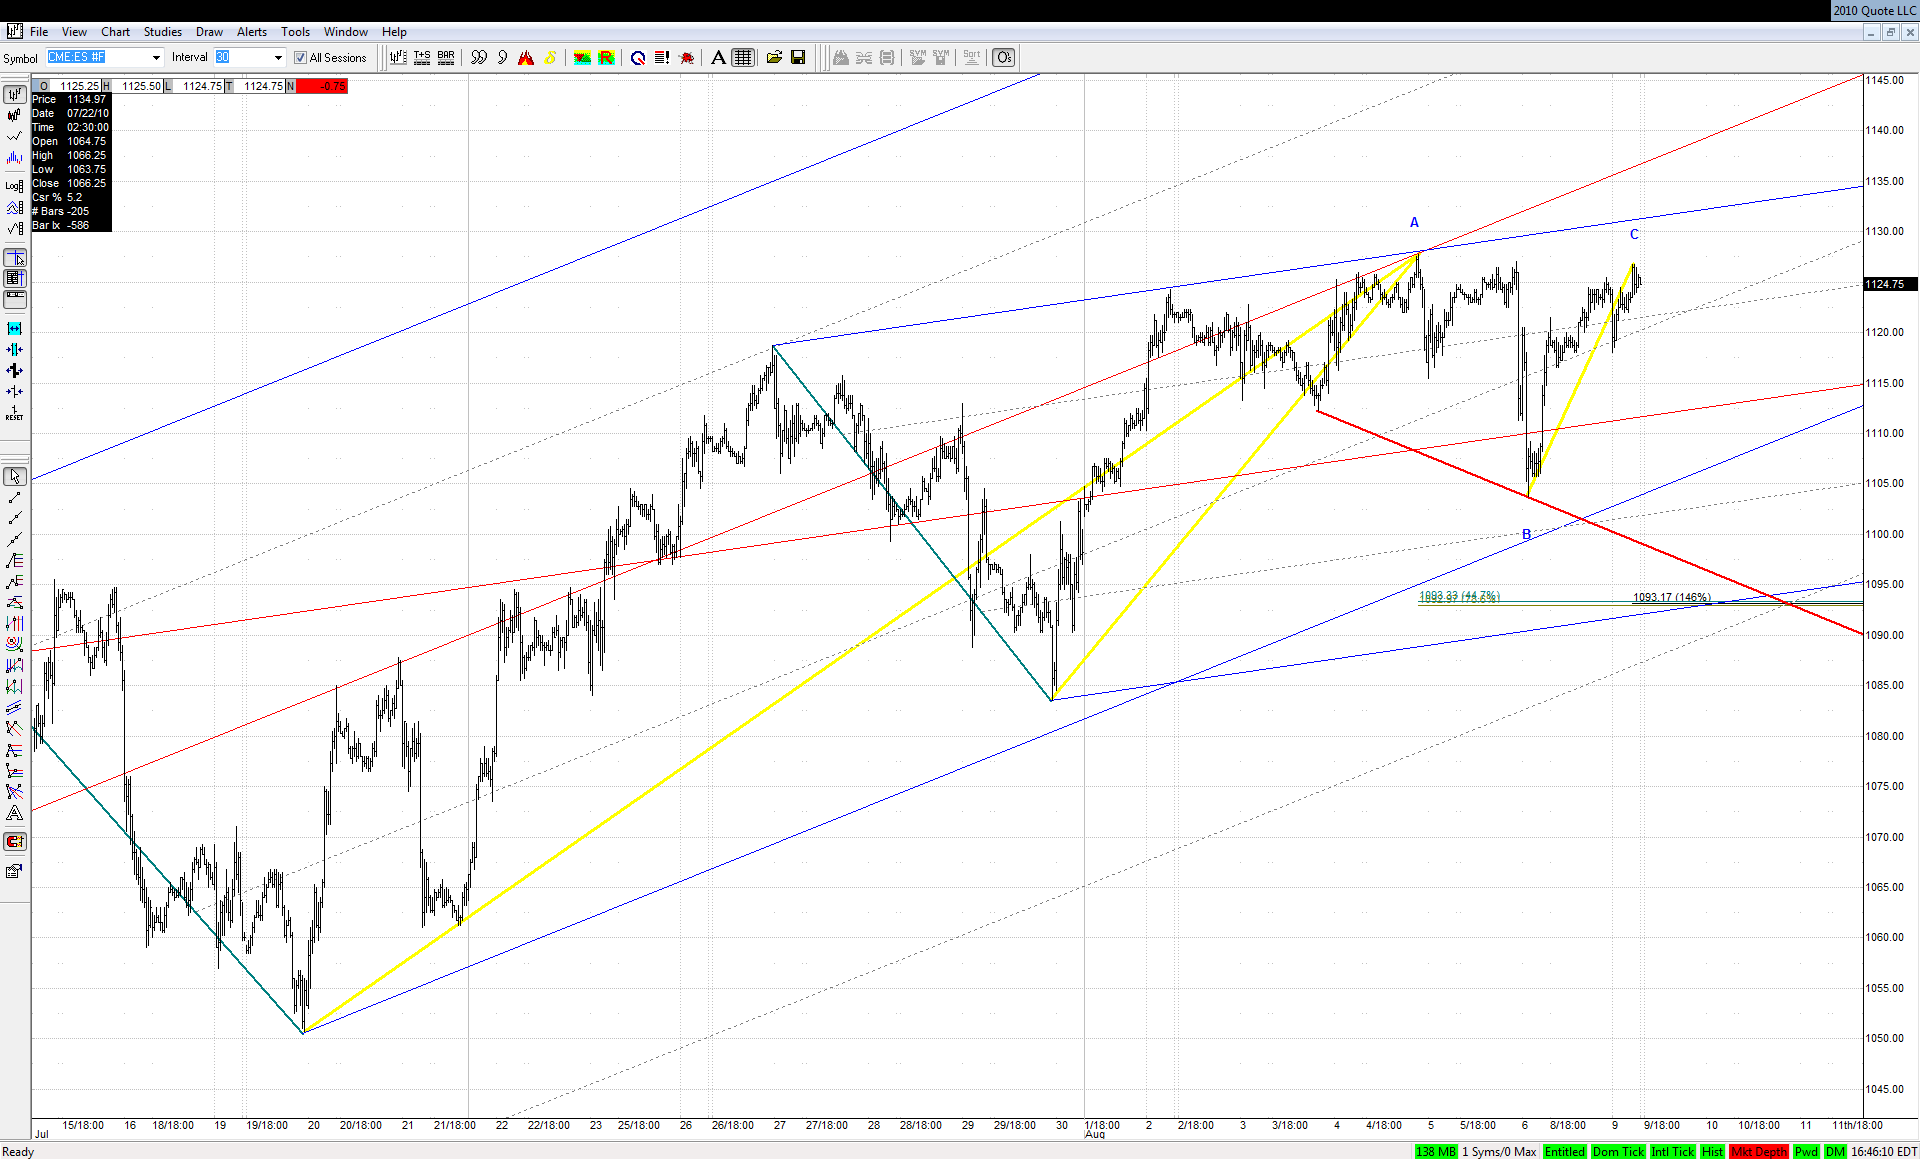
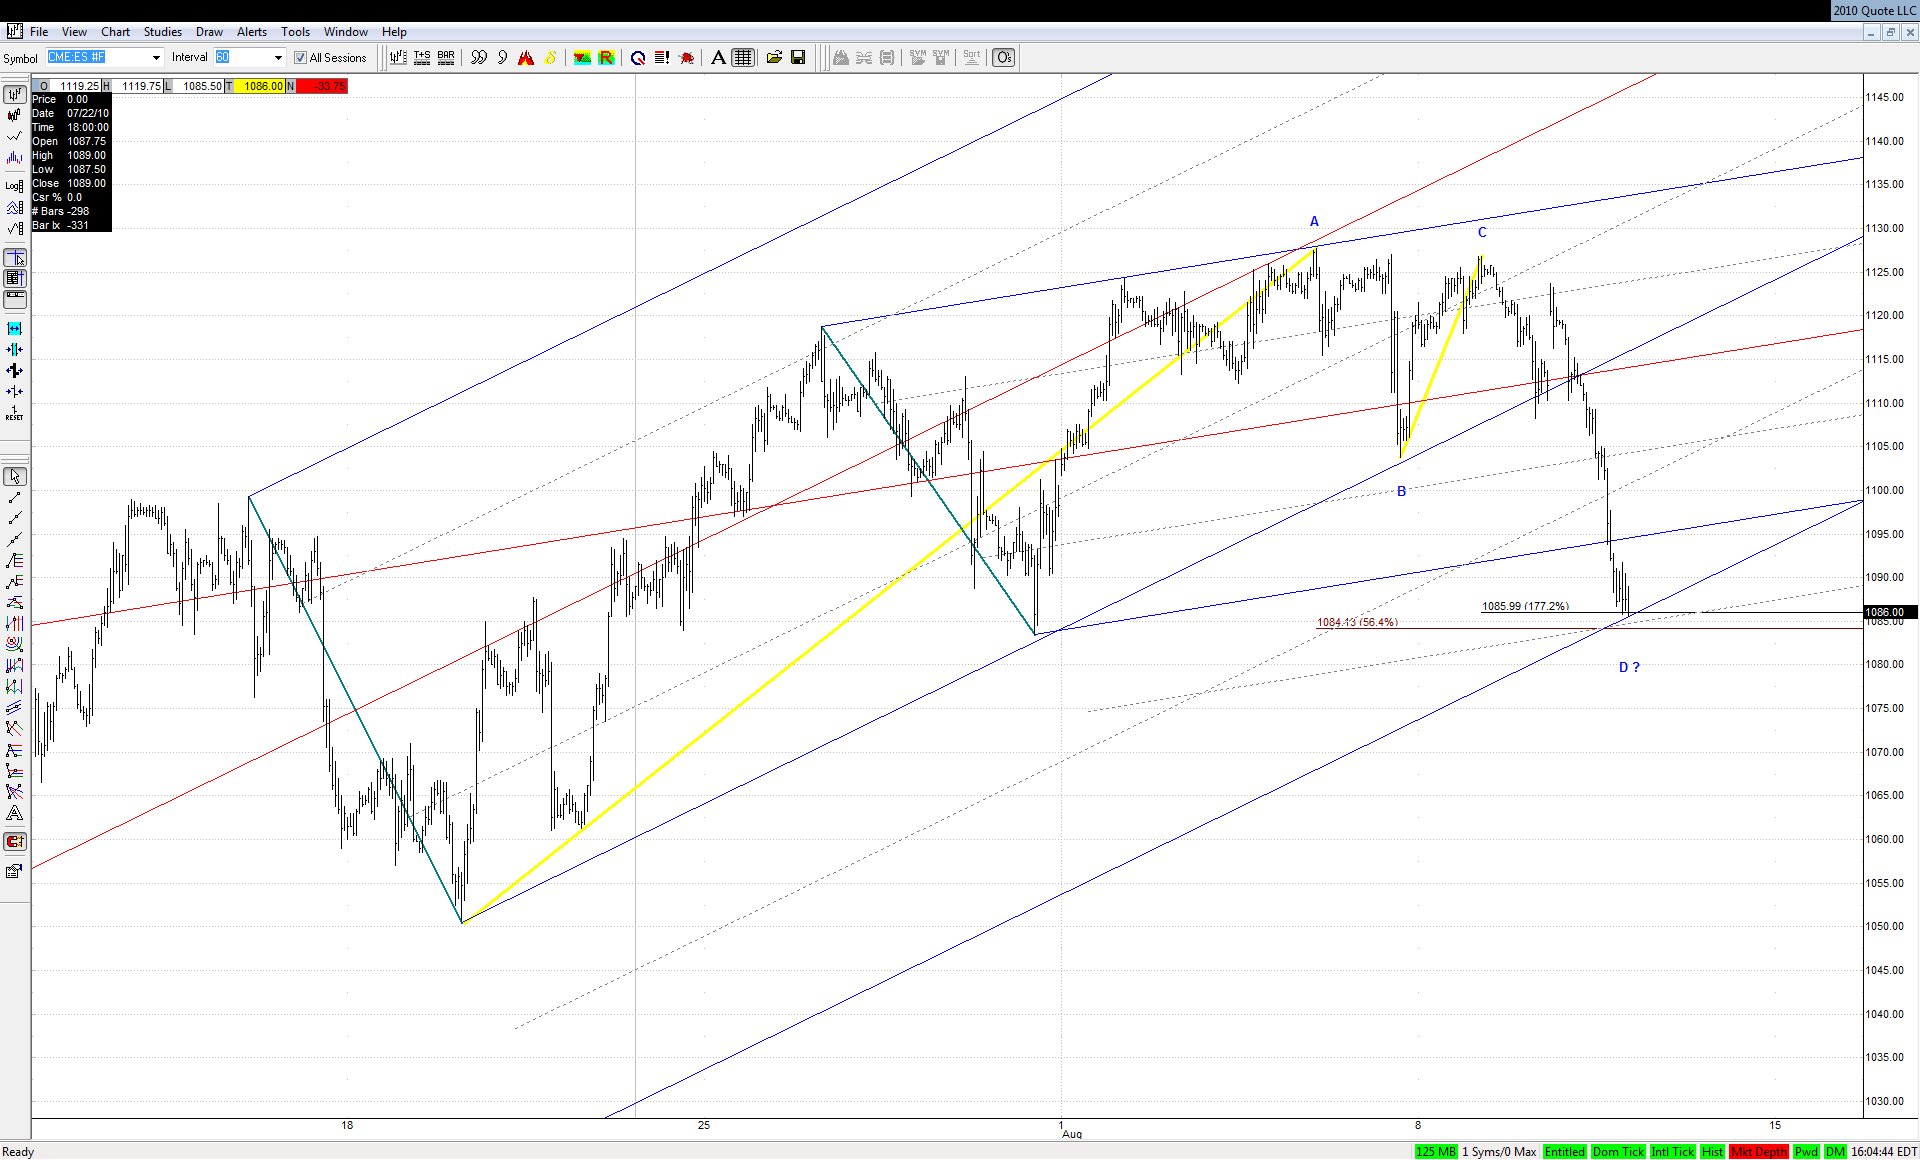
This is rather surprising that last week's high in ES was not taken out when it was so close... Either they plan to do it overnight or first they want to suck in some of the bears waiting for the start of big W3 down by forming for example the following bullish DT ABCD:
JA
jarek
Rep: 94
Posts: 3,474
Originally posted by jarek
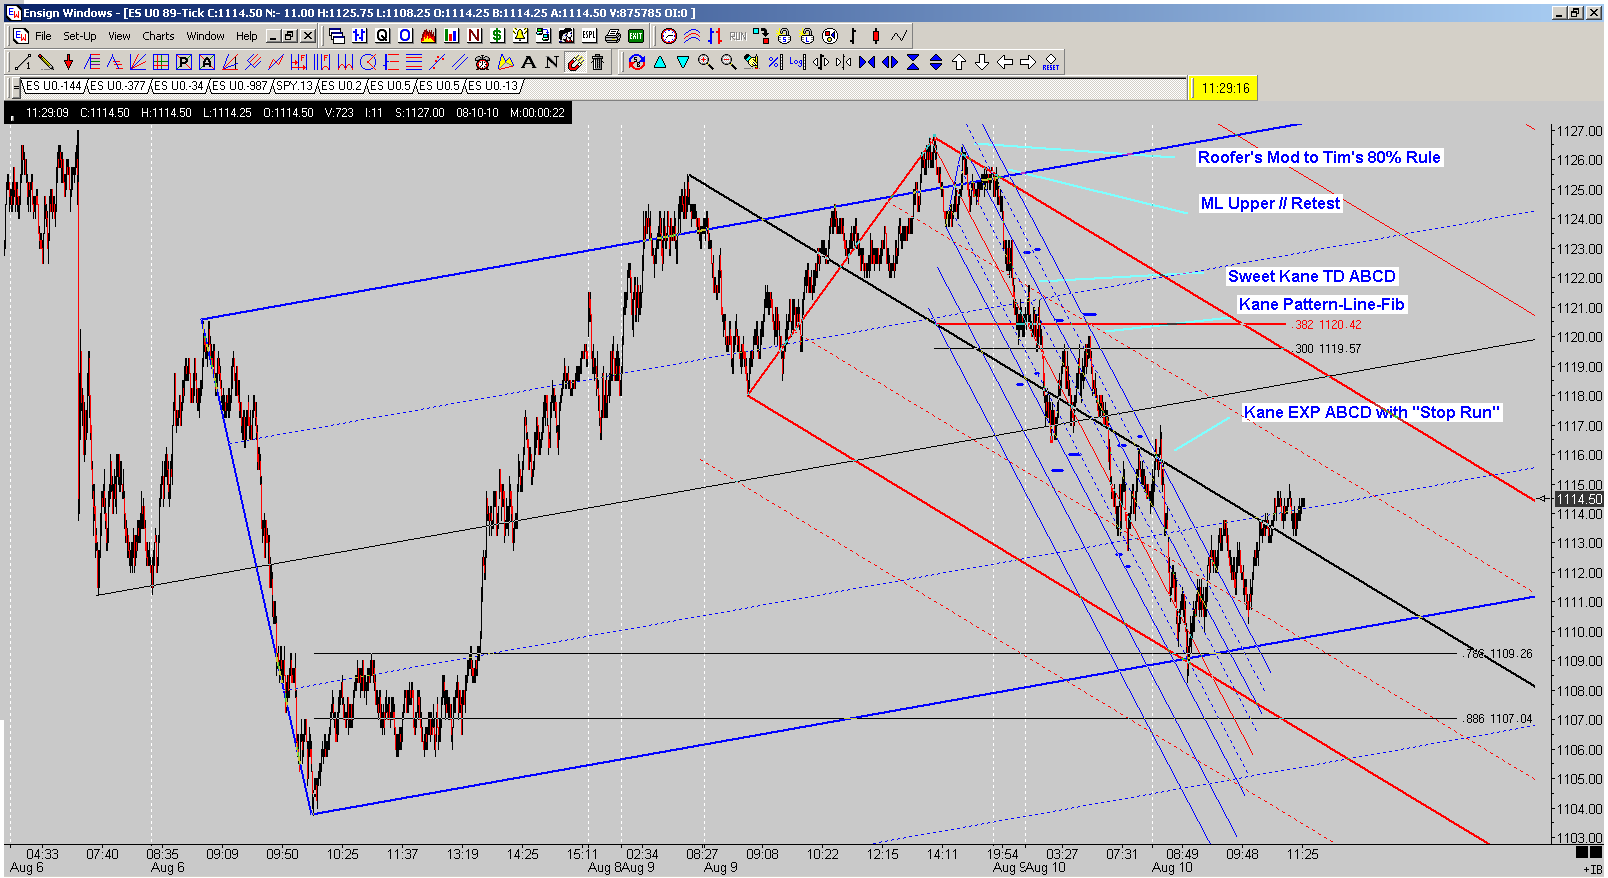
... And Roofer's DBS setup suggests that with 90% chance price will hit the downsloping ML before taking out the recent high:
I'm not sure whether it still can be deemed as successfull DBS setup, but the fact is that it hit the downsloping ML before taking out the high:
JA
jarek
Rep: 94
Posts: 3,474
Few posts above I presented a concept of a bullish DT ABCD as a trap for all those waiting for a start of big W3 down. After today's selloff we may assume that a lot of them is already on board. Even more will join during eventual bounce. Wouldn't that be a great fuel for the potential rise above the recent high?
RO
roofer
Rep: 3,689
Posts: 3,574
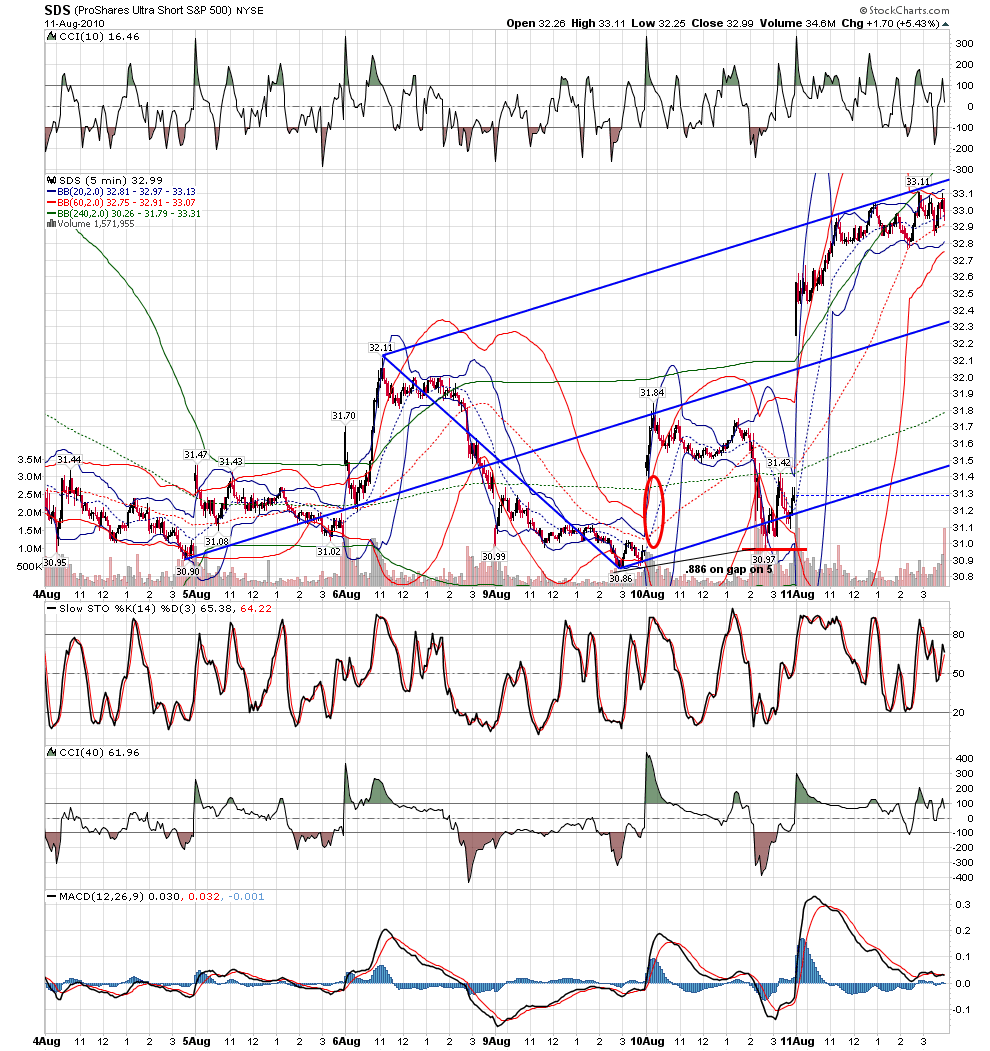
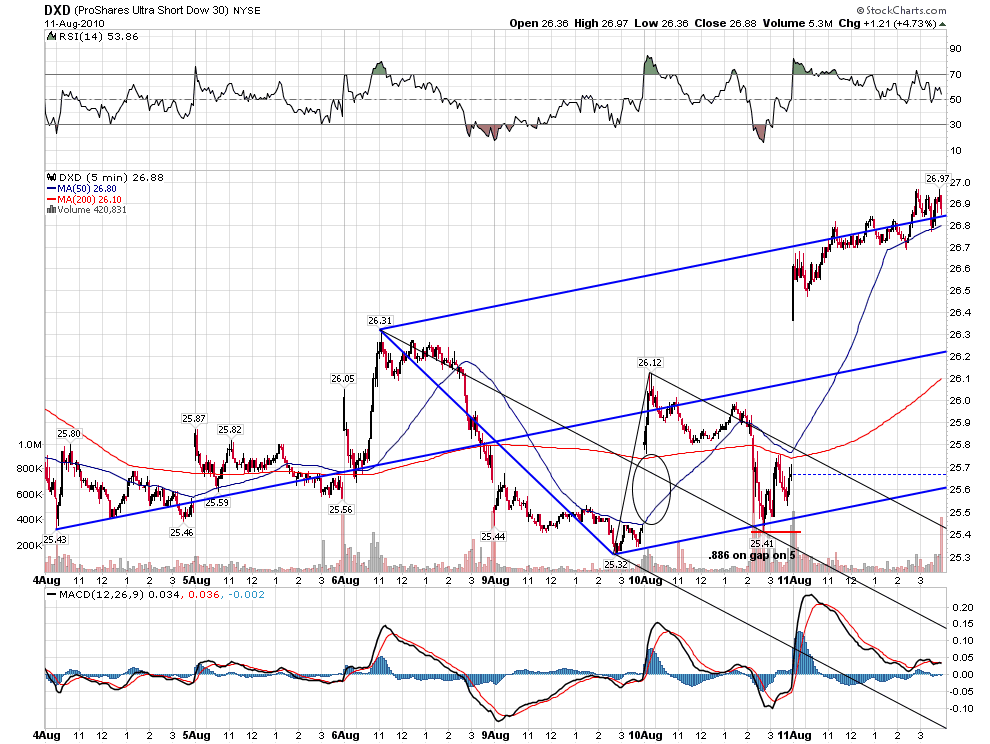
again, it matters little to the short term trader....if you have not figured out all the nuances of the .886 on gap.... keep it simple...you know the power of the x- marks the spot technique, you know the power of .886 on gap....trade their coming together.....in essence, the computers are openly chatting for all to see that they intend to honor the presence of the geometry....