ES Short Term Trading 8-13-2010
FRIDAY the 13th!
Range Based S/R
R1 = 1091.75
S1 = 1066.25
R2 = 1096
S2 = 1062
Steenbarger Pivot = 1079.25
Range Based S/R
R1 = 1091.75
S1 = 1066.25
R2 = 1096
S2 = 1062
Steenbarger Pivot = 1079.25
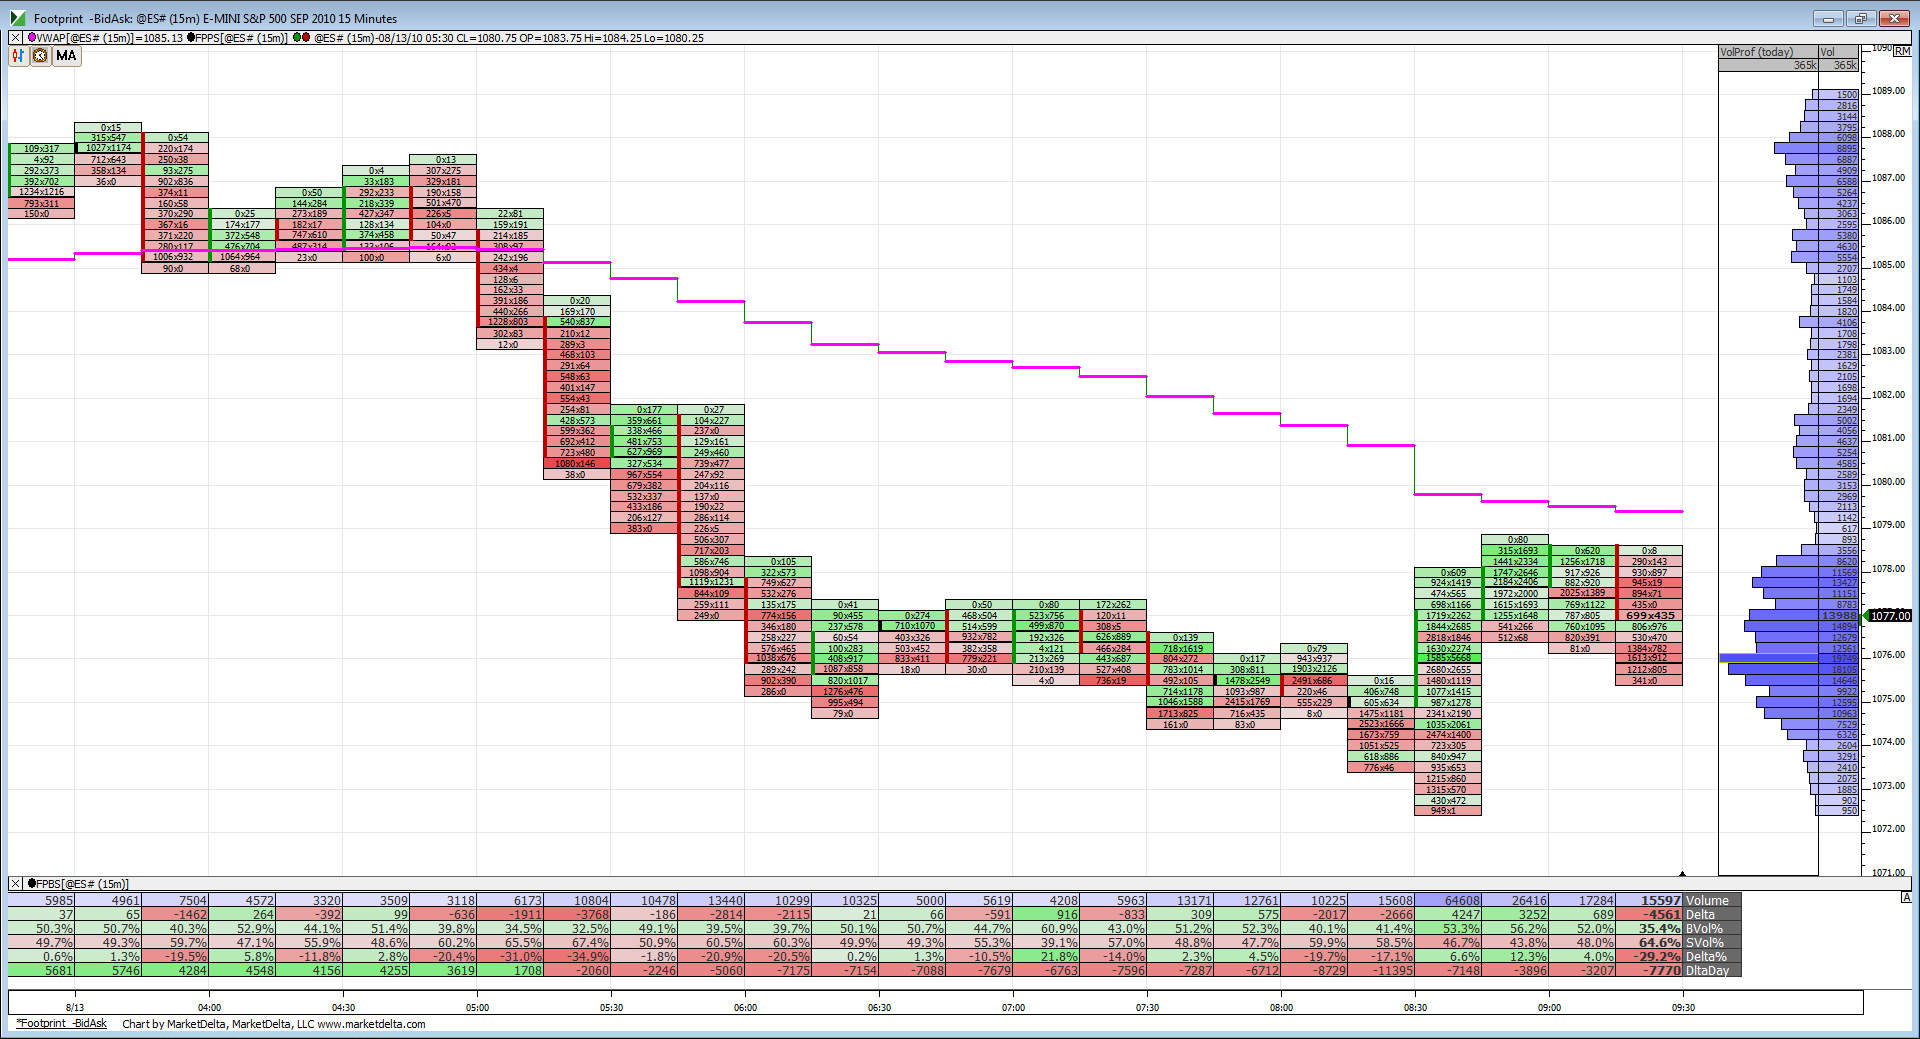
Late on these but I posted them in my response to Paul in YD thread..the volume points from YD
77.50 and 81.50 from YD trade...then the O/N high confirmed the 89 area
77.50 and 81.50 from YD trade...then the O/N high confirmed the 89 area
Now this is interesting. Big surge up but 15 min close is below VWAP. If Opening 5 minute range taken out to the downside we might see that 1066 area everyone was talking about yesterday.
Click image for original size
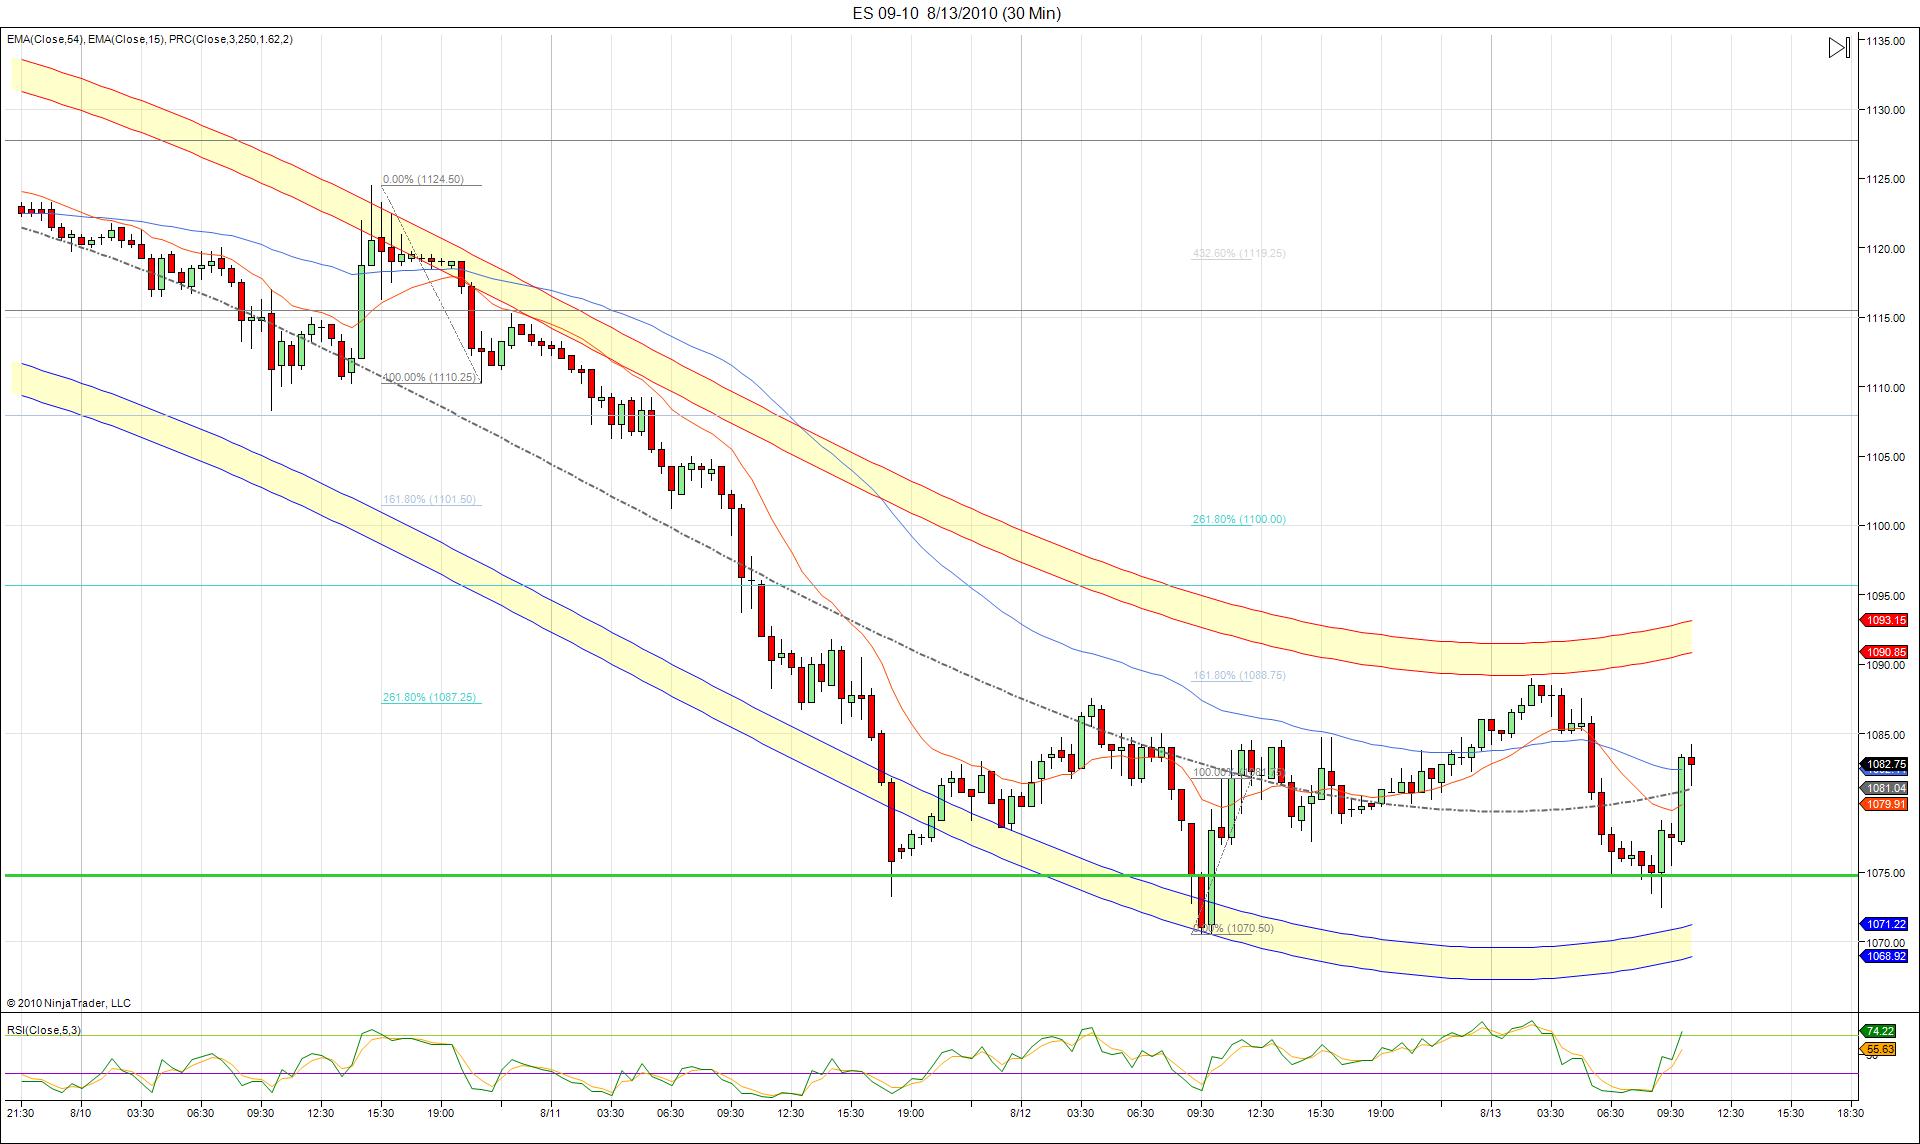
Here is a 30 min PRC chart. Notice the green line at the lows. That is the 4.326 projection off the 30 min high from 8/6. Support three times so far.
Click image for original size
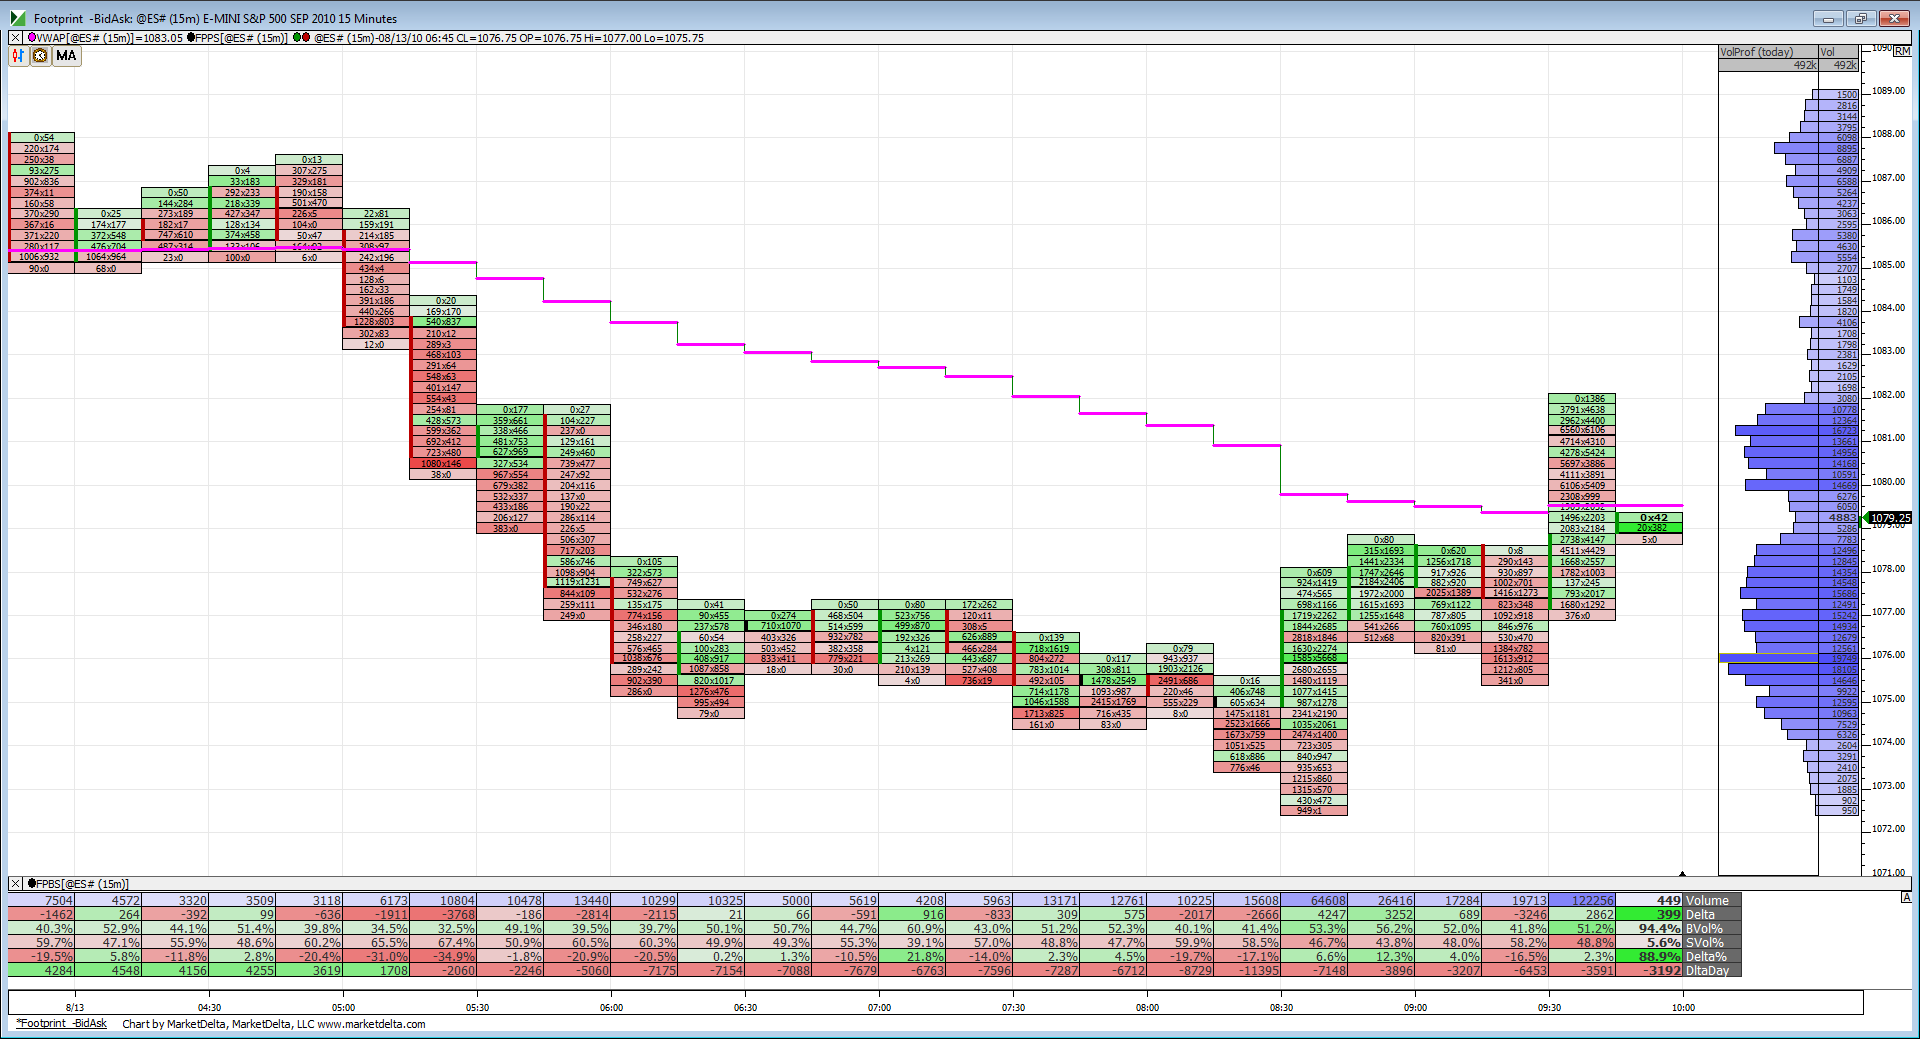
I wonder how many are waiting under the ledge from YD and that same low today..
might find out.
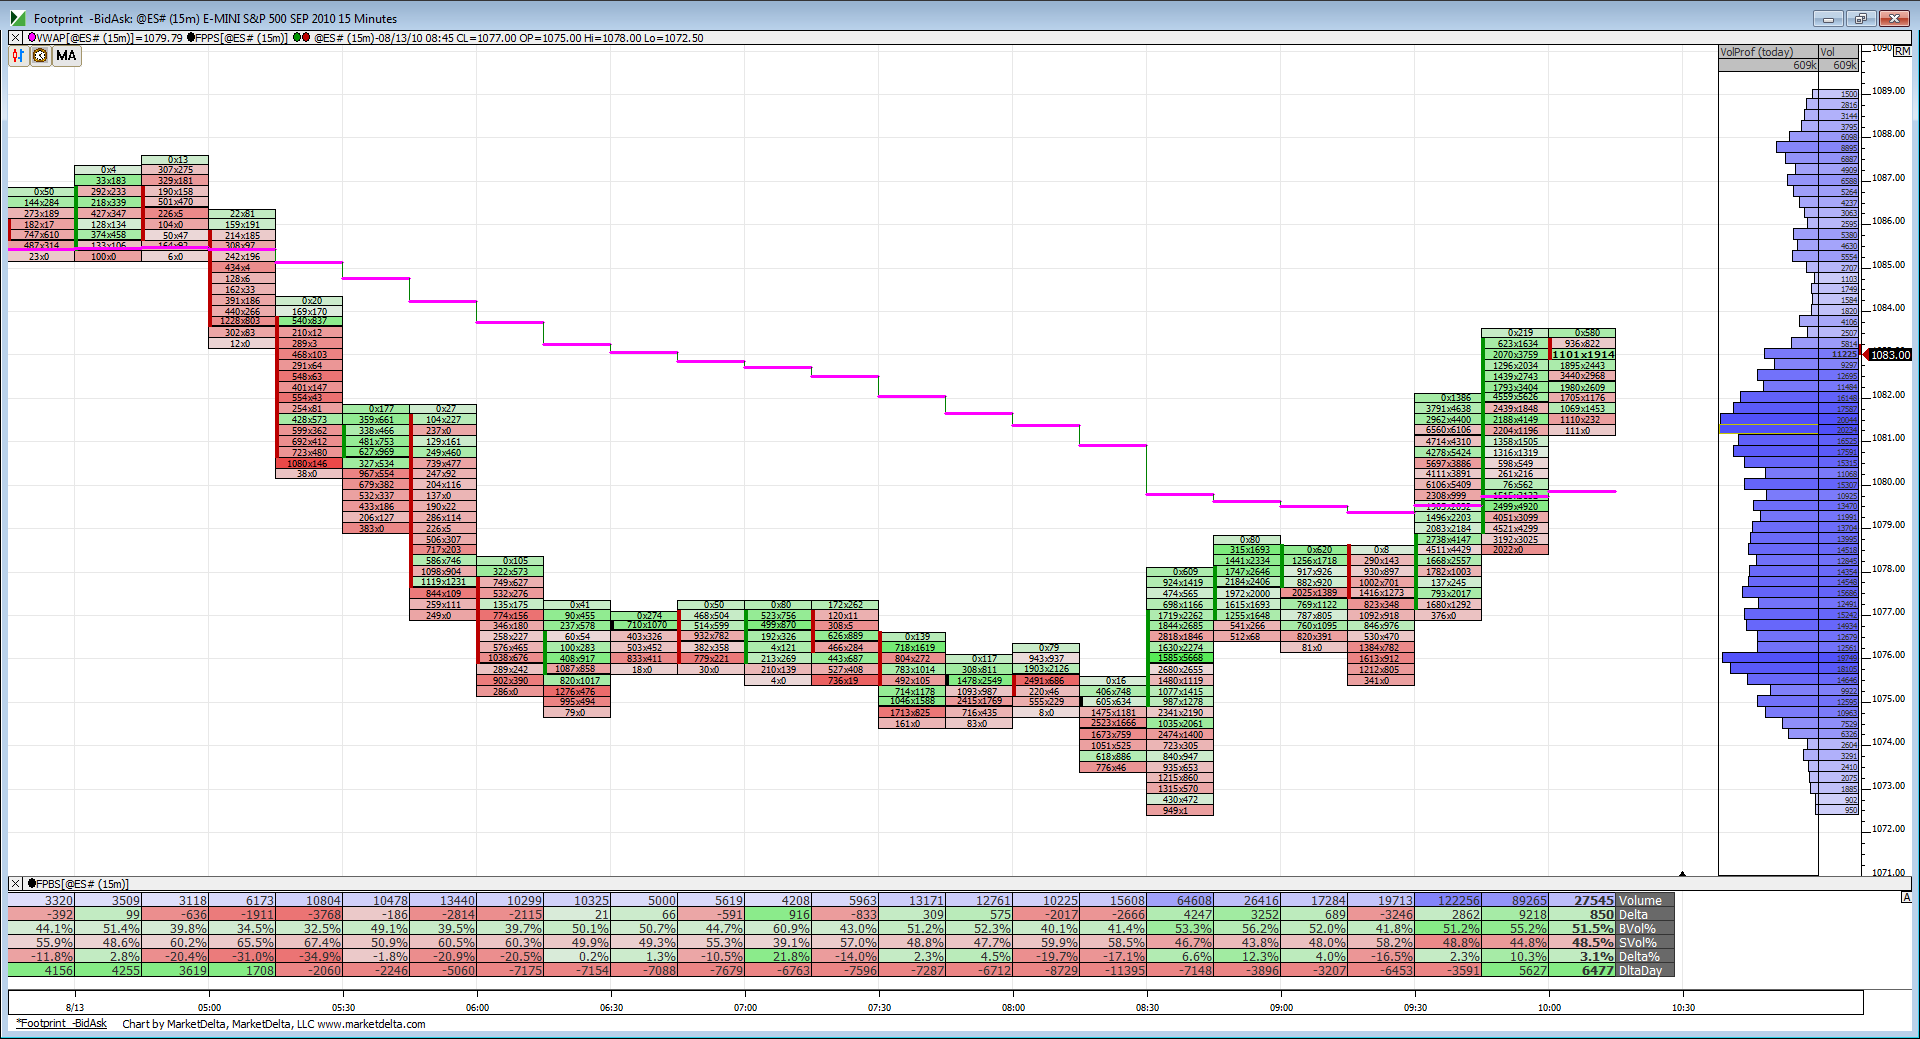
I have no handle on the markets today.
I have no handle on the markets today.
as long as we don't get another 30 minute close above 1081 then we should get that ledge run and new lows
a plus 900 Tick insoires no buying...nq trying to lead us out and down...hour range trade..leaning shorts
that close price is realy 81.50 that I'm wathcing for
that close price is realy 81.50 that I'm wathcing for
Originally posted by LornI used the 30 minute down move on 8/6 from 8:30am, immediately after the payroll news, and it produced a 261.8% projection of 1087.50;
Here is a 30 min PRC chart. Notice the green line at the lows. That is the 4.326 projection off the 30 min high from 8/6. Support three times so far.
Click image for original size
423.6% projection lower is 1064.
Some weekend reading courtesy of Dr. B.
http://traderfeed.blogspot.com/2009/12/trading-process-context.html
http://traderfeed.blogspot.com/2009/12/trading-process-context.html
The Trading Process: Context
In this series of posts, I will outline the steps I go through in the trading process. I want to stress that there are other ways of trading, and what I describe is not at all necessarily best for all traders. My hope is that this explication of process will help traders reflect on their own processes and tighten those up. I also hope that, in absorbing examples of trading from many writers, traders can more readily find their own synthesis and style.
The first step in trading for me is identifying what we might call context. Context refers to all the factors surrounding the upcoming day's trade. That includes whether the prior day was stronger or weaker than the day(s) before, whether we're trading in a short-term range or trending, whether markets correlated to stocks are in a trending or range mode, and whether volatility is expanding, contracting, or remaining relatively constant. Context also includes news items and economic releases and how markets have responded to those in recent days and in pre-opening trade. Finally, context also includes intermarket themes and leading sectors that have impacted the stock market and whether those correlations have been waxing or waning.
I recently posted a collection of posts illustrating the market indicators that I follow; each week, I also post an update of some of the indicators that are most important to my assessment of context. Through morning Twitter posts (follow here), I keep current on several of those important indicators. By assessing the number of stocks making fresh 20-day highs and lows; the number of stocks trading above their 20-day moving averages; and the number of stocks closing above and below the volatility envelopes surrounding their short-term moving averages, I can generally get a sense for whether the market is in trend or range mode.
Unless news items and/or economic releases greatly change the financial landscape, I'll use the most recent market context to frame my early hypotheses about markets. If we're showing increasing strength, I'll expect this week's trade to take out the prior week's high and today's trade to take out the prior day's high. If the market is stalling out across the indicators, I'll expect moves away from the recent value area to fail and return back toward the middle of the range. Note that these are just tentative ideas at this point, not firm trading plans.
A great deal of context can be picked up from Asian and European markets and their trading prior to the U.S. open. Overseas trade gives us clues as to risk appetite or risk aversion of global investors. It also reveals how markets correlated to stocks--currencies, commodities, and interest rates--are trading prior to the market open.
A good deal of my morning preparation is spent gathering information about the most recent market context. To frame a promising trade idea, much more data are needed. The next post in this series will take a look at that.
Emini Day Trading /
Daily Notes /
Forecast /
Economic Events /
Search /
Terms and Conditions /
Disclaimer /
Books /
Online Books /
Site Map /
Contact /
Privacy Policy /
Links /
About /
Day Trading Forum /
Investment Calculators /
Pivot Point Calculator /
Market Profile Generator /
Fibonacci Calculator /
Mailing List /
Advertise Here /
Articles /
Financial Terms /
Brokers /
Software /
Holidays /
Stock Split Calendar /
Mortgage Calculator /
Donate
Copyright © 2004-2023, MyPivots. All rights reserved.
Copyright © 2004-2023, MyPivots. All rights reserved.