ES short term trading 9-7-10
Two key zones up top into resistance now:
1106.75 - 1110.50
and
1115.50 - 1118.50 ******
Bias is once again to the downside.
key support will be 1098.75 - 1101.75 on Monday. Below there is
90 - 93
83.75 - 85
76 - 77 *****
4 days of a rally and friday creates the "P" profile. I think this trend up is tired
1106.75 - 1110.50
and
1115.50 - 1118.50 ******
Bias is once again to the downside.
key support will be 1098.75 - 1101.75 on Monday. Below there is
90 - 93
83.75 - 85
76 - 77 *****
4 days of a rally and friday creates the "P" profile. I think this trend up is tired
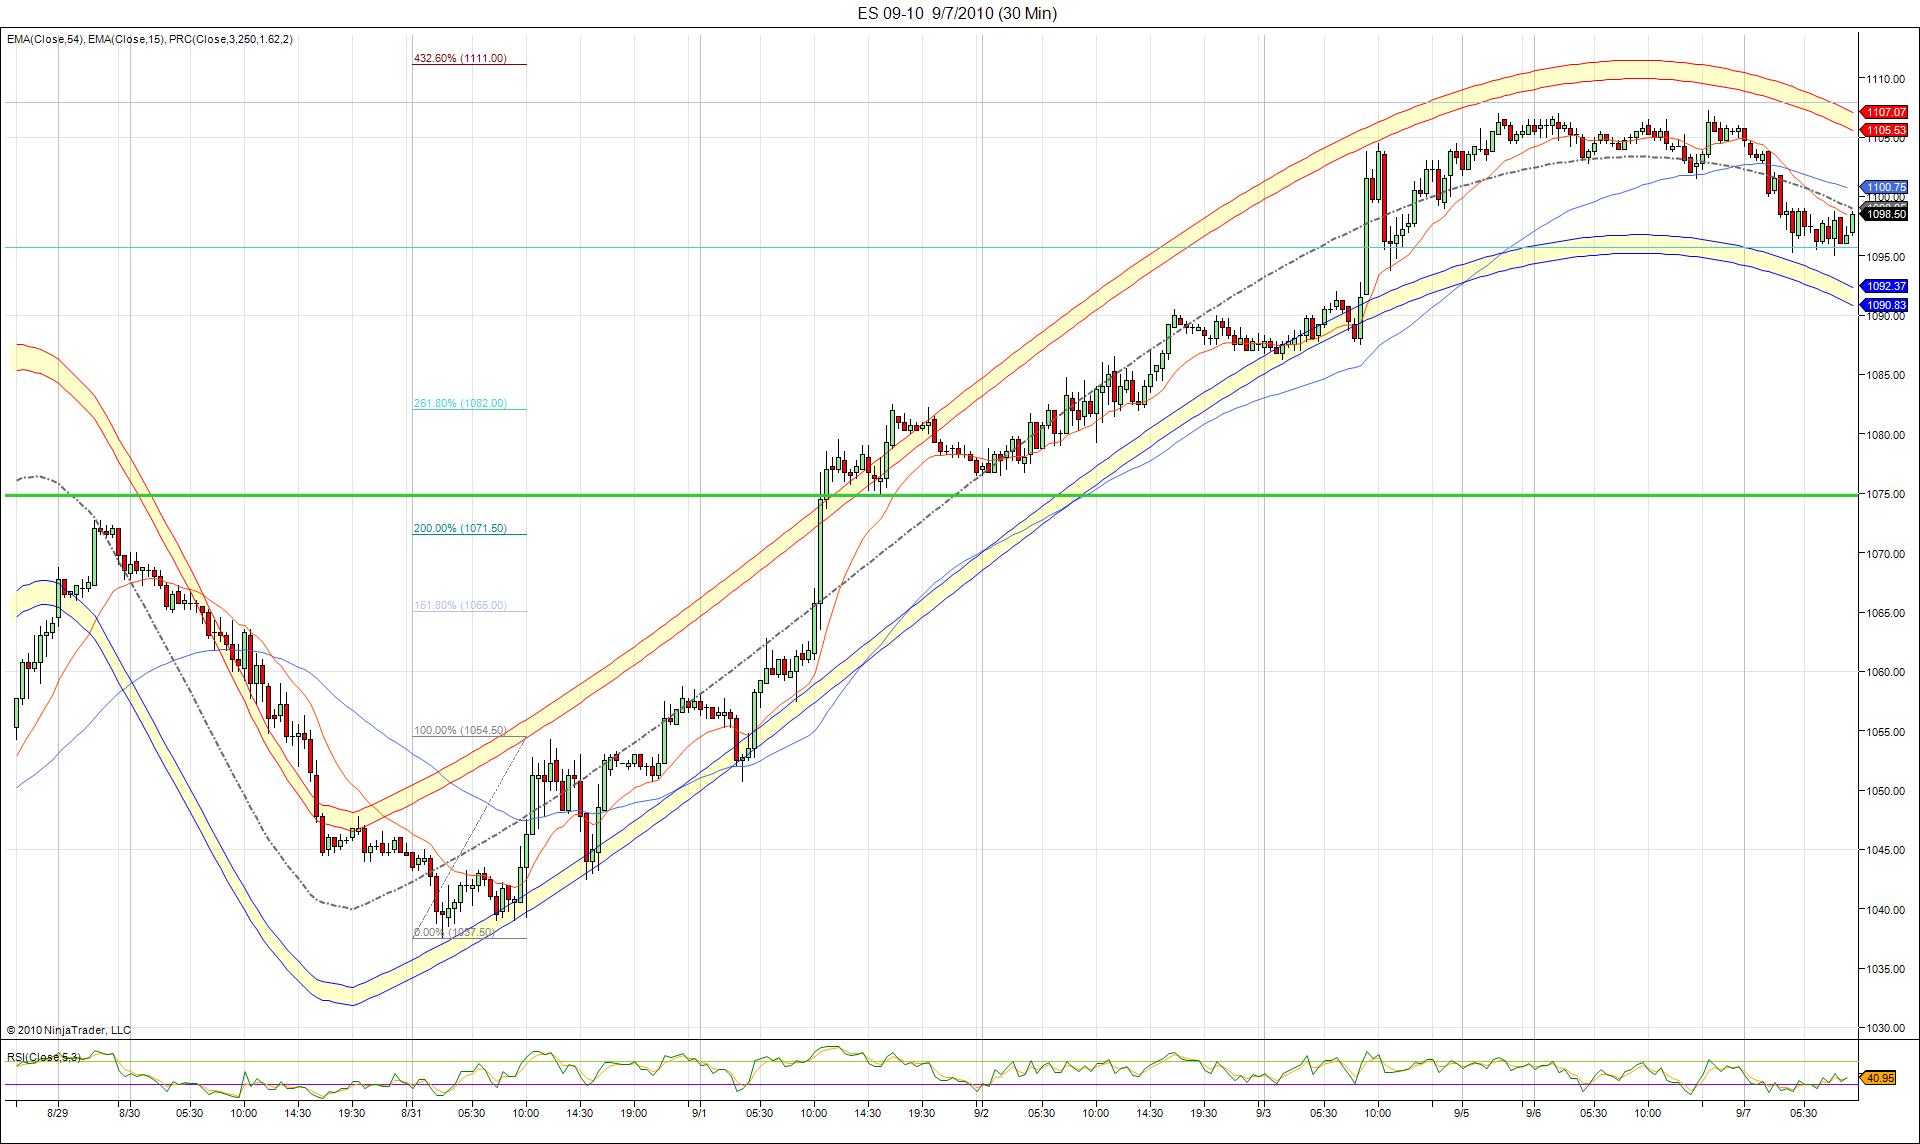
as per O/N session , I'm using 97.50*****, 1101.75 and 1106.50...watching the range of O/N carefulyy today...prefer to buy in early trade then watch for buying to dry up at higher prices...that is IDEAL scenario...we'll soon see
Interesting that the PRC Bands have hooked down but that final 4.326 projection wasn't reached. Back to work for everyone this week.
Click image for original size
we can't expect too much today given that we opend in Fridays range and are trading both sides of the open...still bias to upside early on but not looking for any home runs today unless we get out of O/N range and Fridays range.......consolidation due as market looks for a stopping price after trending for a few days ...so playing for consolidation in general...no reports to motivate anyone
On 93 longs...air above....cautious in case they fake me....90 - 93 is critical here
still cautious...ES trying to lead down
took 2 off at 94.50 print.....due to O/N low and just more cautious today..they may need to test down again...air still above for 2 runners
1092.25 Short: big resistance here. Stop 1093.5 . Target 1 1090.25. Target 2 1090.75
Target 1 1090.75 hit. Stop to break even at 1092.25
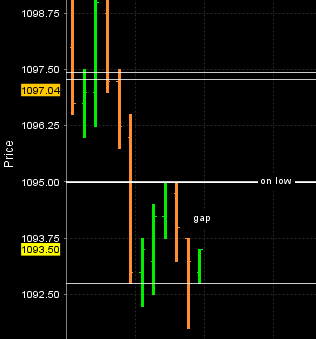
Gets stoped on runners on BE. Looking at new short near 1092.75 - 1093: There resistance along with droping 20 EMA on 5 min chart. PSAR on 5 min also at 1093. so pop and stall to this area is short for me. This is also area where lots of folks get traped going long.
Here is a visual on this trade...you can see the gap in the data and the air pocket above...so that gives me at least two reasons to buy into the decline...if we add in the Nq/Tick divergence ( not shown) and the fact that 90 - 93 was a key zone then it wasn't so risky.
Didn't trade after this one today...luckily..!
Didn't trade after this one today...luckily..!
Originally posted by BruceM
starting new longs at 92 even...gap in data above but still high risk...tick and NQ diverge
Click image for original size
Emini Day Trading /
Daily Notes /
Forecast /
Economic Events /
Search /
Terms and Conditions /
Disclaimer /
Books /
Online Books /
Site Map /
Contact /
Privacy Policy /
Links /
About /
Day Trading Forum /
Investment Calculators /
Pivot Point Calculator /
Market Profile Generator /
Fibonacci Calculator /
Mailing List /
Advertise Here /
Articles /
Financial Terms /
Brokers /
Software /
Holidays /
Stock Split Calendar /
Mortgage Calculator /
Donate
Copyright © 2004-2023, MyPivots. All rights reserved.
Copyright © 2004-2023, MyPivots. All rights reserved.