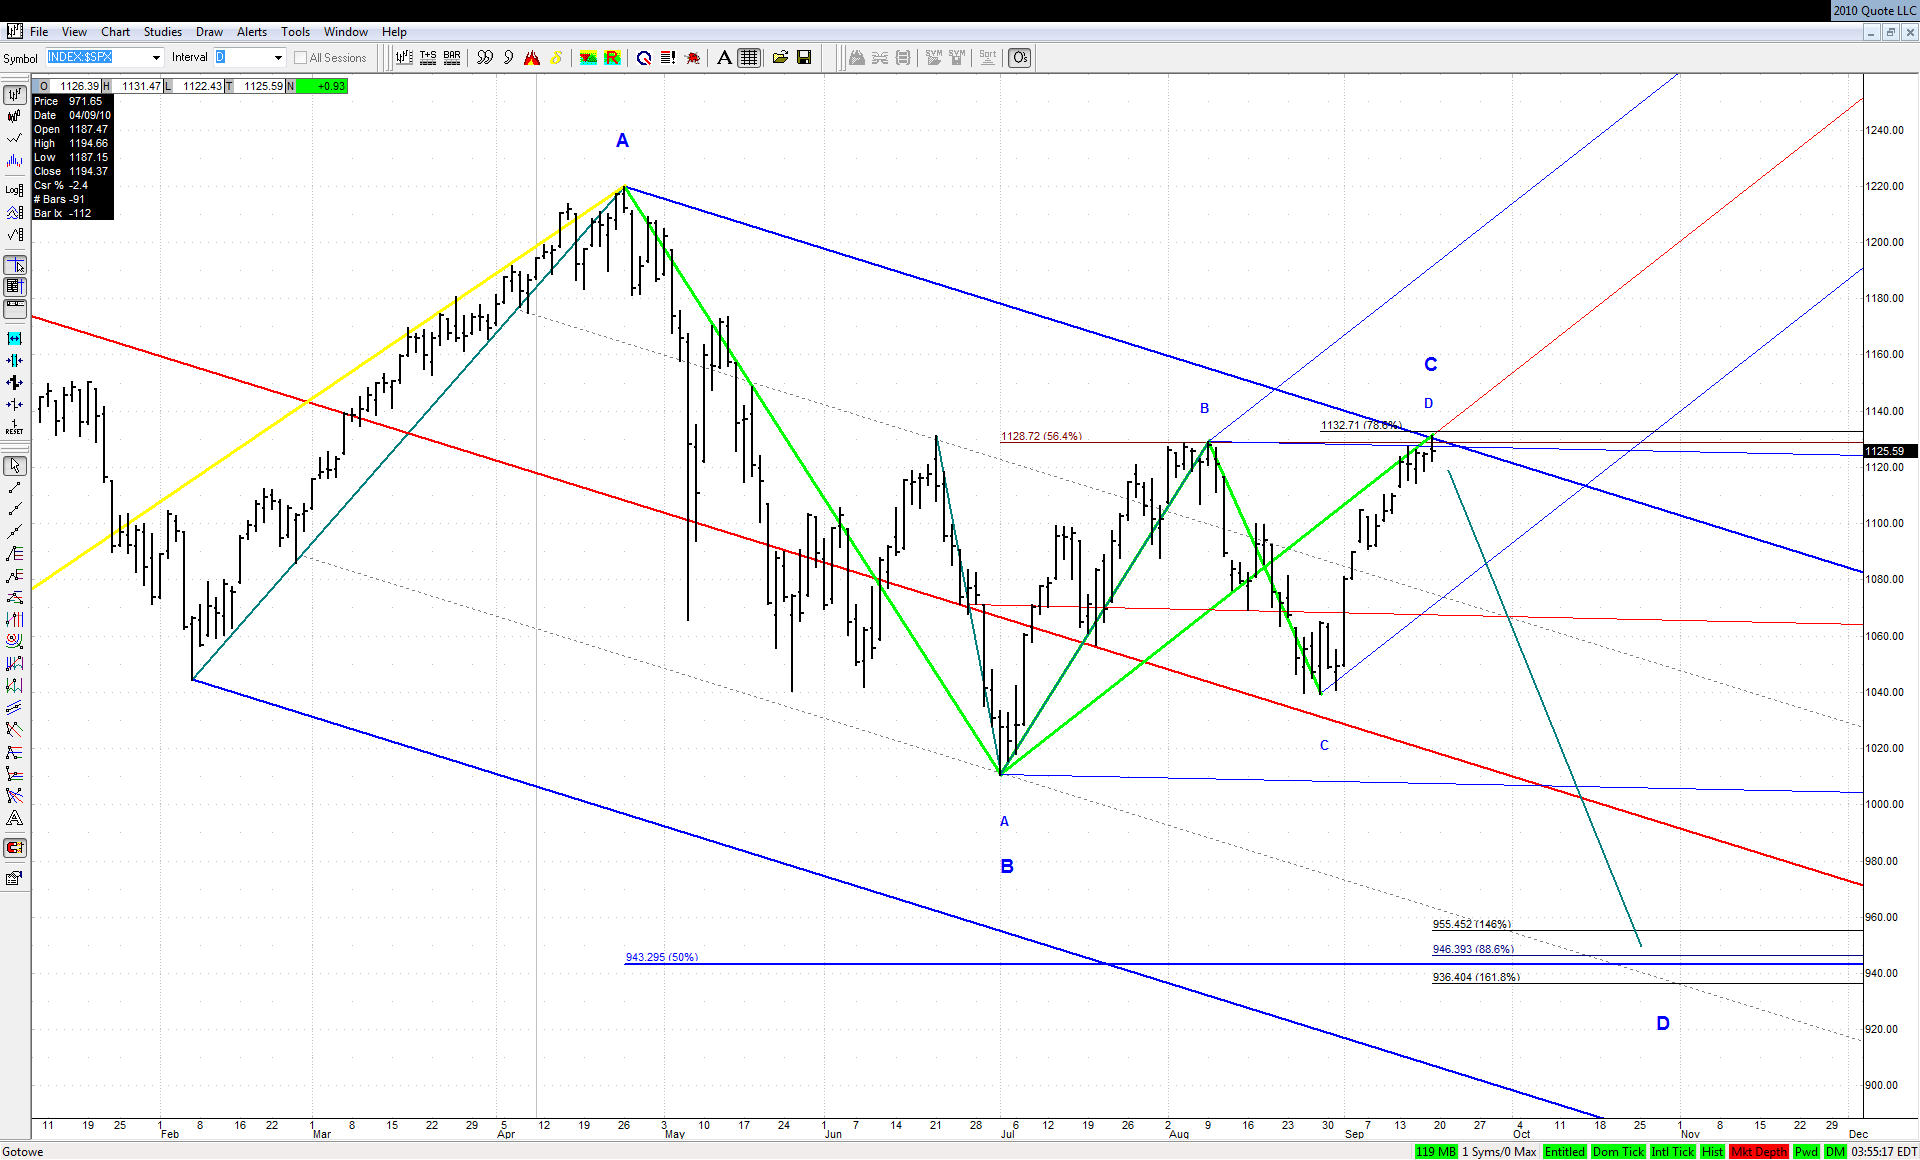
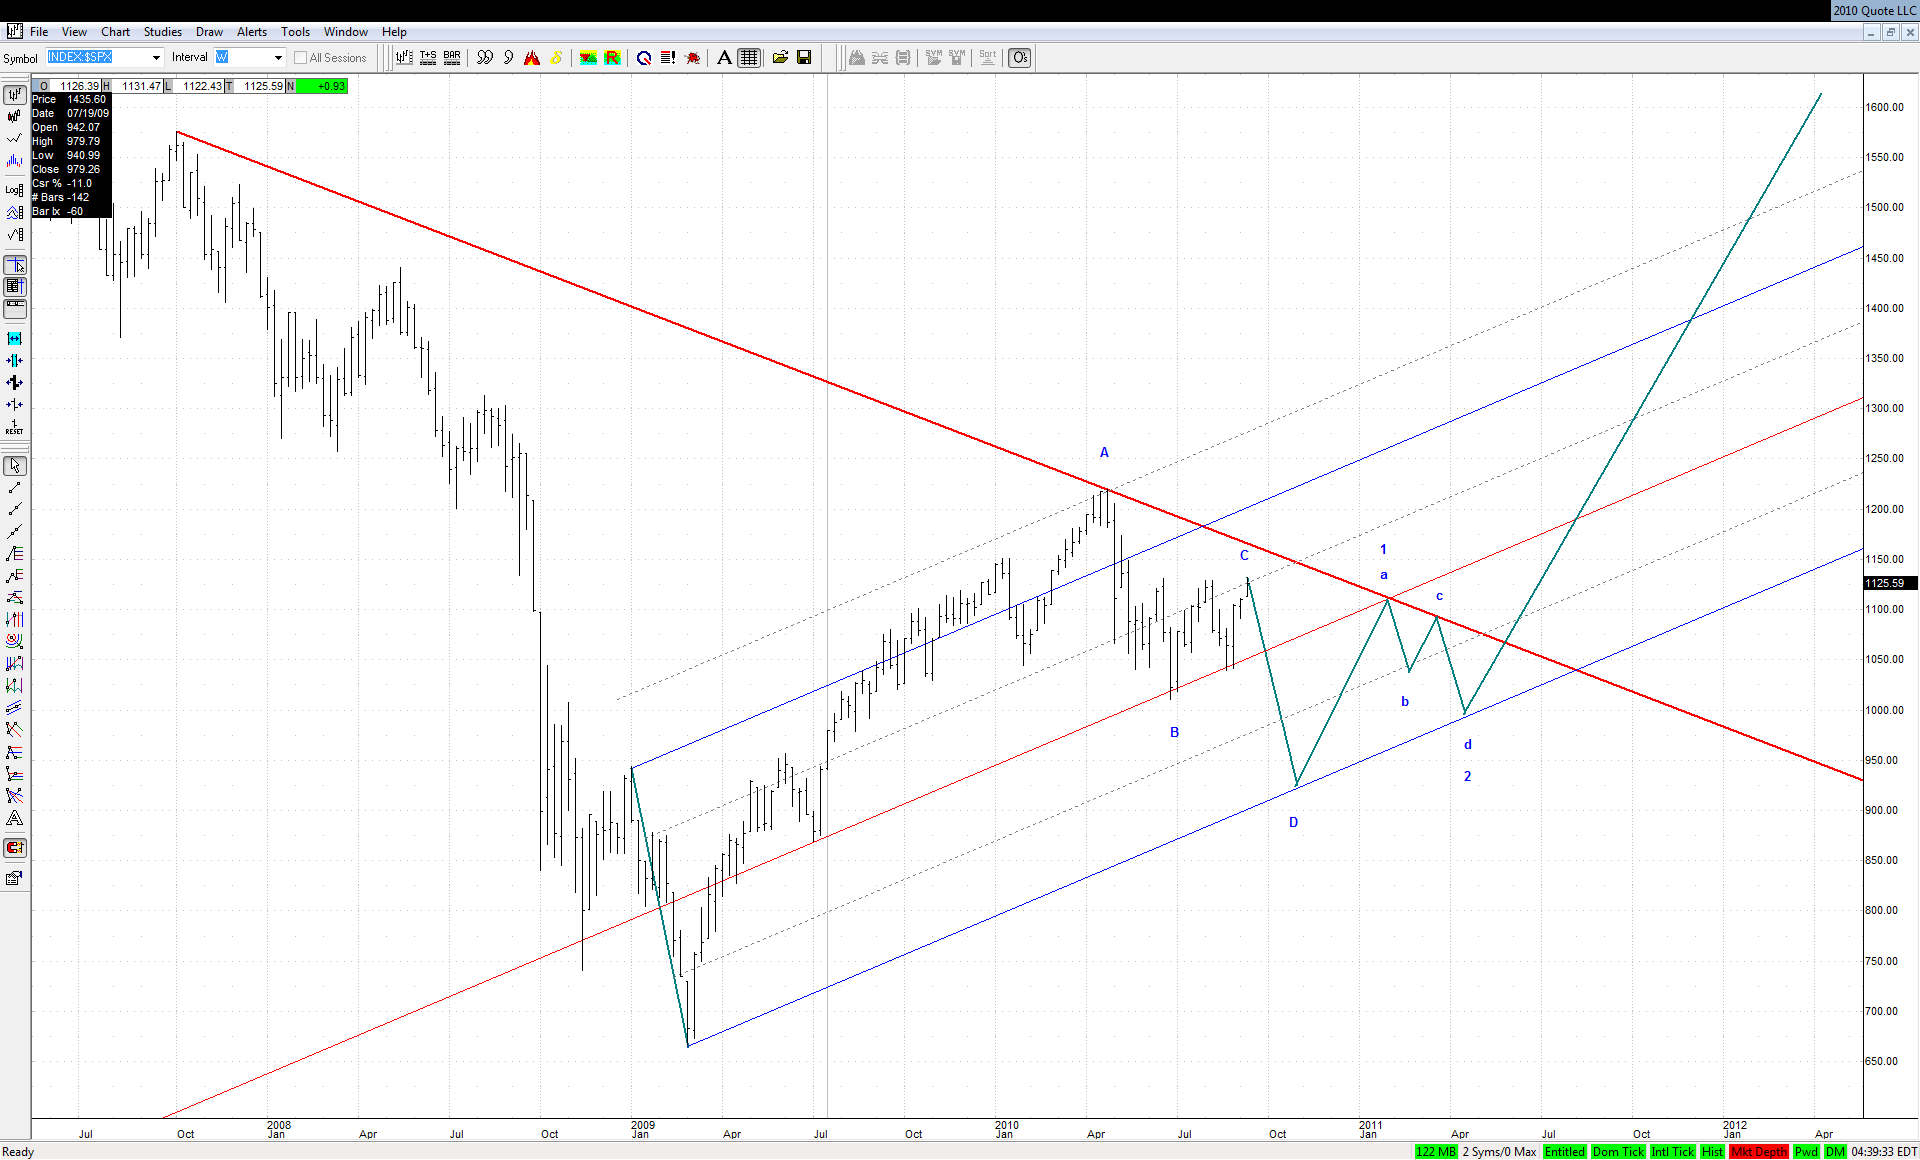
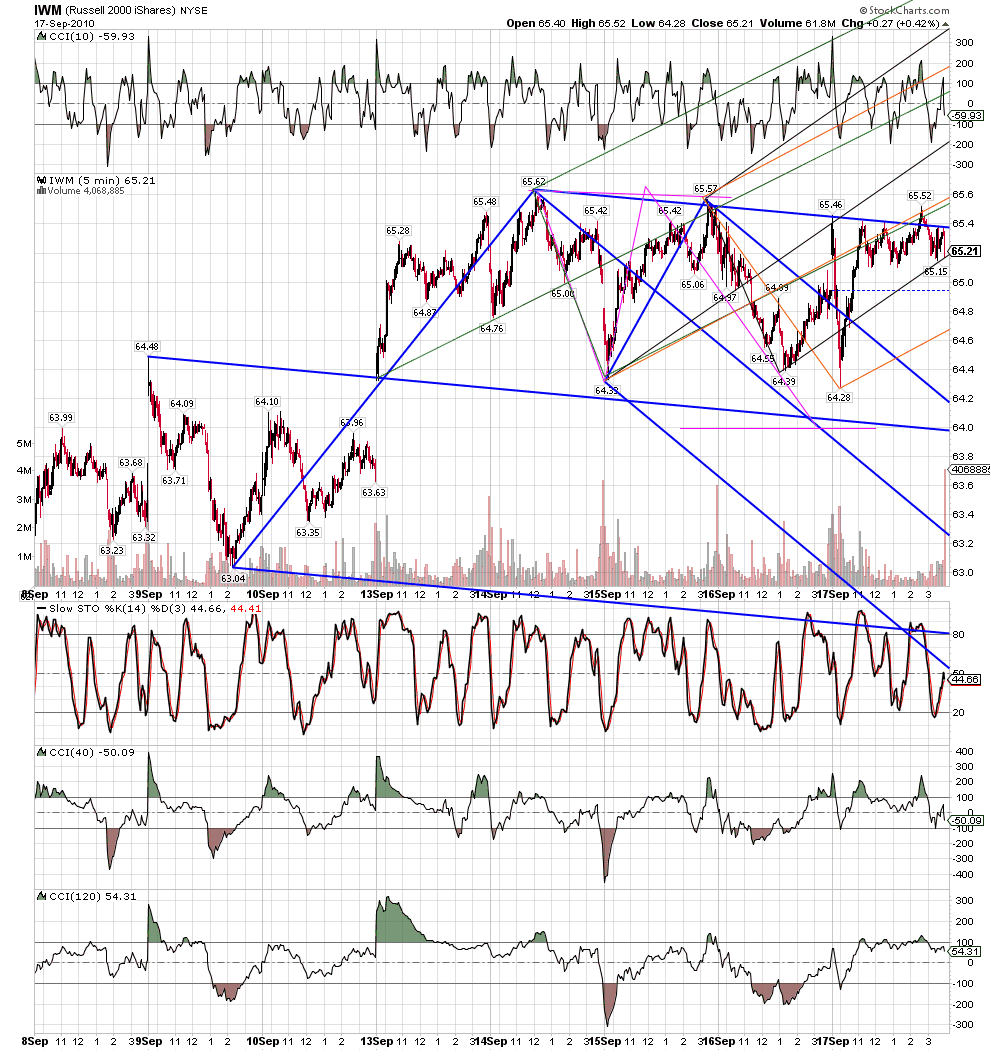
Together with Jim I'm in the inflation camp now and believe that March 2009 - April 2010 rise was the W1 of the new multiyear bull market. The question is: can it move up from here with no looking back or it needs to "refuel" before commencing W3 up in earnest?
From what I see on various blogs and sites there are still many W3 down callers despite yesterday's taking out of August top by SPX. The chances are high that many others will join them soon if the market starts to fall impulsively from here in the following scenario:
At the end of such bullish ABCD the market should be ready for a major move up. Especially that those W3 down callers would be allowed to hang on for many more months to come if the most probable scenario developes:
Could you imagine the amount of fuel they could provide in such scenario?
JA
jarek
Rep: 94
Posts: 3,474
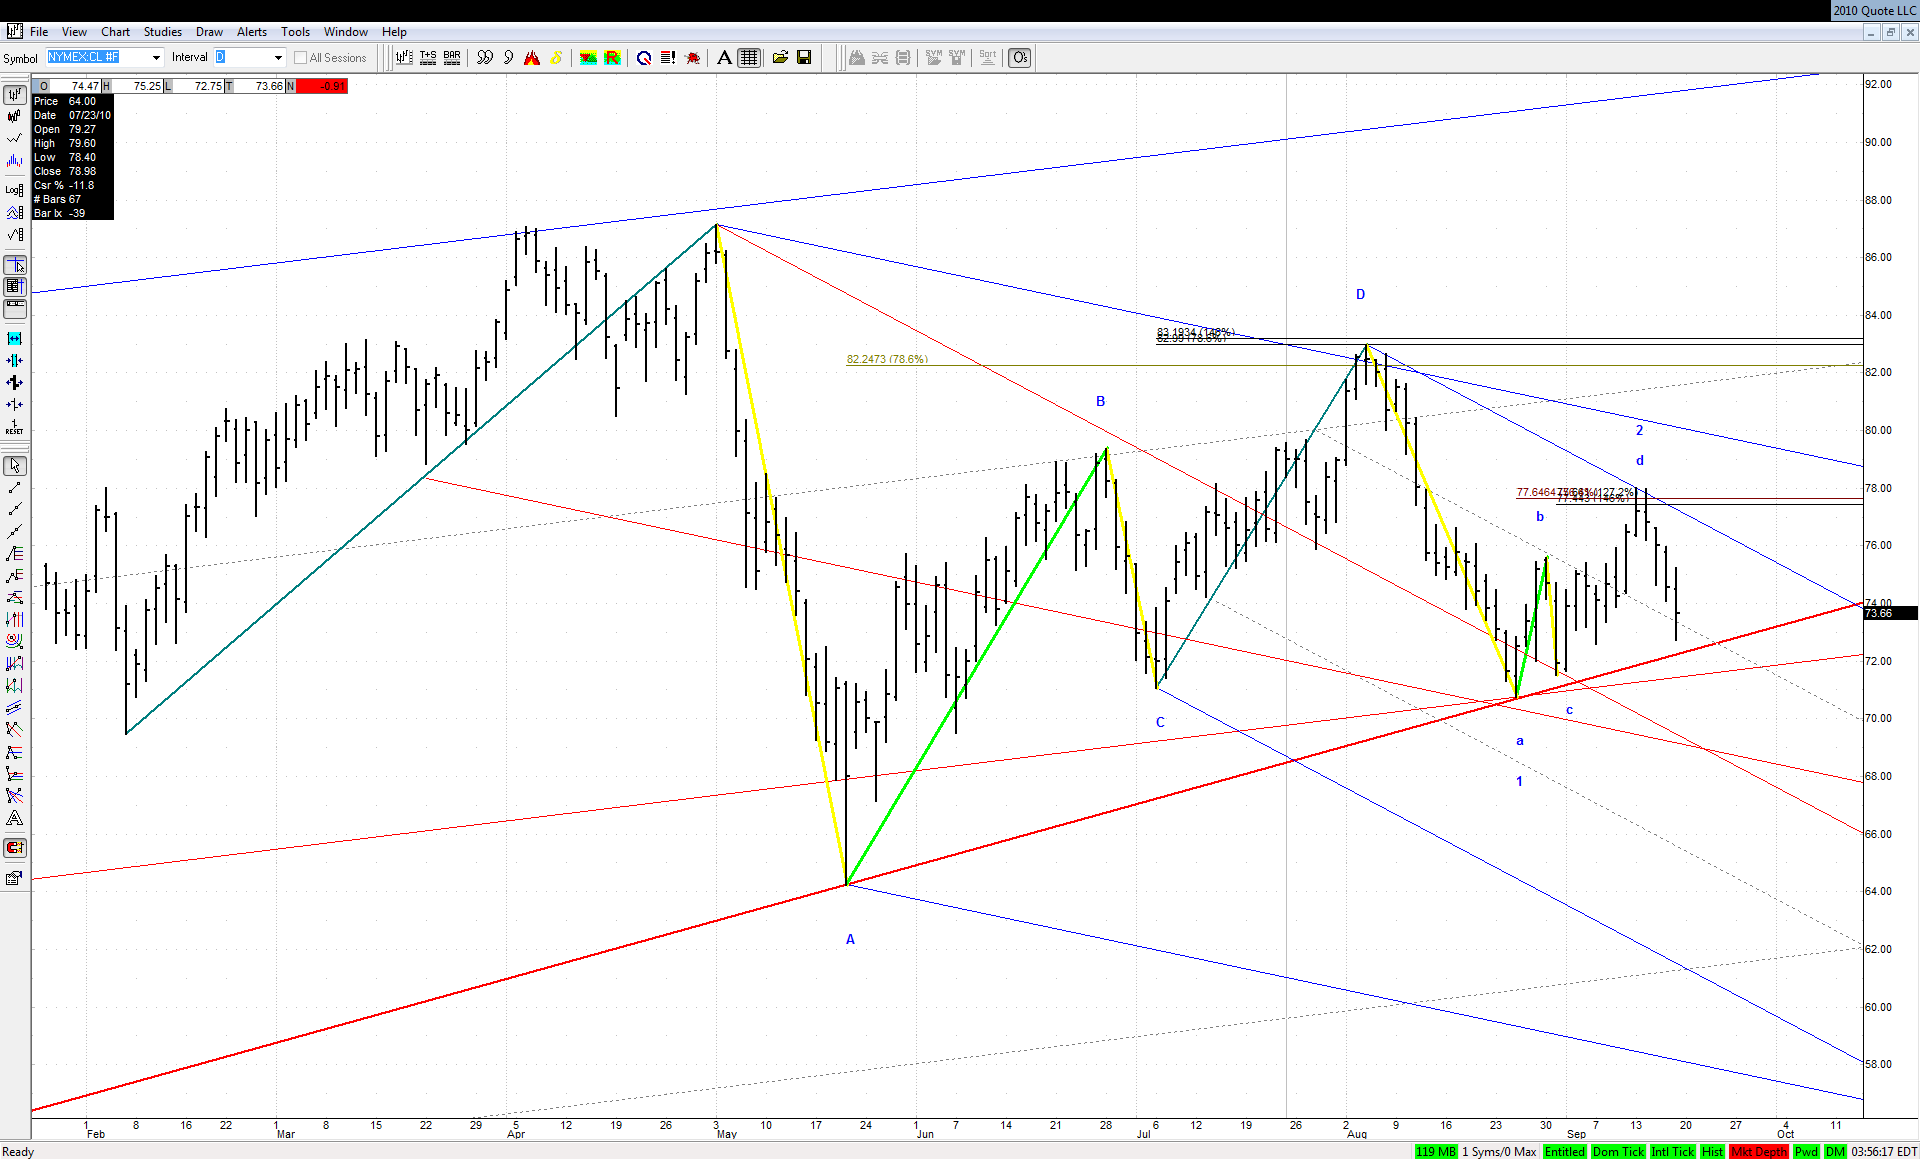
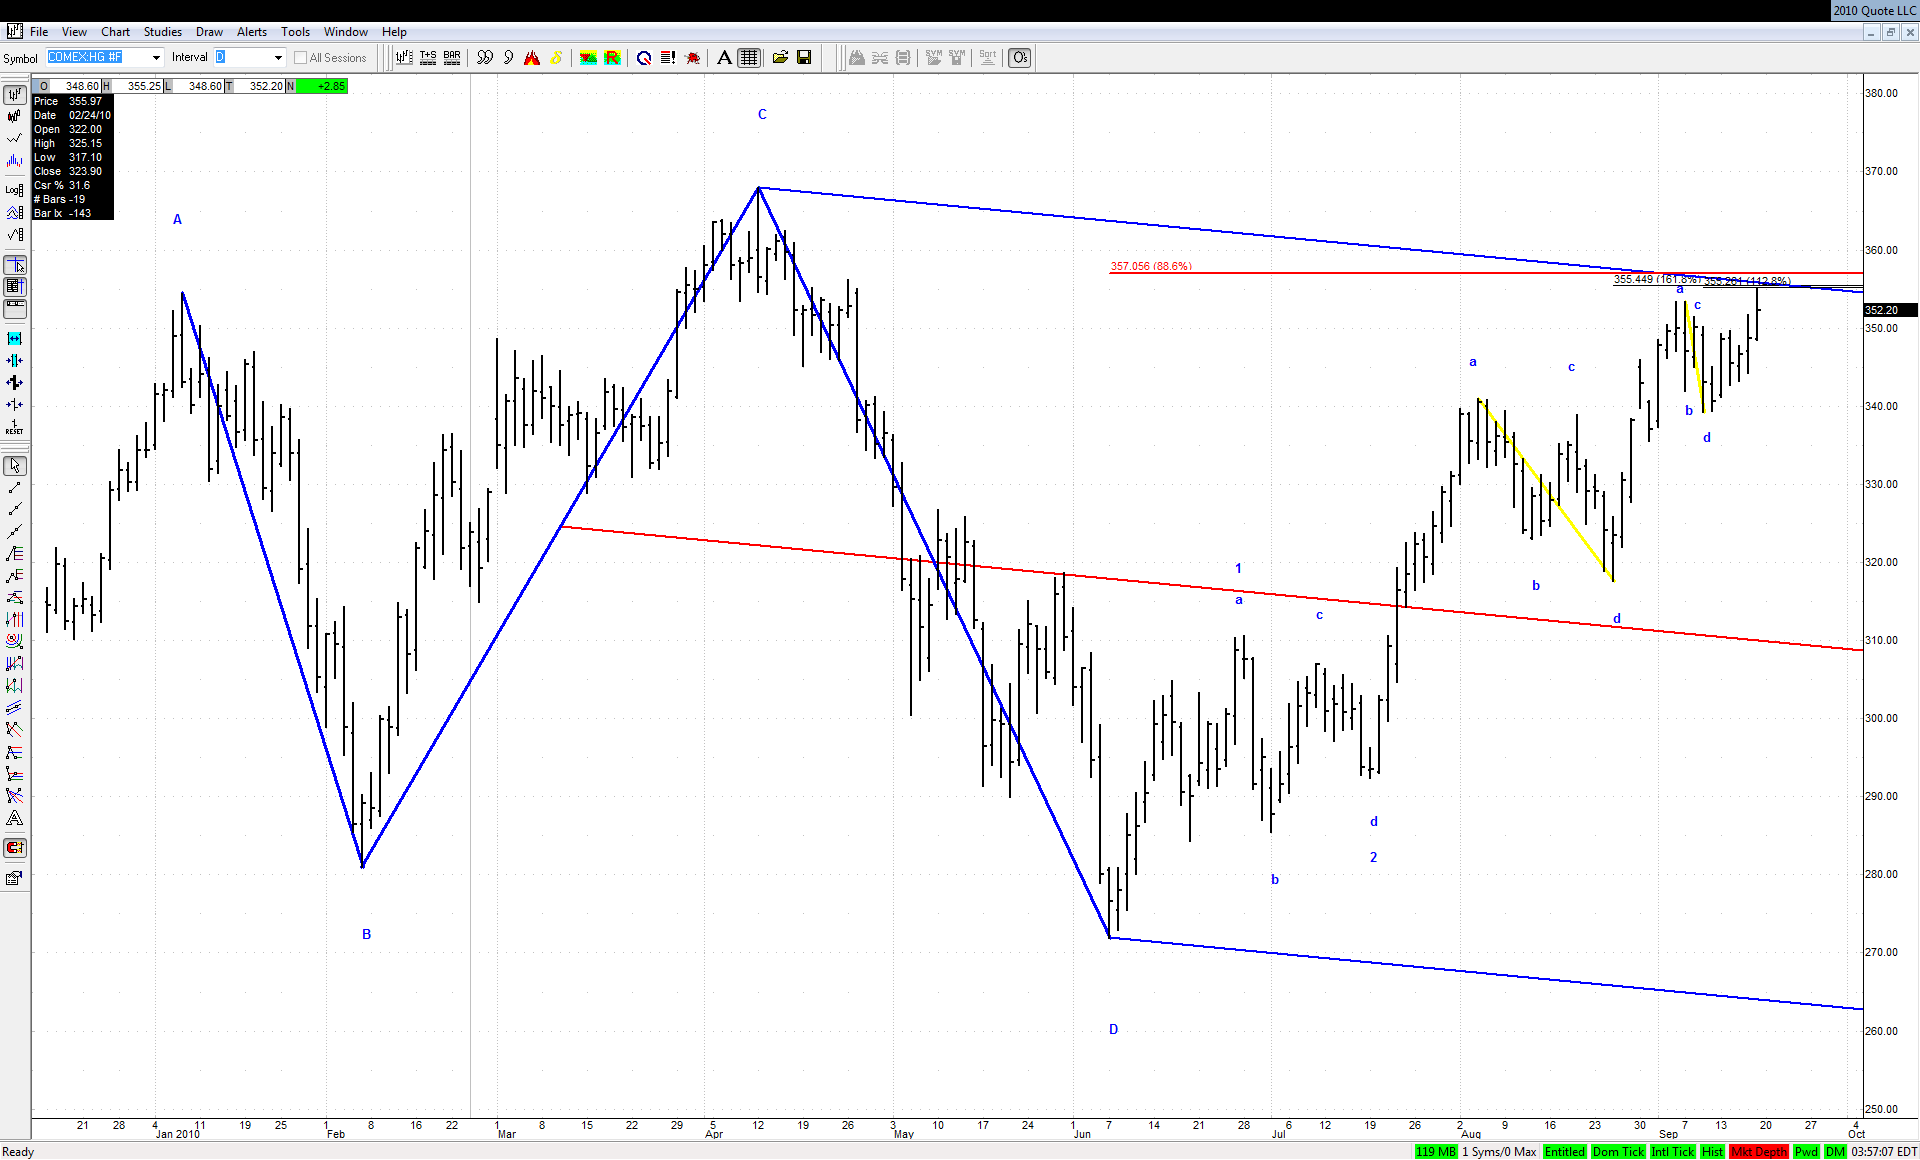
One of the factors that made me considering a possible drop right from here is that major commodities are signalling the possible 'risk off' mode for the nearest future.
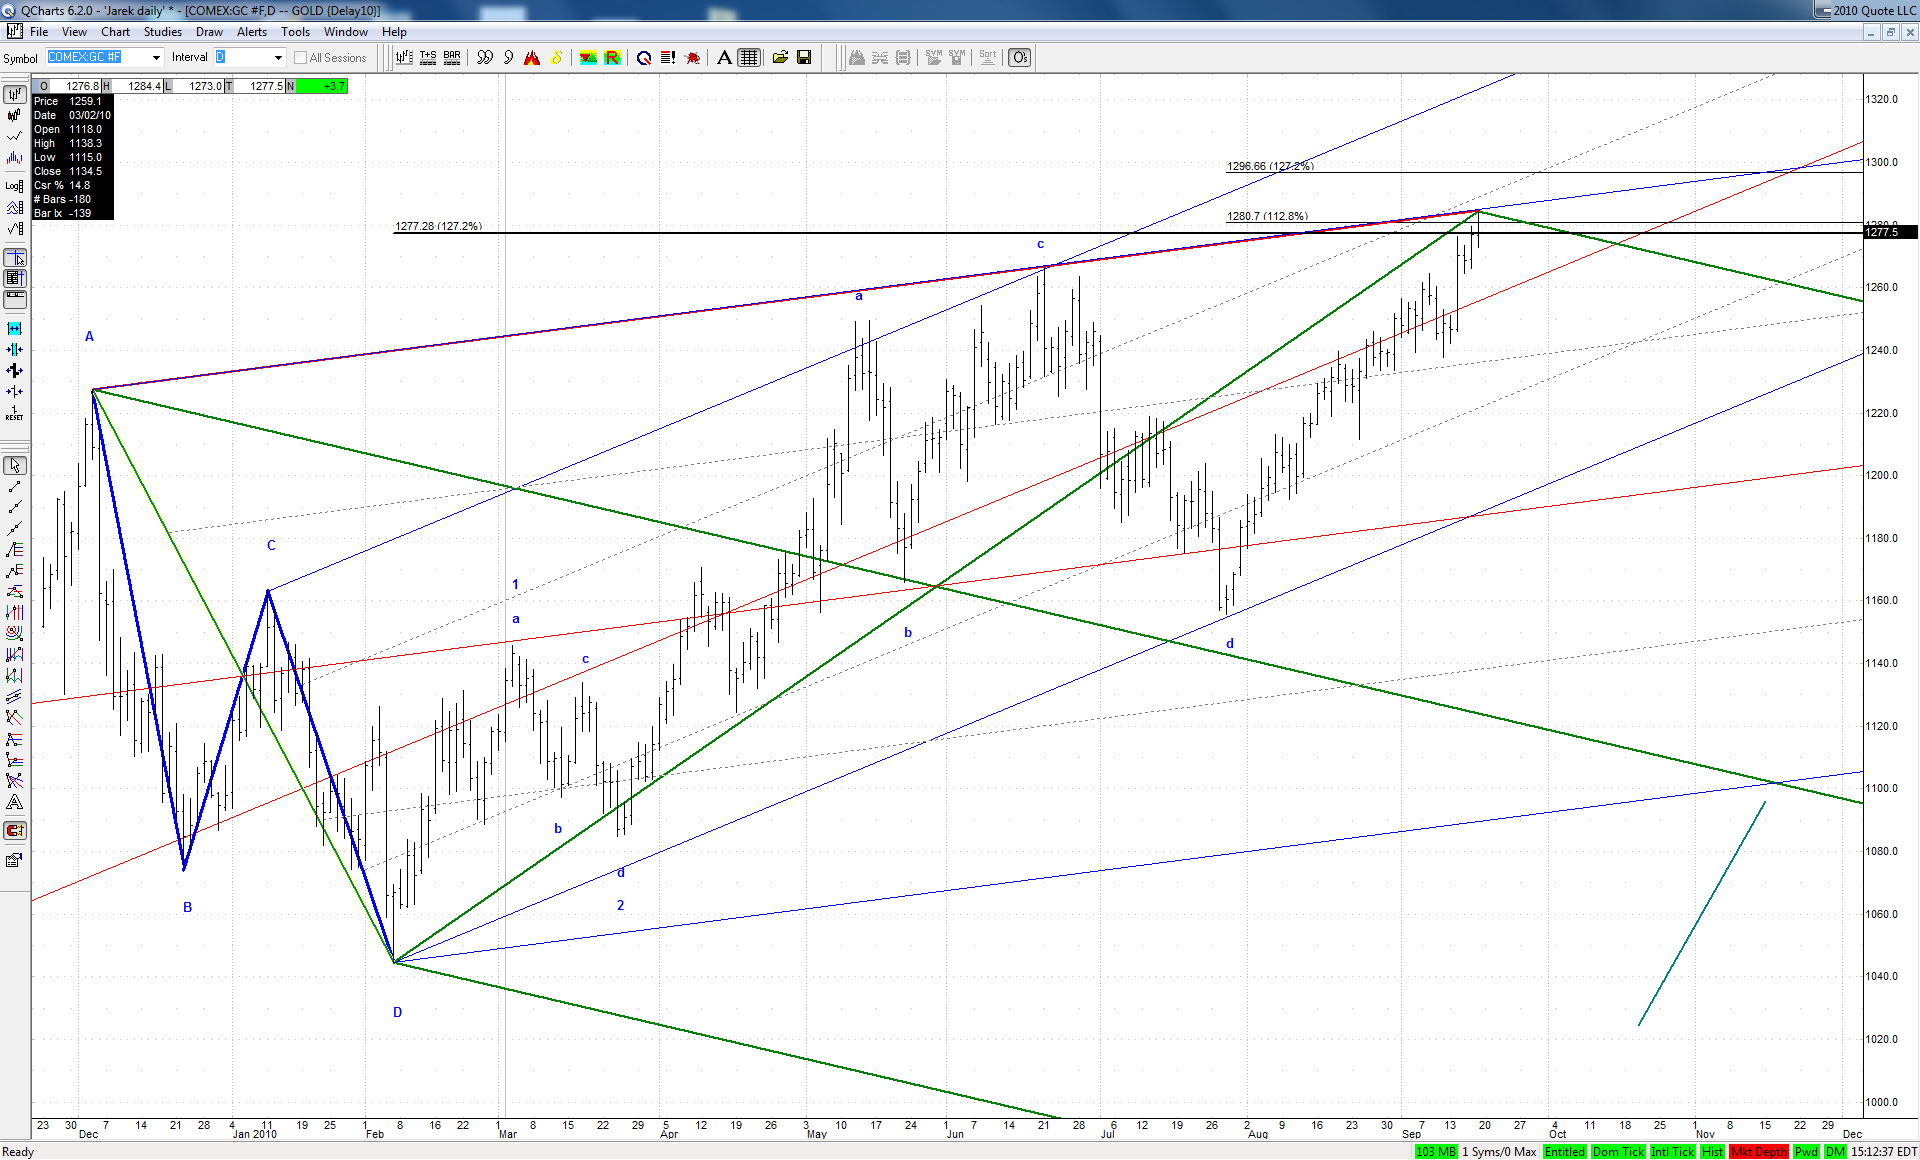
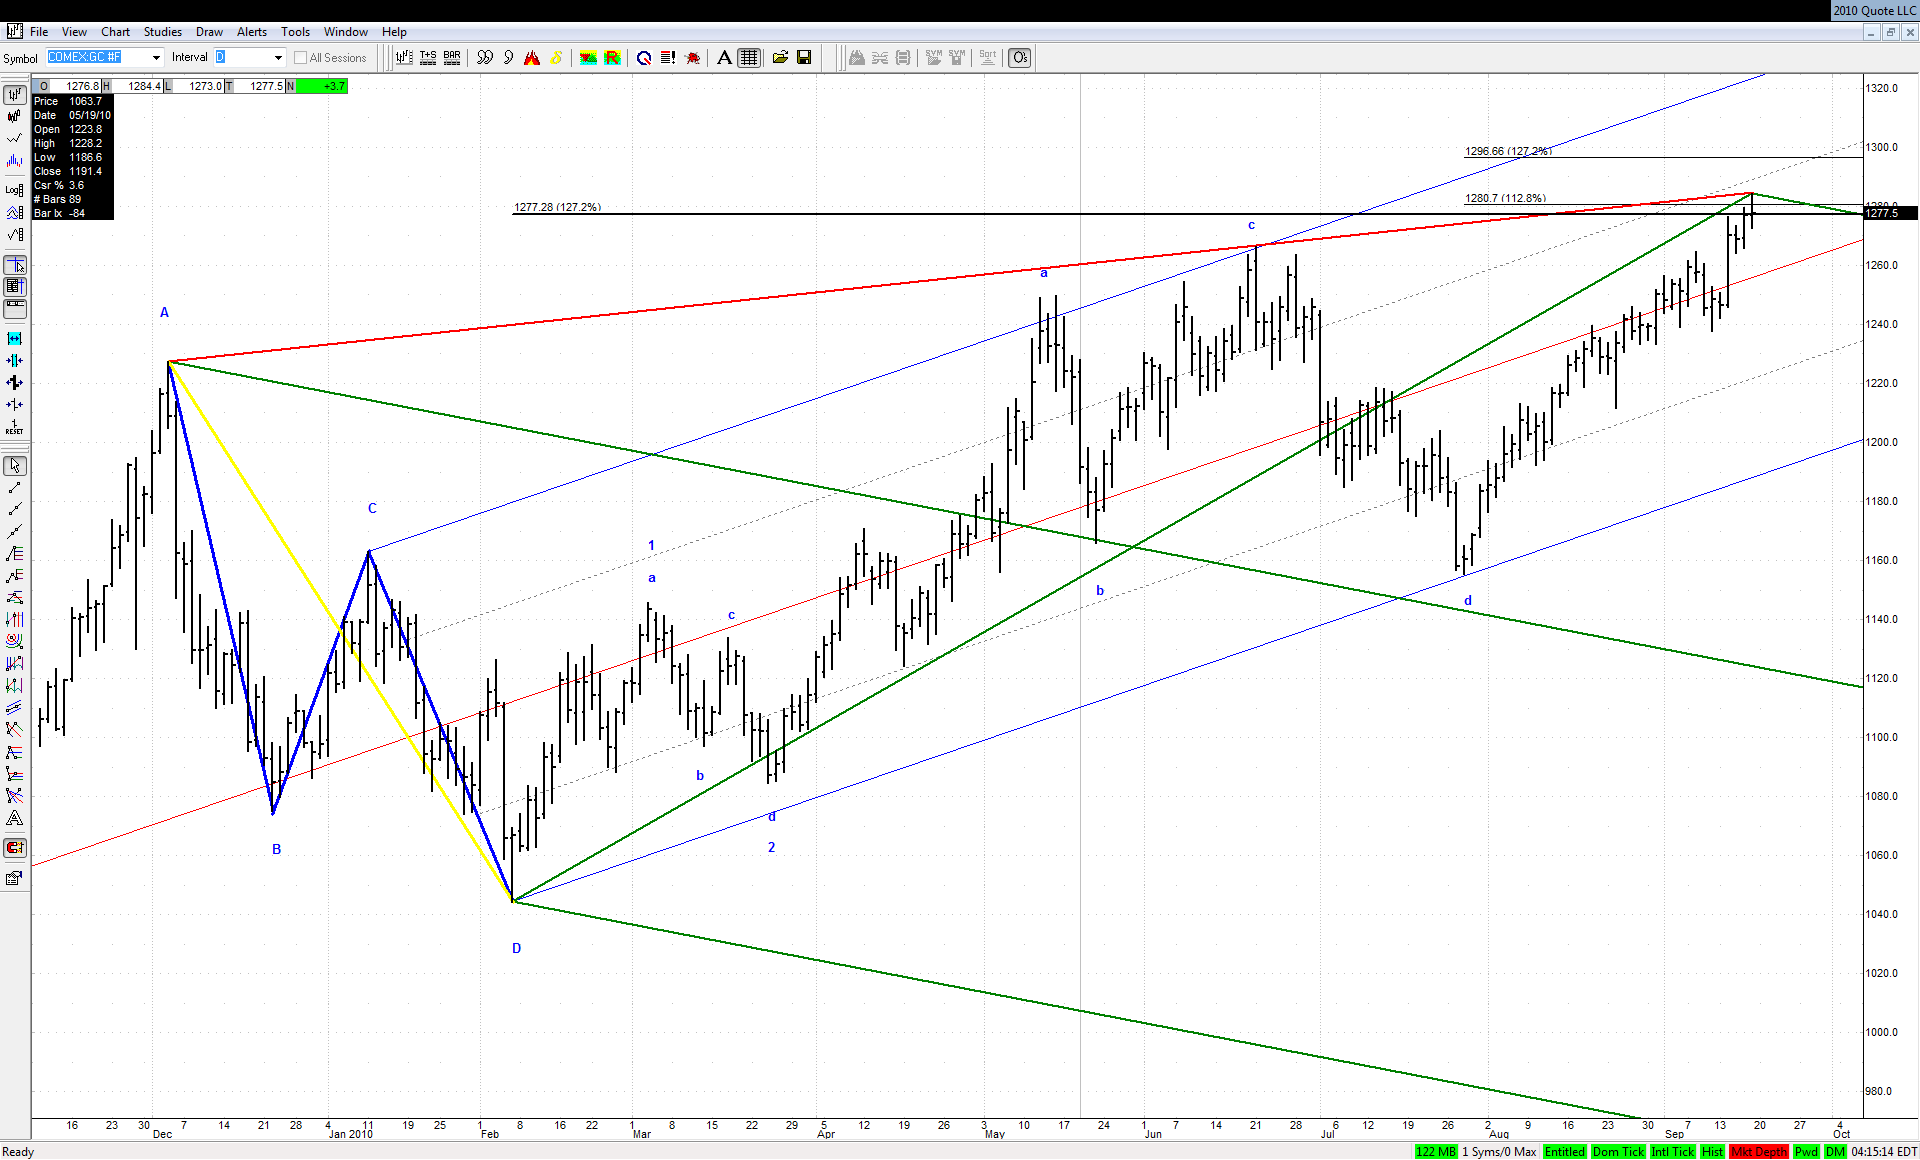
Gold hasn't reached yet the 1.272 of the last EXP ABCD, but it hit 1.272 of the Dec-Feb ABCD and a very important line connecting December and June tops. It also looks like a possible five waves up from February bottom and if indeed then a correction all the way down to the green ML could be needed at this point:
A move up from an important bottom in Crude and a possible bullish 4PT I mentioned recently was able to form just a small bearish ABCD. If the latter plays out then a following scenario could be in cards:
Copper has completed five waves up exactly at a great place to finish the first push up off its longer term bullish EXP ABCD:
JI
jimkane
Rep: 3,058
Posts: 33,089
That's some spectacular scenario work there, jarek. On your gold chart, take that upper red SL you drew and clone it, and add it to the 'D' point low from Feb, and see where that hits that green roofer ML. Very curious, huh? And that might also then become a much bigger EXP ABCD there. I'd love gold to pull back to that level to give me a chance to buy some there, instead of thinking of buying up here. Imagine the gold bears talk as it heads down there...
JA
jarek
Rep: 94
Posts: 3,474
Originally posted by jimkane
...On your gold chart, take that upper red SL you drew and clone it, and add it to the 'D' point low from Feb, and see where that hits that green roofer ML...
Here is the updated gold chart. The intersection points comes in middle November at around 1100 level:
JA
jarek
Rep: 94
Posts: 3,474
Originally posted by roofer
...the tools have been working better and better on shorter time frame....
We all know what that means
JI
jimkane
Rep: 3,058
Posts: 33,089
Originally posted by jarek
Originally posted by jimkane
...On your gold chart, take that upper red SL you drew and clone it, and add it to the 'D' point low from Feb, and see where that hits that green roofer ML...
Here is the updated gold chart. The intersection points comes in middle November at around 1100 level:
Okay, now add a 100% time retracement from the point 'd' low to the recent high (assuming the high is in...). Look where that hits. Now, is there any significant event that happens in the first few weeks of November that might benefit from gold dropping precipitously (and hence stocks likely to ramp excessively)? No, I can't think of anything key that happens in the beginning of November
JI
jimkane
Rep: 3,058
Posts: 33,089
Originally posted by roofer
from another perspective, the tools have been working better and better on shorter time frame....
I have to say, roofer, when I step back and look at that chart all I see is too many tests of the high end of the range, and a chart ready to explode up and over and run hard. That's just what my trader sense tells me. Like you say (or Joed says) about the tools working better and better on lower and lower timeframes, the big turn (or possibly in this case, move) is easy to miss.
Although I'd strongly prefer a roll over in here, I'm thinking the odds favor my scenario of a strong up Sept and Oct, fooling everyone, and a manufactured rise until the elections. Maybe not, but that chart looks like a breakout ready to happen. And today we get confirmation the IMF bailed out Ireland on Friday or the whole system was going to collapse (that's the story I read). That should be good for a huge gap open in the futures and yet another big Sunday night GLOBEX/Monday up. Being pulled back from the edge of doom is always a very bullish event, right???
RO
roofer
Rep: 3,689
Posts: 3,574
ah, you guys are probably right.... my position is small enough that iwon't lose any sleep tonight....
JI
jimkane
Rep: 3,058
Posts: 33,089
roofer, I think it may well react off this area, and a position you have now will very likely move the amount you need it to. I was just remarking that on the higher timeframe, over the next few months, I think that chart is pointing to a more likely upside resolution.