ES Short Term Trading 11-29-2010
Getting things started for the new week here is a chart with cumulative delta on the bottom pane. This indicator tracks the difference between bid volume and ask volume. You can see the two red lines I've drawn at -98202 and -176494. These areas represent in my view last weeks buying/selling pressure zones. For prices to rally in any significant fashion delta will need to get up and through that -98k area. Sellers still have control here in terms of cumulative contracts being in the minus side.
I hope that makes sense.
I hope that makes sense.
Click image for original size
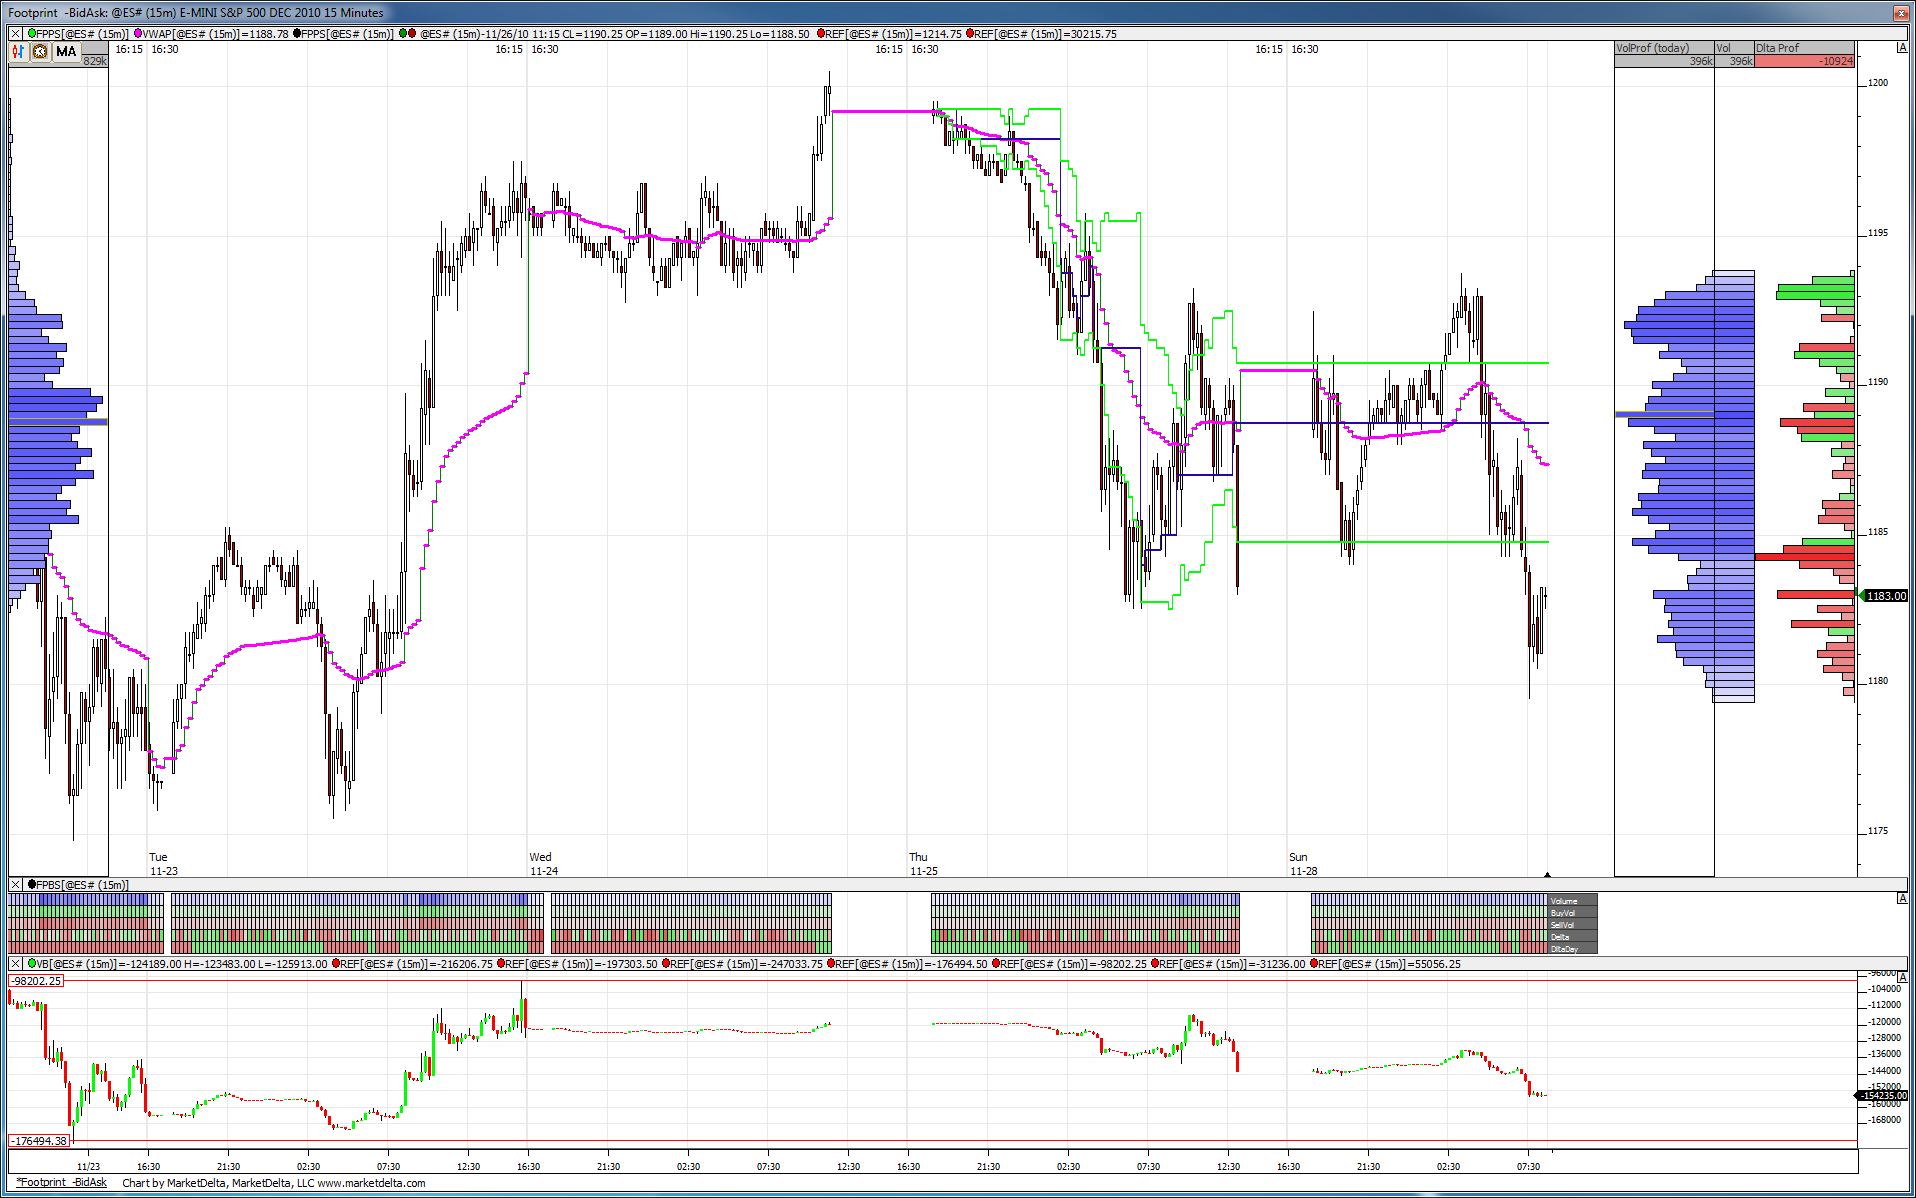
I'm observing 1177.00 area for set ups one way or the other.
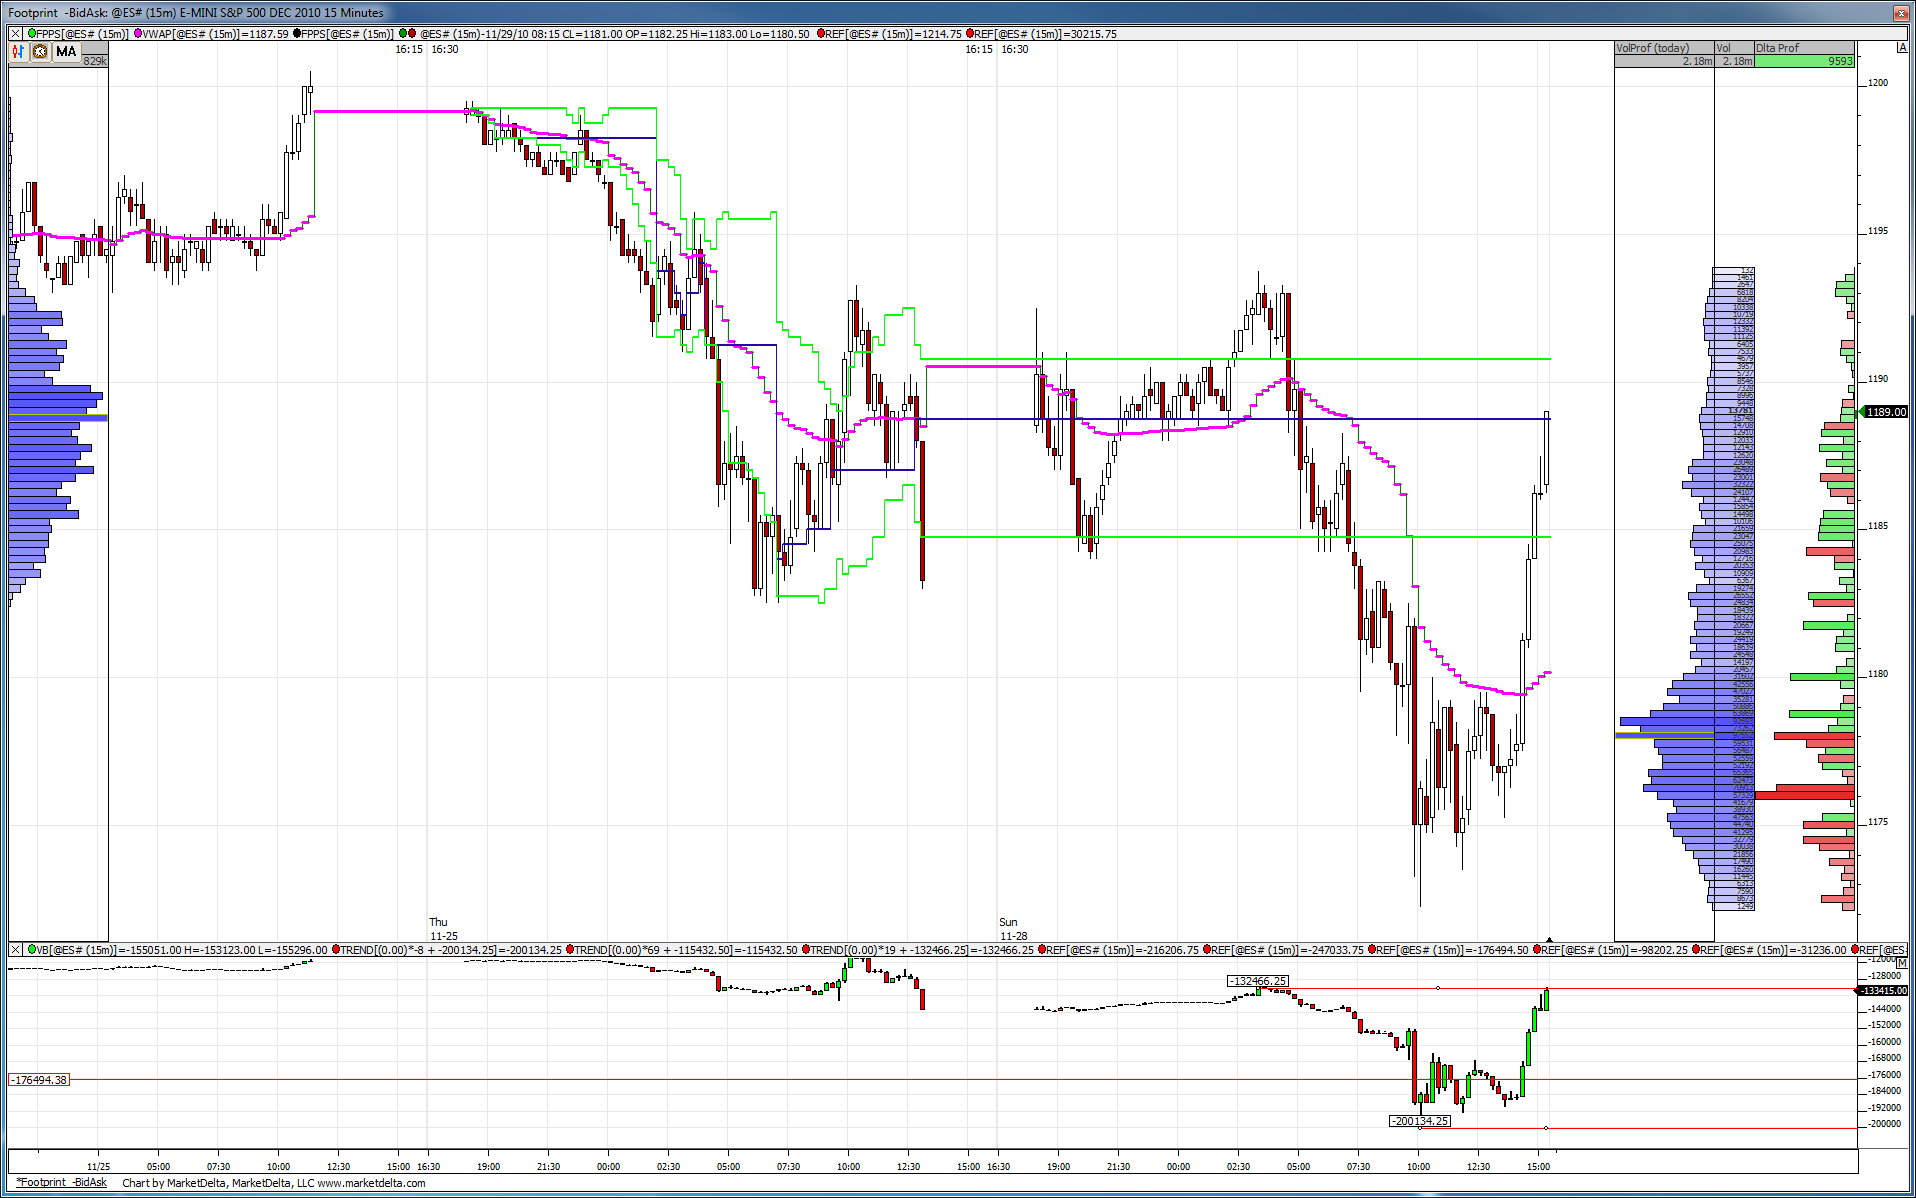
1188 or PP has a 2.618 fib Ext. which developed this morning, Resistance at 1.618 or MdP at 1183
1188 or PP has a 2.618 fib Ext. which developed this morning, Resistance at 1.618 or MdP at 1183
Prices are at an interesting juncture here. You can see on the lower pane delta is back to where selling was initiated in the overnight action around -132k contracts.
Click image for original size
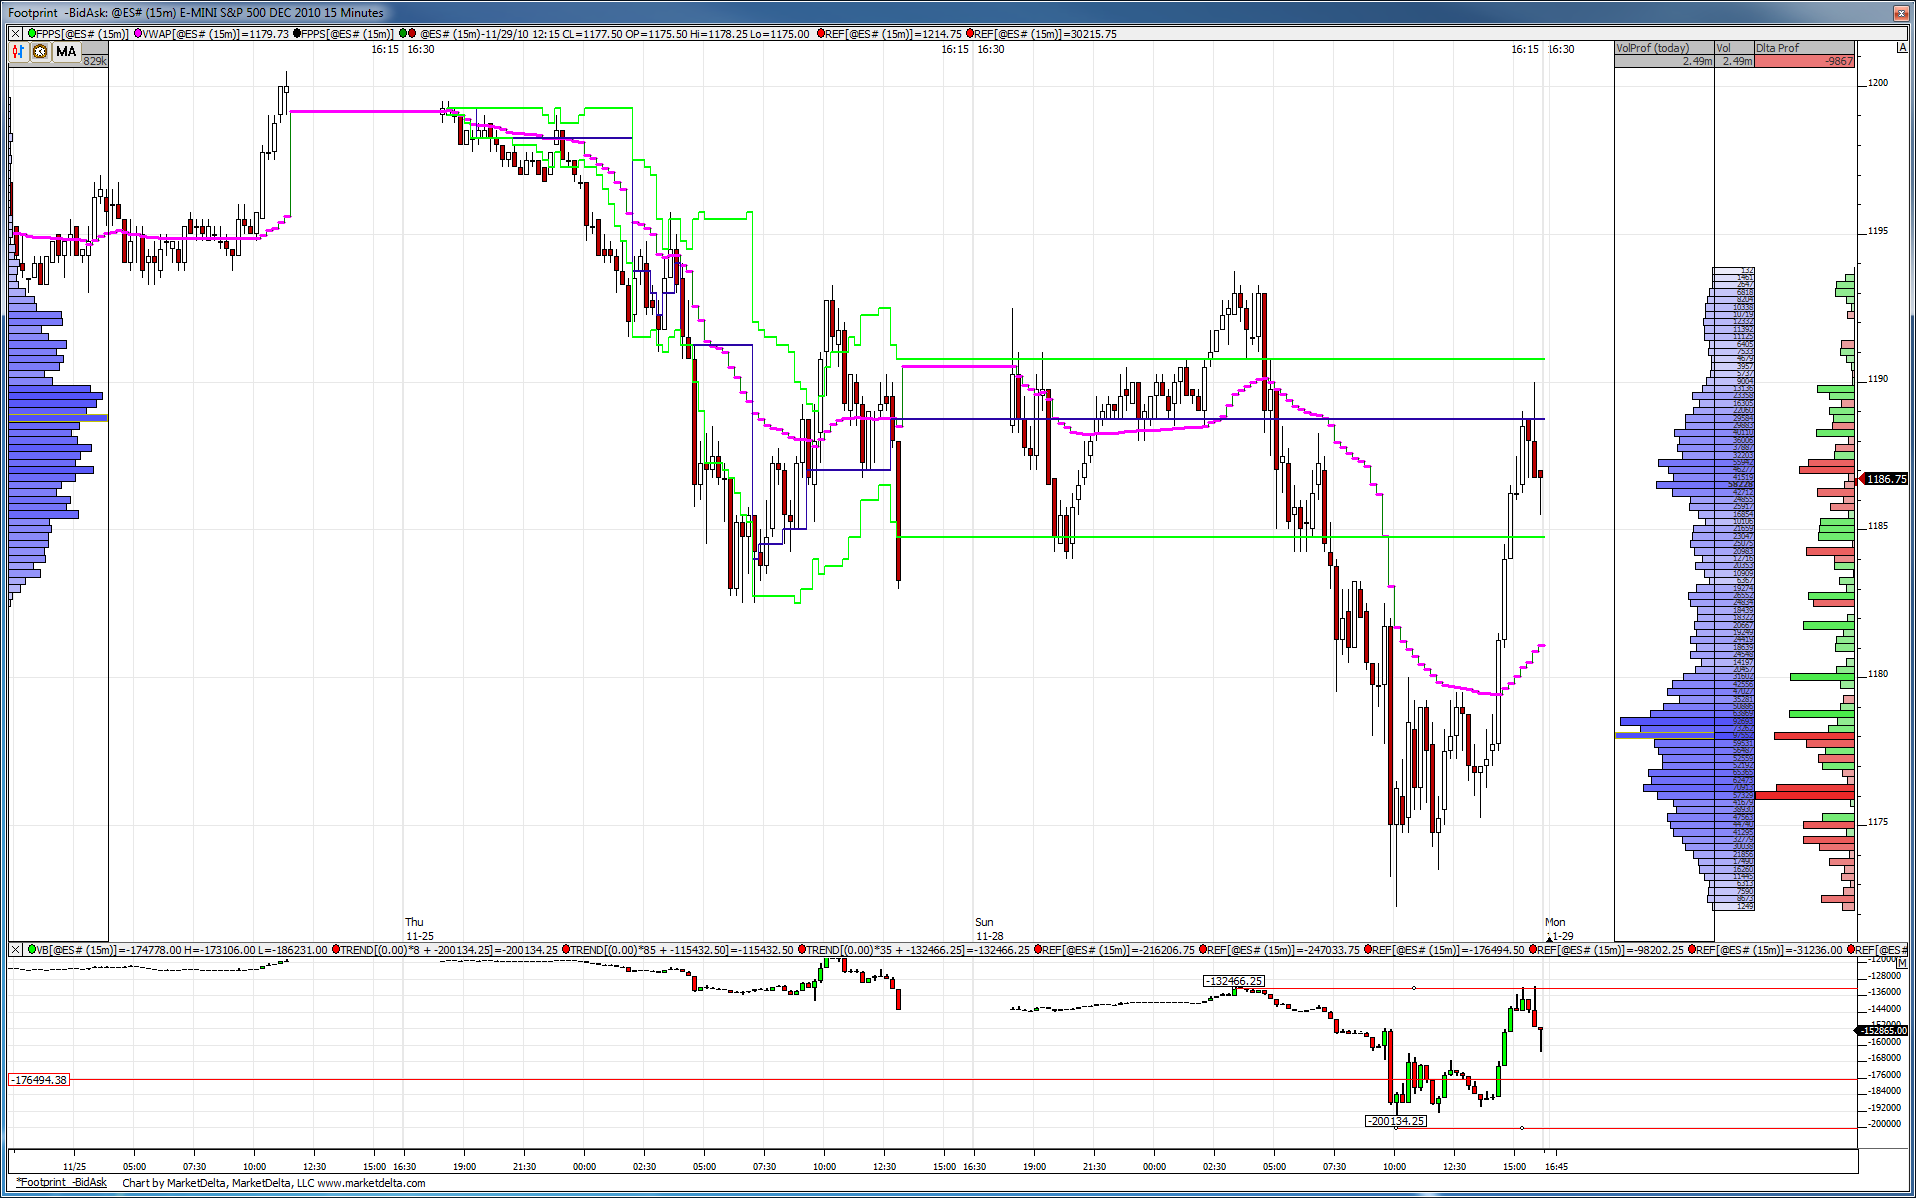
To show the follow up you can see delta has struggled at where the selling initiated. This must be overcome for price to continue upwards.
Click image for original size
Last few days, awesome calls Bruce!
And Lorn, great charts and perspective.
Thanks guys! Some times does helps when we are congruent. Some many different ways, one outcome!
And Lorn, great charts and perspective.
Thanks guys! Some times does helps when we are congruent. Some many different ways, one outcome!
Emini Day Trading /
Daily Notes /
Forecast /
Economic Events /
Search /
Terms and Conditions /
Disclaimer /
Books /
Online Books /
Site Map /
Contact /
Privacy Policy /
Links /
About /
Day Trading Forum /
Investment Calculators /
Pivot Point Calculator /
Market Profile Generator /
Fibonacci Calculator /
Mailing List /
Advertise Here /
Articles /
Financial Terms /
Brokers /
Software /
Holidays /
Stock Split Calendar /
Mortgage Calculator /
Donate
Copyright © 2004-2023, MyPivots. All rights reserved.
Copyright © 2004-2023, MyPivots. All rights reserved.