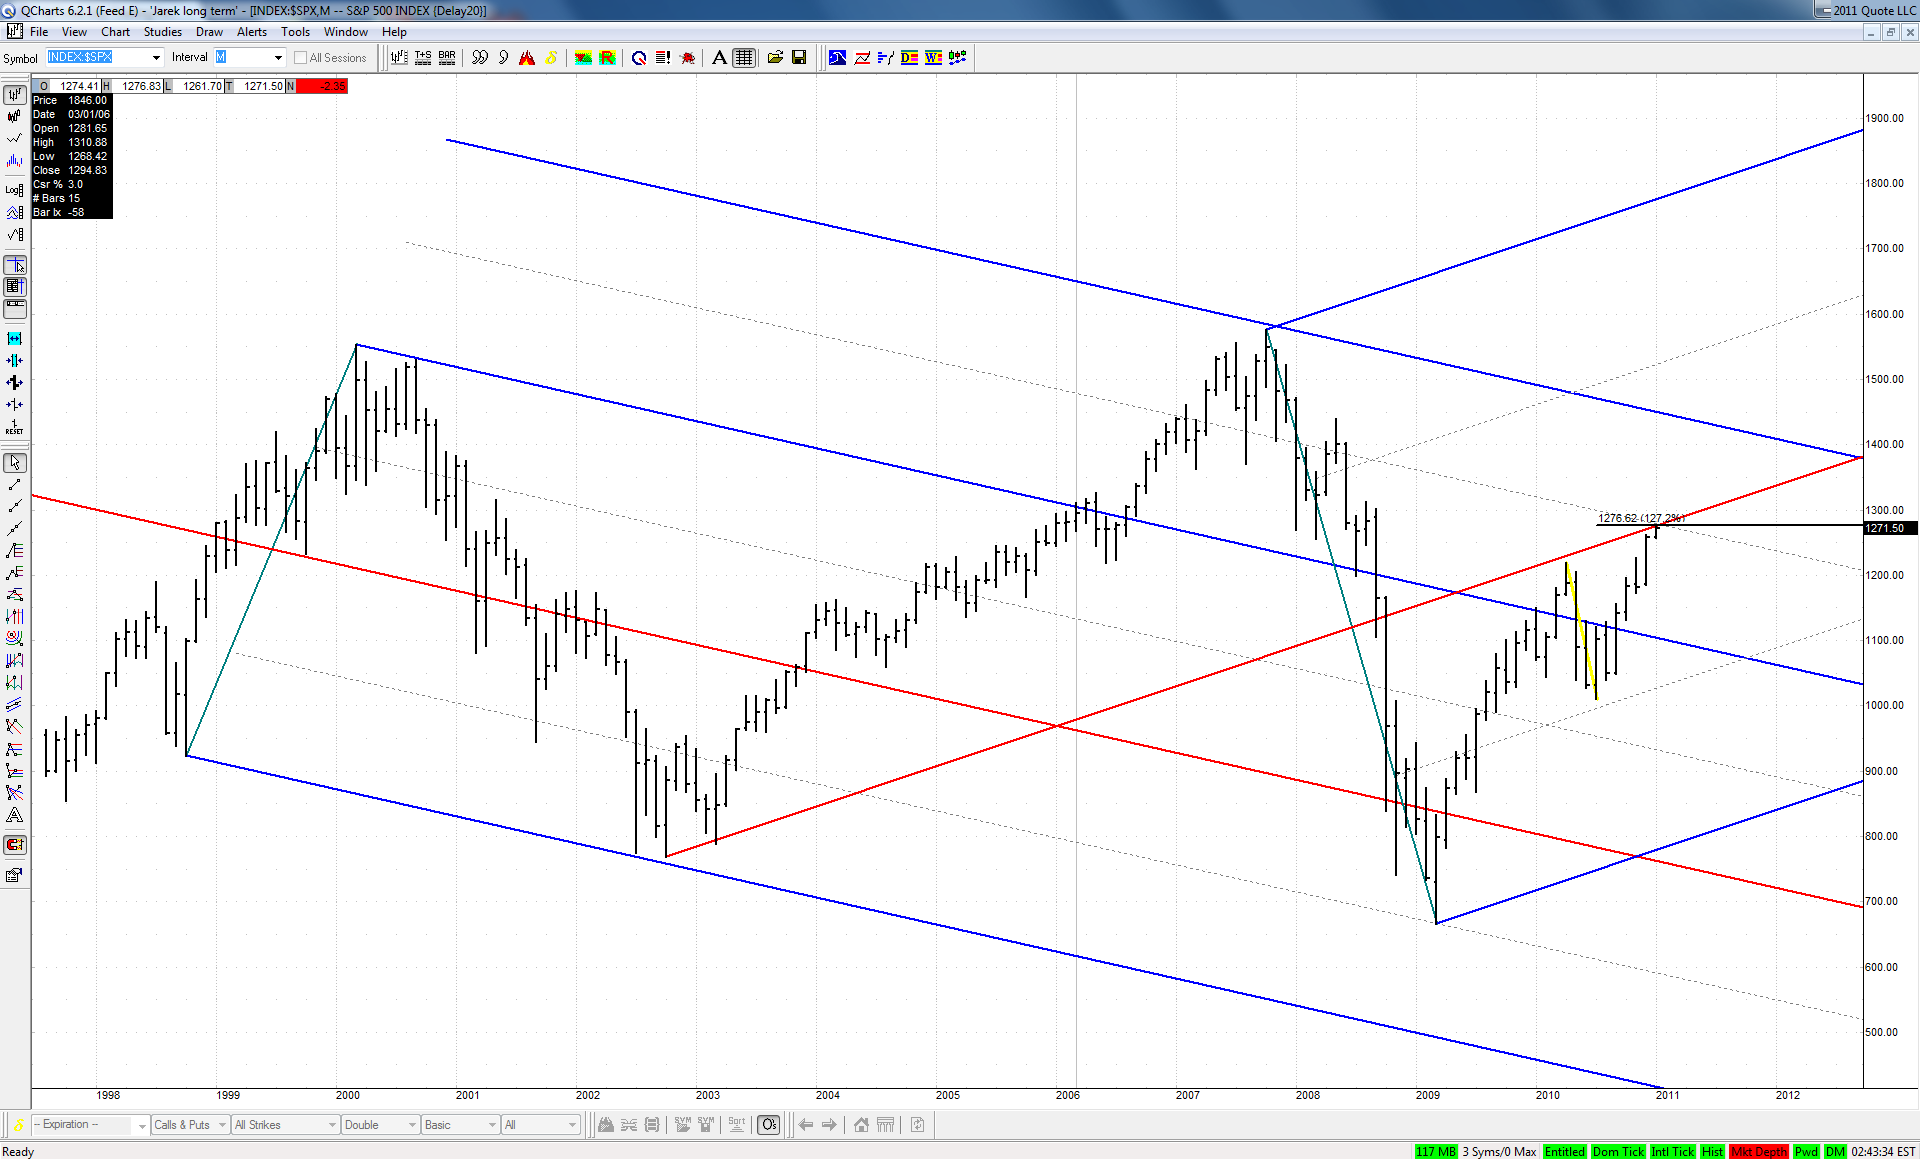
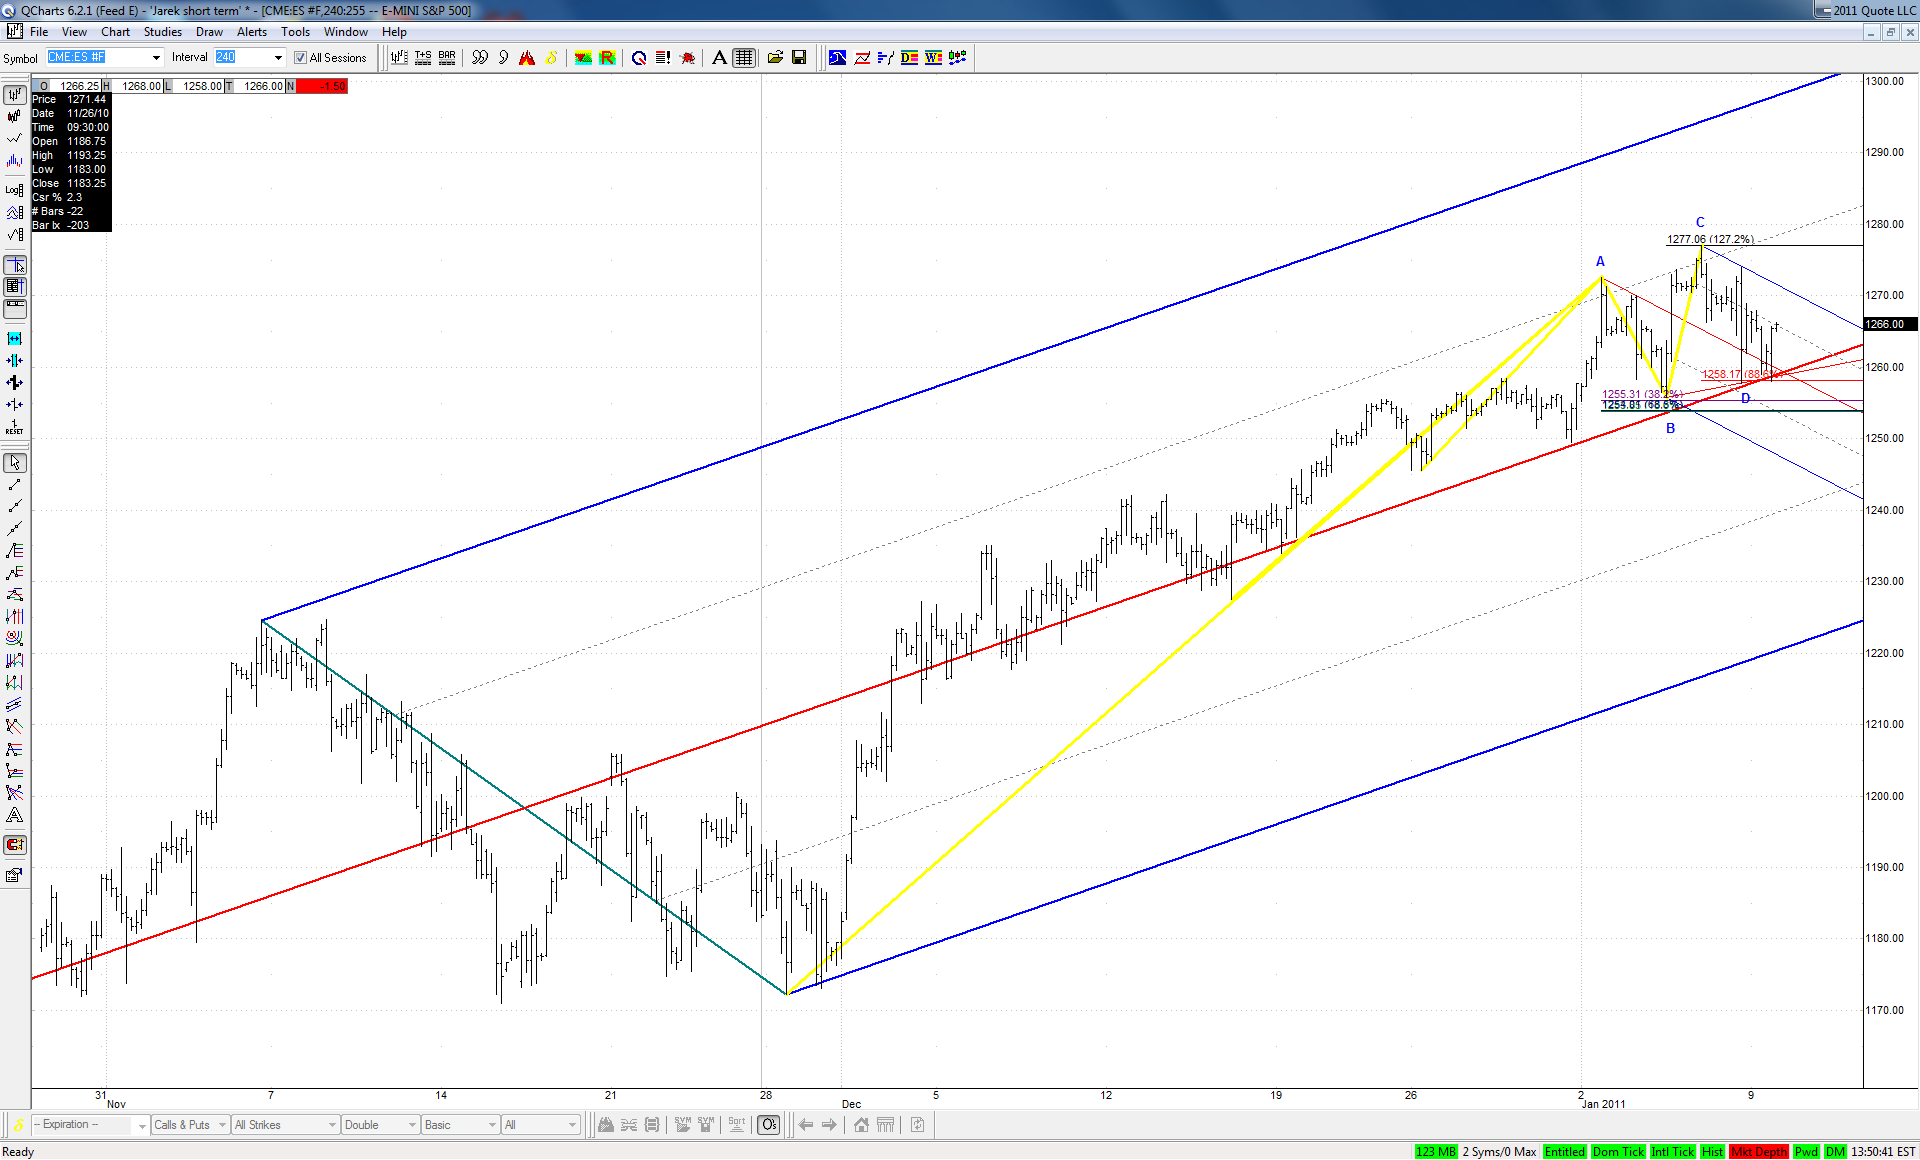
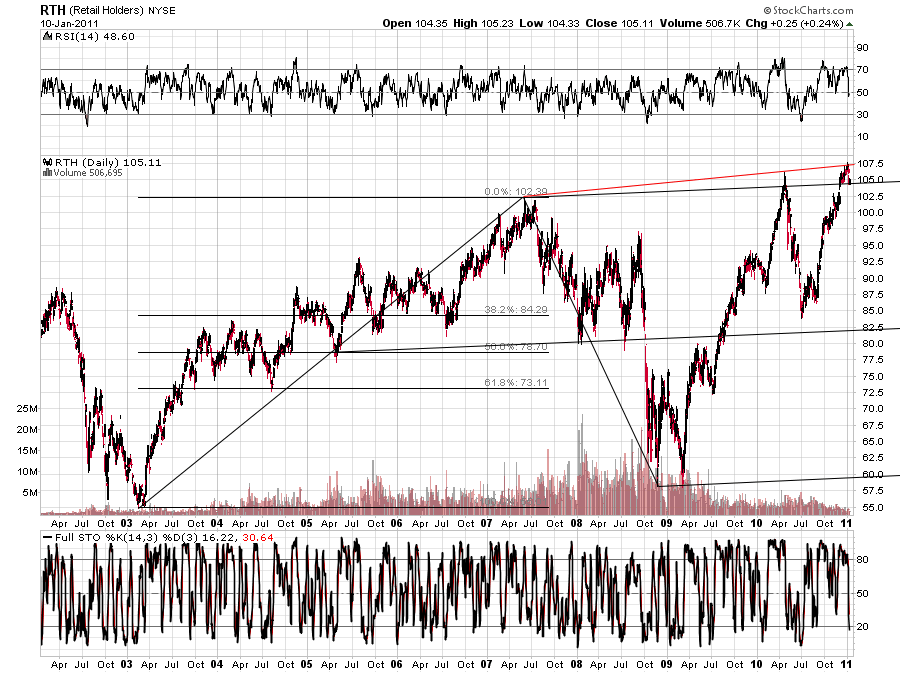
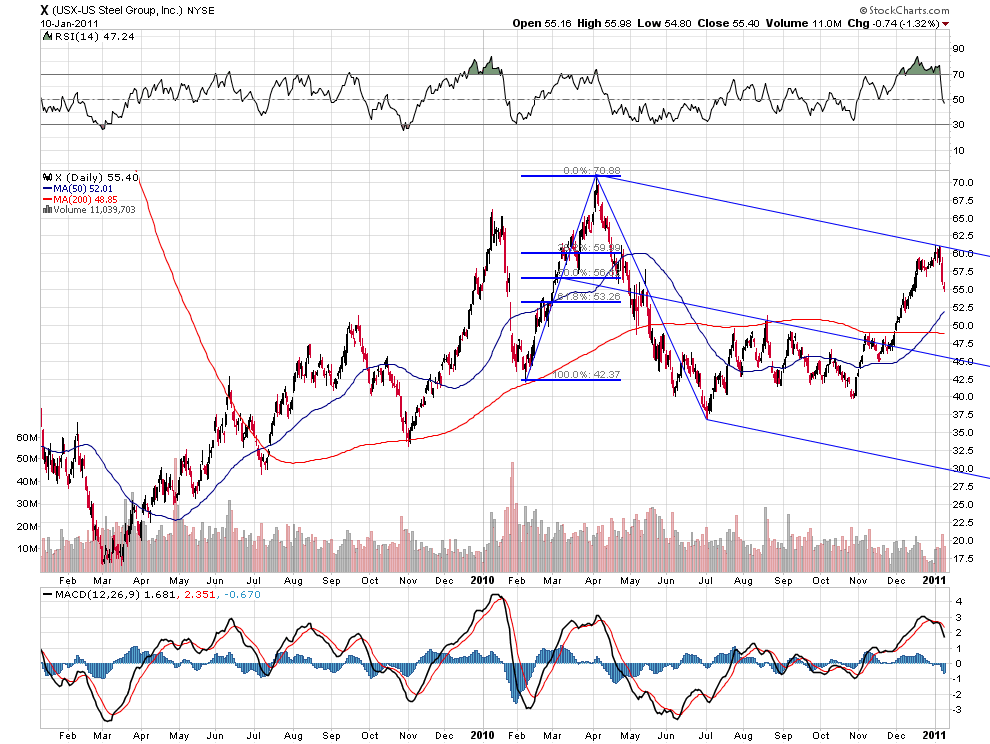
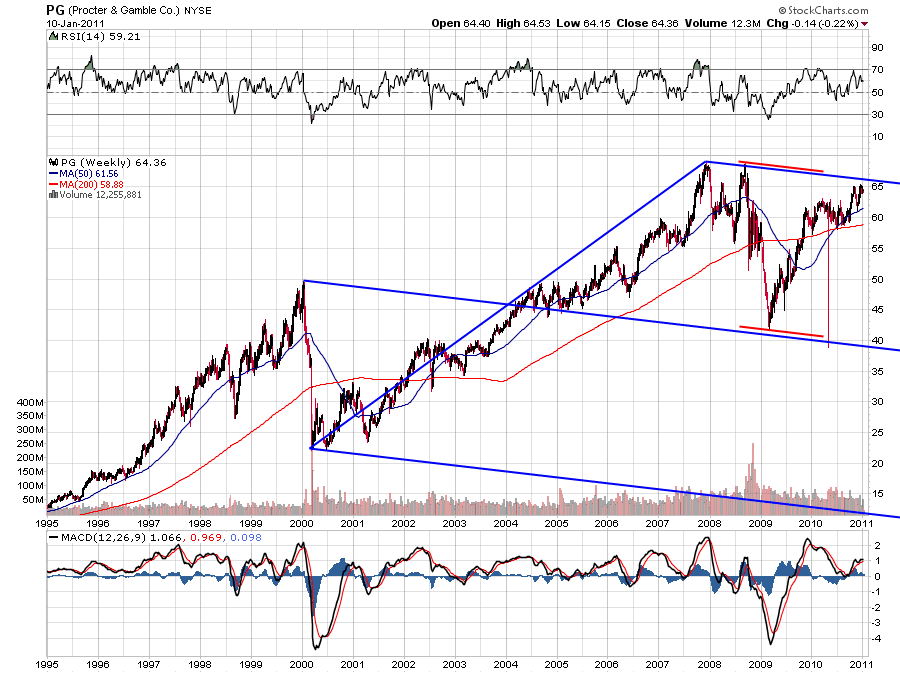
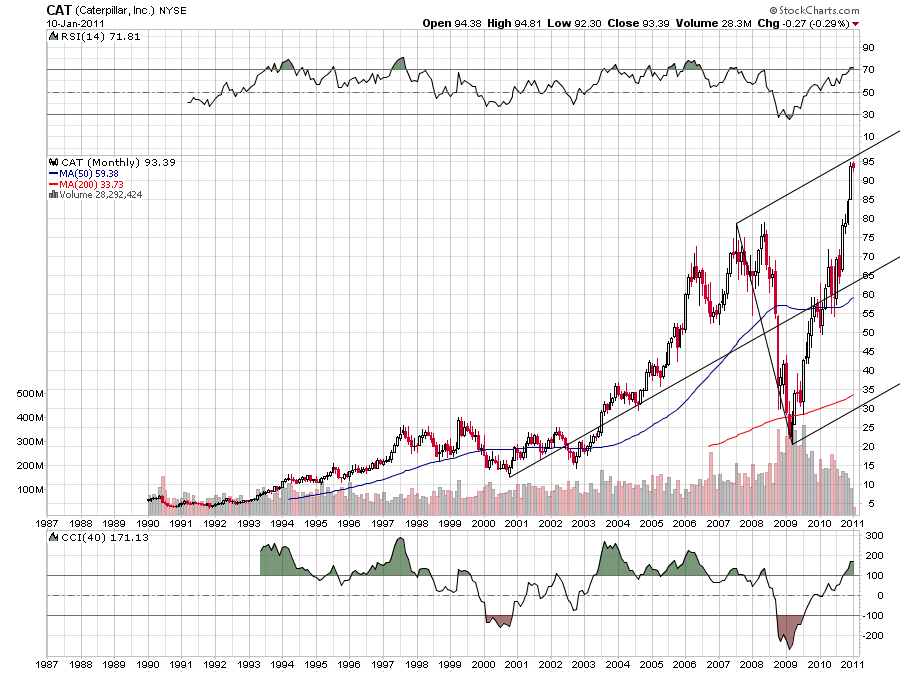
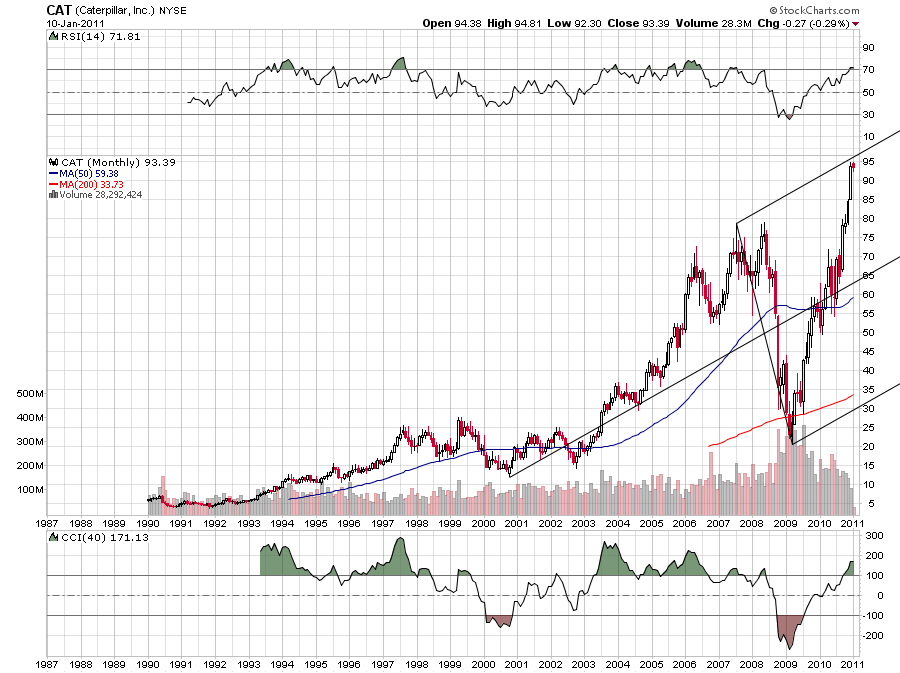
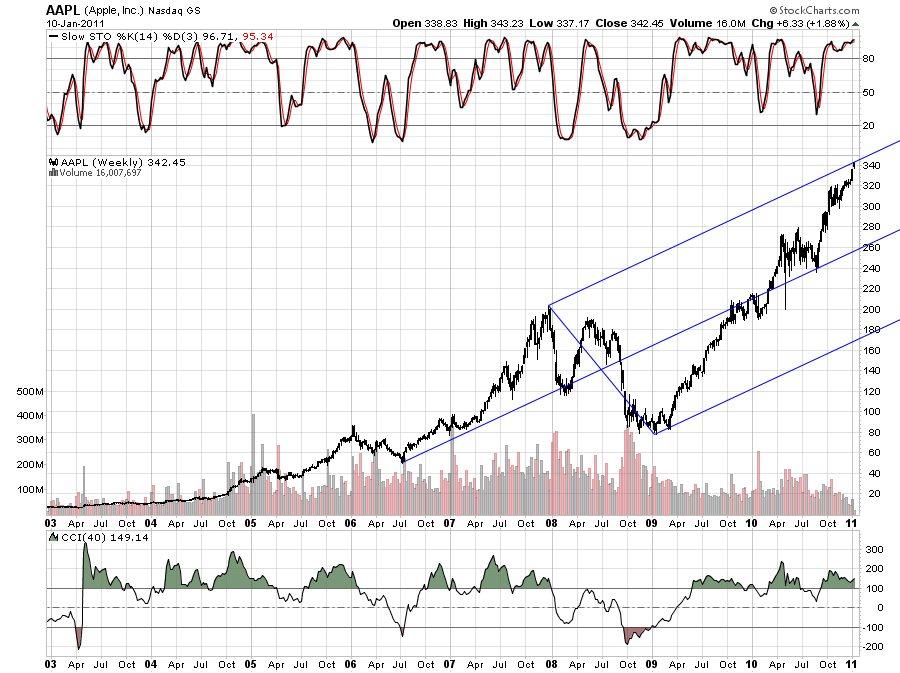
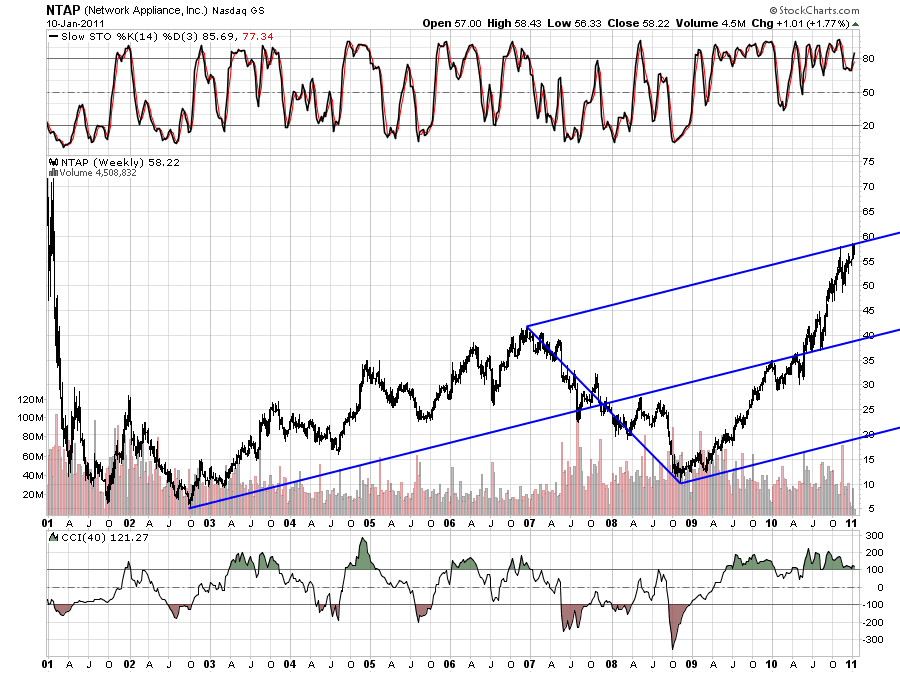
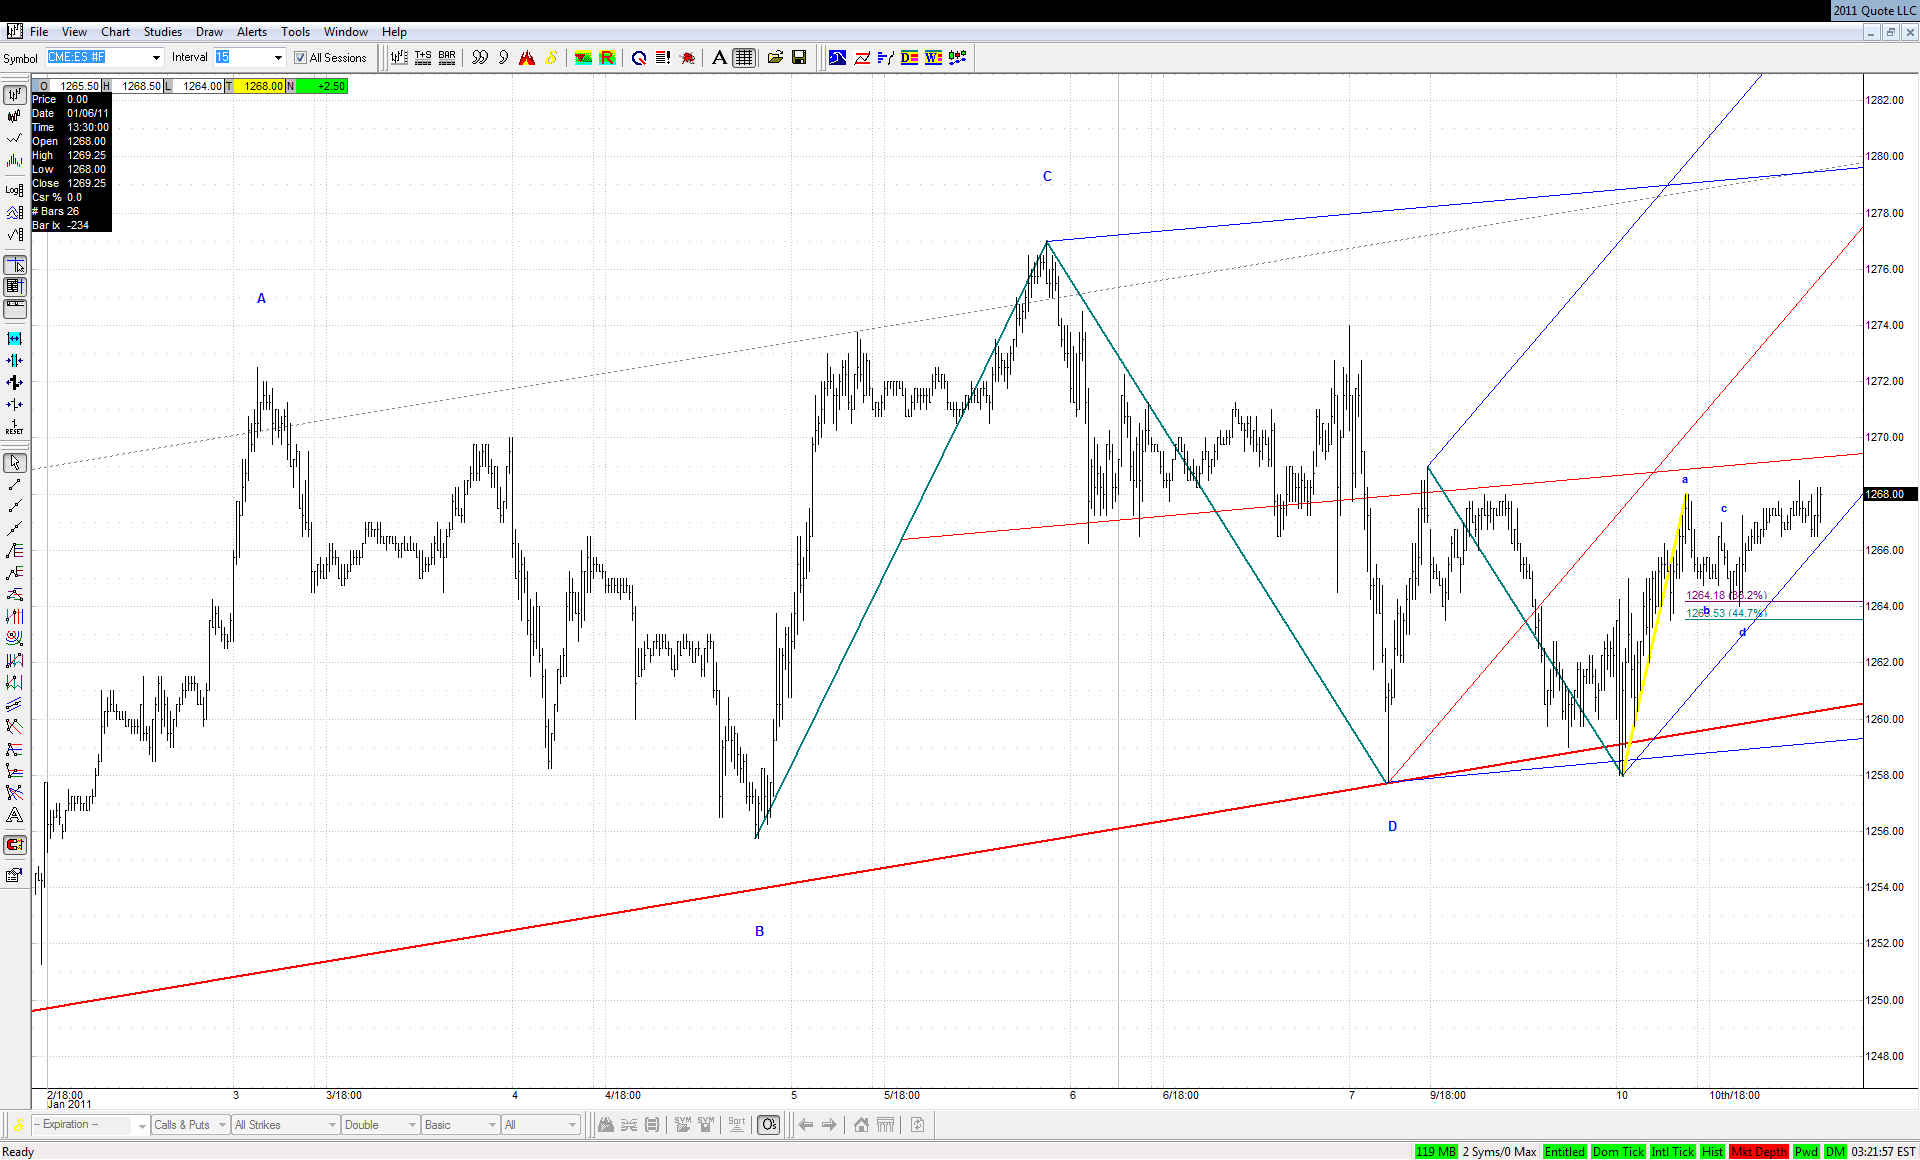
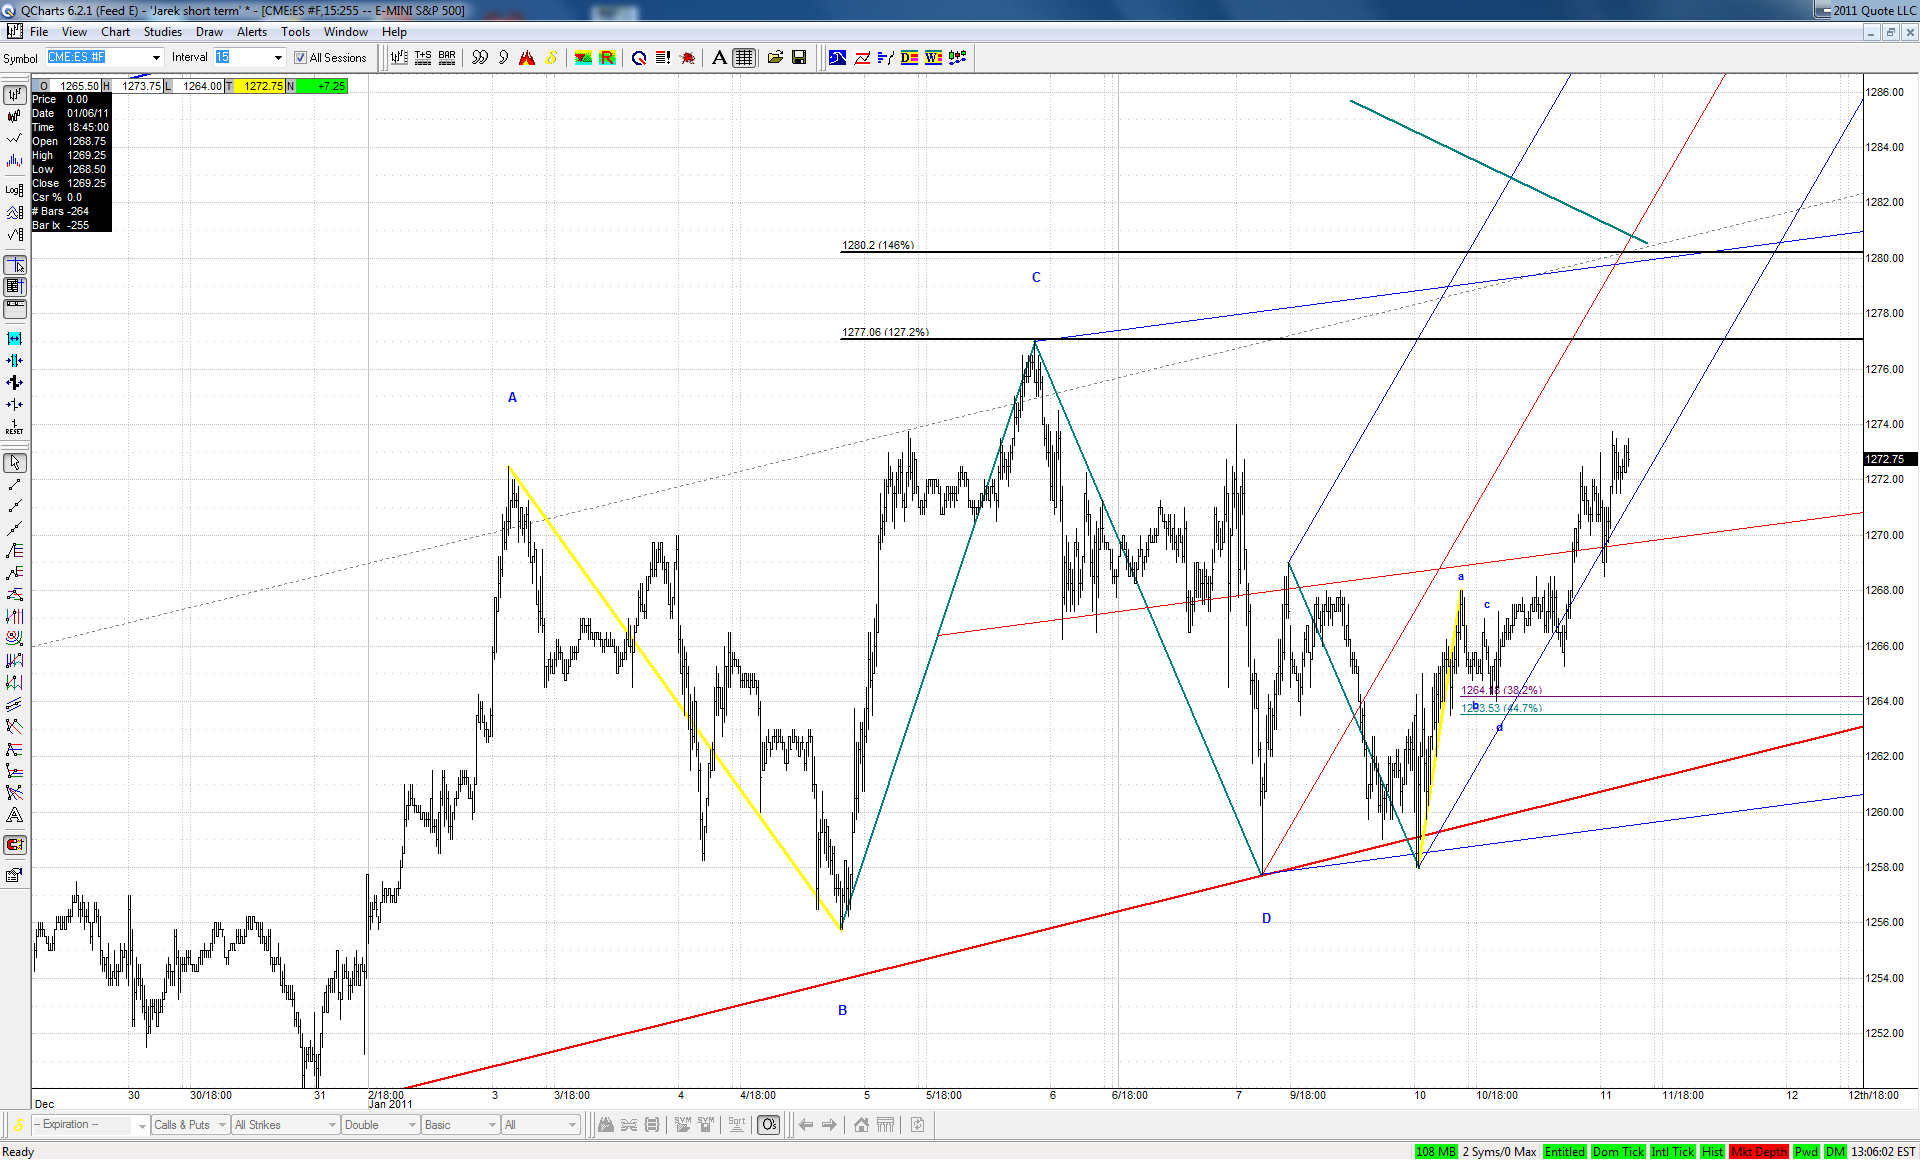
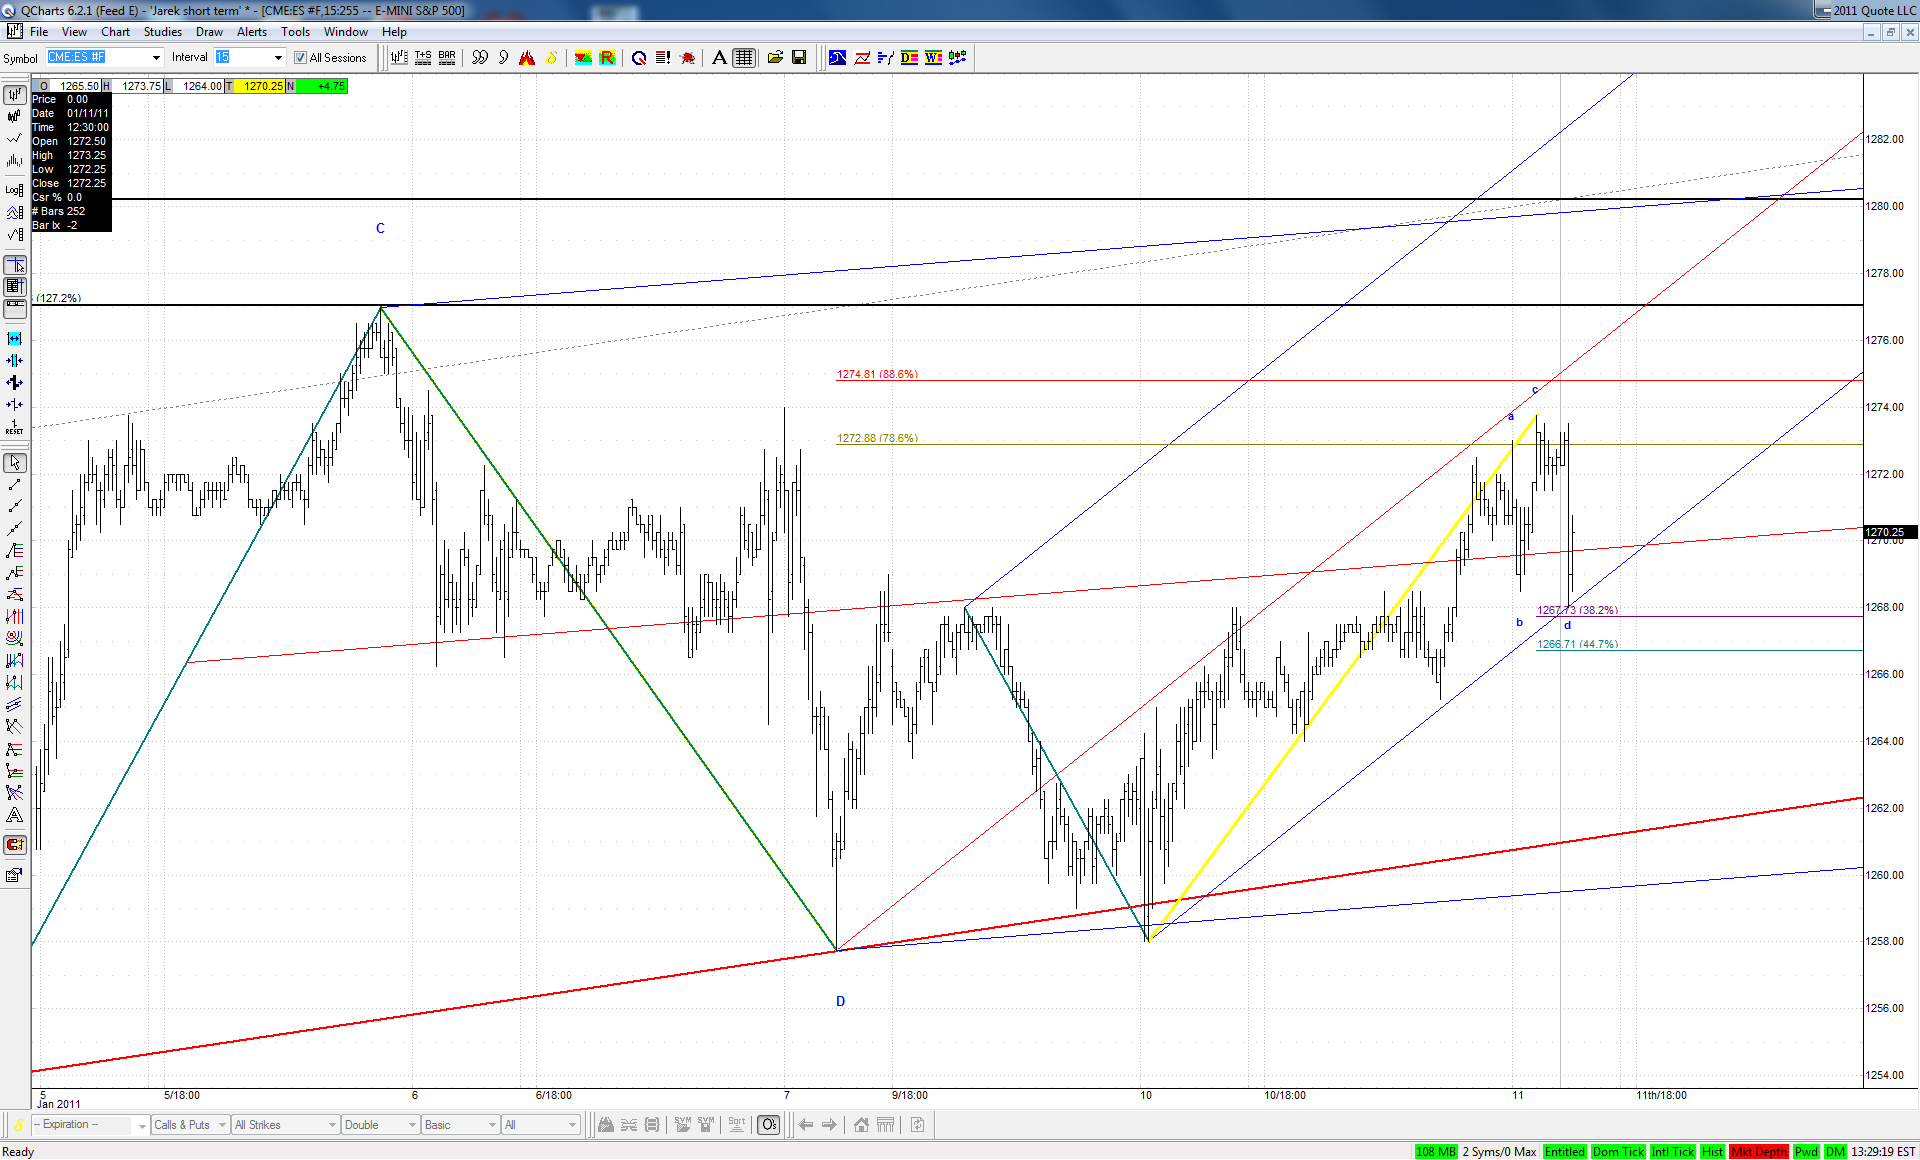
Major indexes hit last week 1.272 of the April - July decline. And they did it in a very interesting long term spot, as pointed already by Eric earlier in the week:
Lack of any reaction to the downside here would be quite surprising for me.
AL
albert
Rep: 99
Posts: 3,094
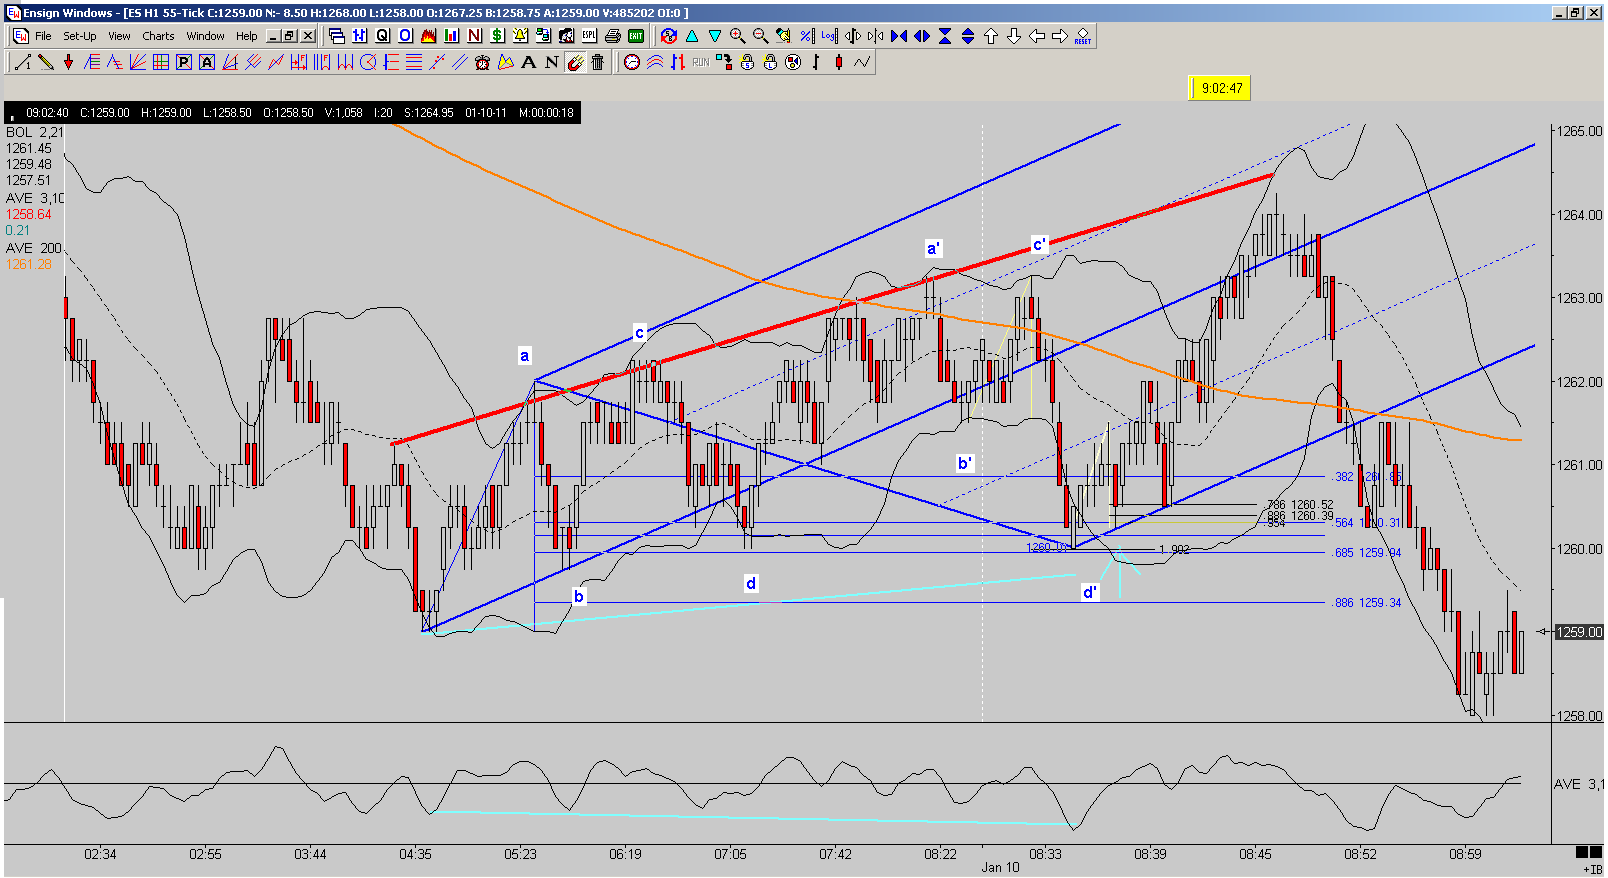
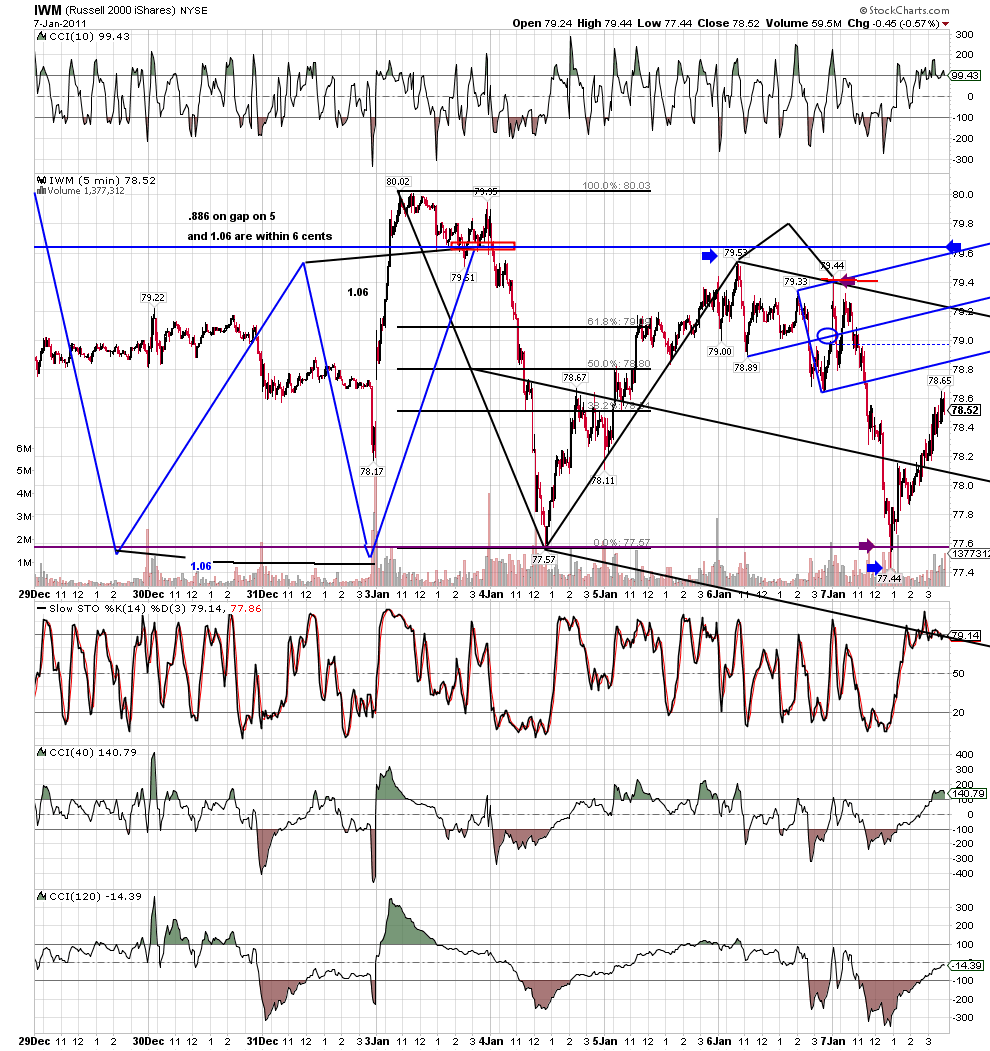
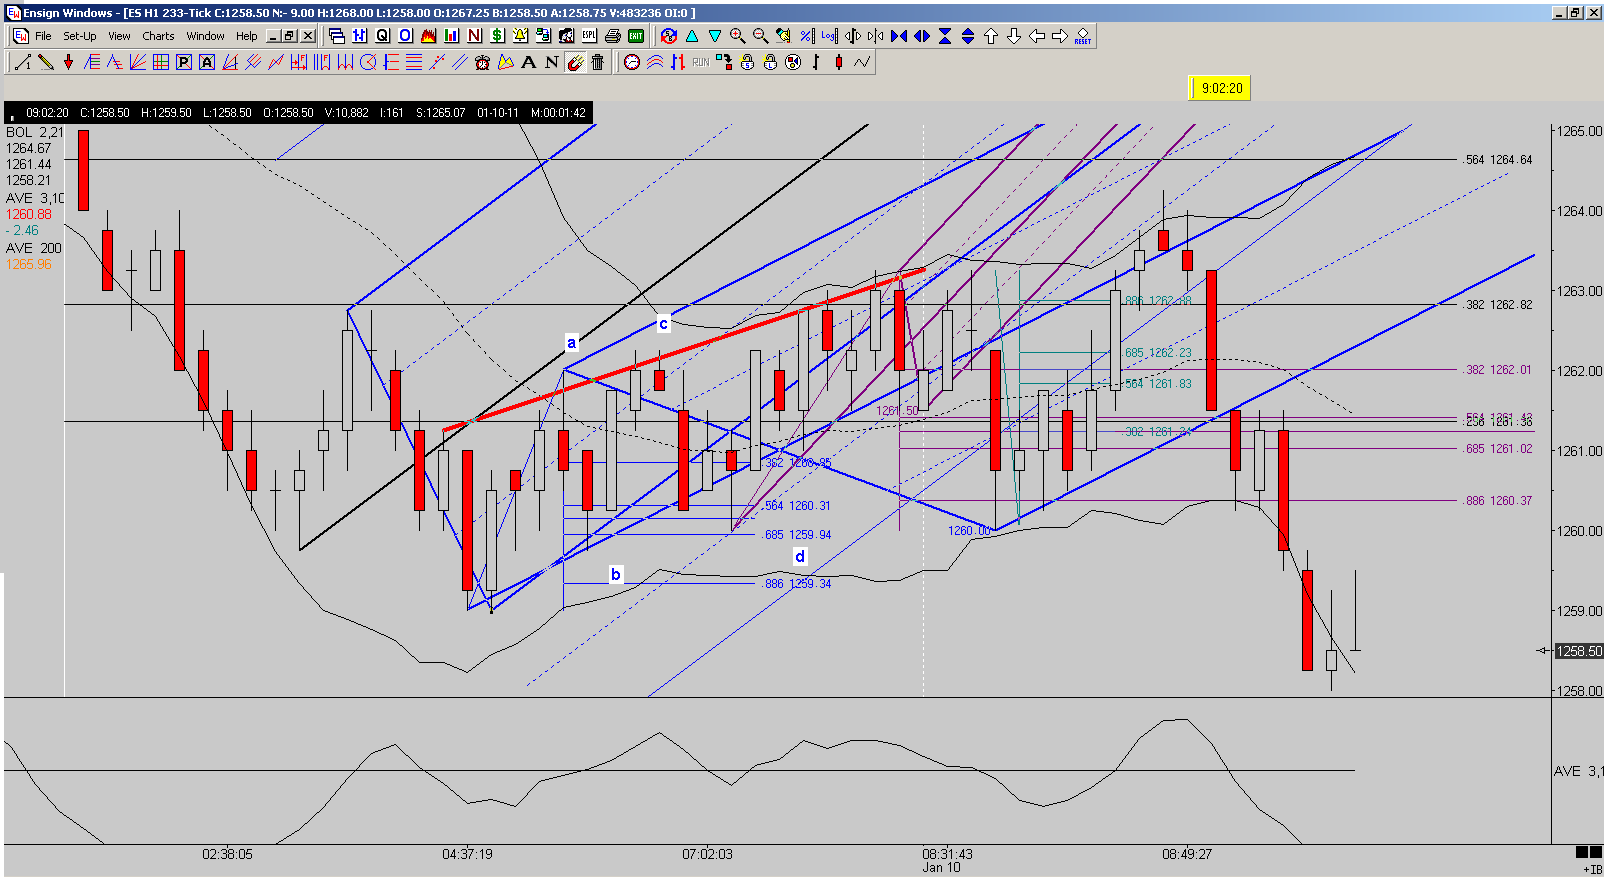
Kane TD ABCD off GLOBEX lo completing at 0.685 fibo on 233 tick chart. Spike Line formed through Points A & C of Kane TD ABCD. Price rose off Point D, could not get above spike line, formed a Kane DT ABCD (1.902 fibo) completing at 0.786 fibo. On 55 tick chart, blue upsloping ML set had 2 price touches at 0.954 & 0.886 fibo, and, per roofer's 80% mod rule, price reached ML & beyond, but could not make it past spike line. Very nice divergence in 3-10 SMA Oscillator at Point d'& Globex Lo.
Thank you to all the wonderful Kane Traders.
Al Kamego
Thank you to all the wonderful Kane Traders.
Al Kamego
JA
jarek
Rep: 94
Posts: 3,474
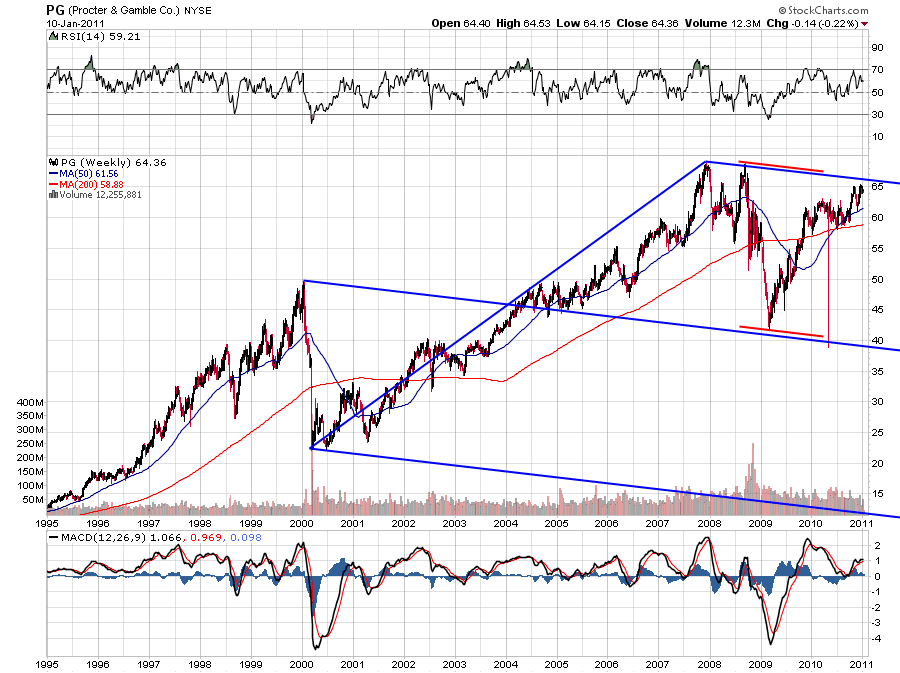
We can see on your P&G chart above that even the flash crash in May was right to the geometry...
JA
jarek
Rep: 94
Posts: 3,474
Originally posted by jarek
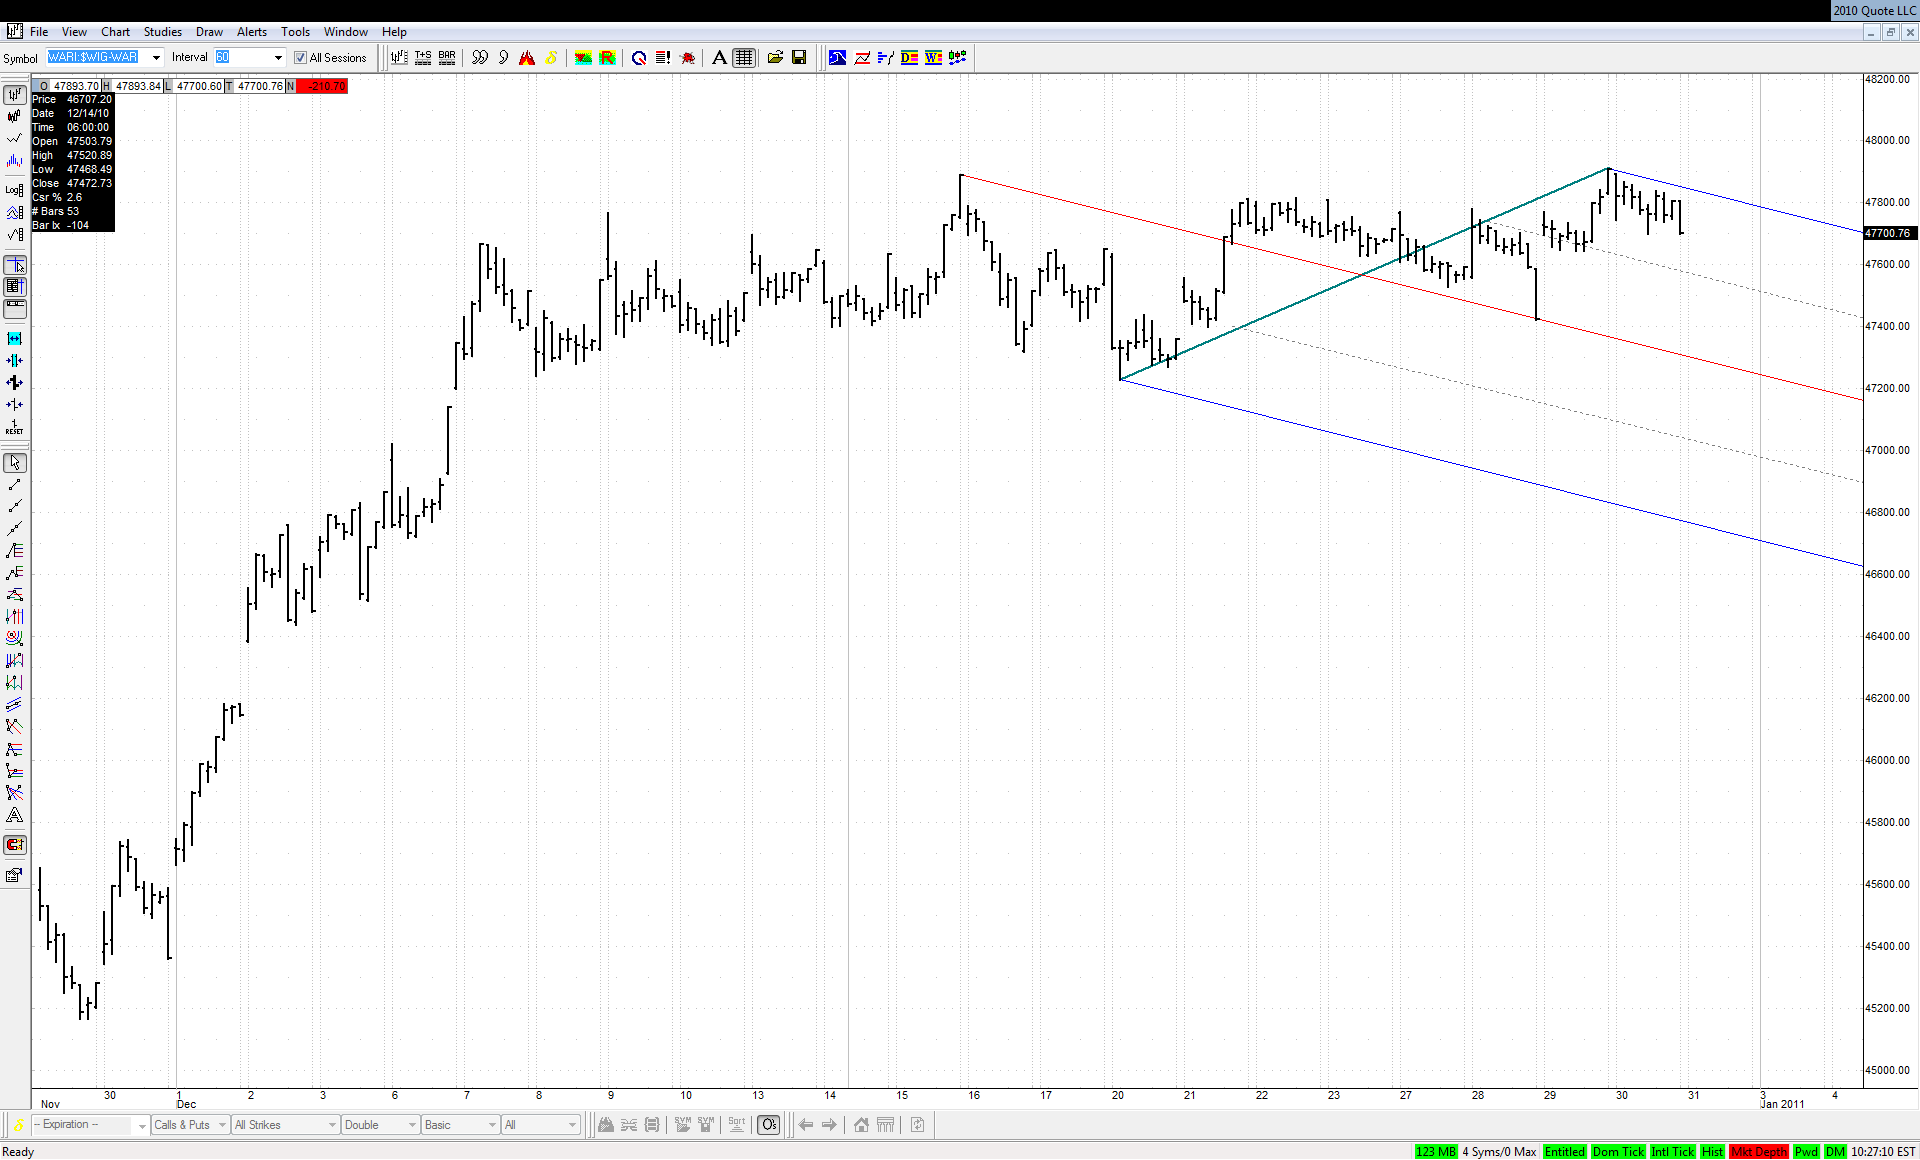
Yesterday I read in a local newspaper a discussion of analysts all arguing that taking into account the time of the year, the only possible direction for a breakout of this 3-weeks long narrow consolidation on the Warsaw Stock Exchange is of course up:
I'm not sure whether such a long consolidation might still be a part of Roofer's chimney setup, but if this vertical rise from the beginning of December is about to be retraced now, than the turn of the year may bring a surprise for the bulls around the world (I don't believe we can drop without a company)
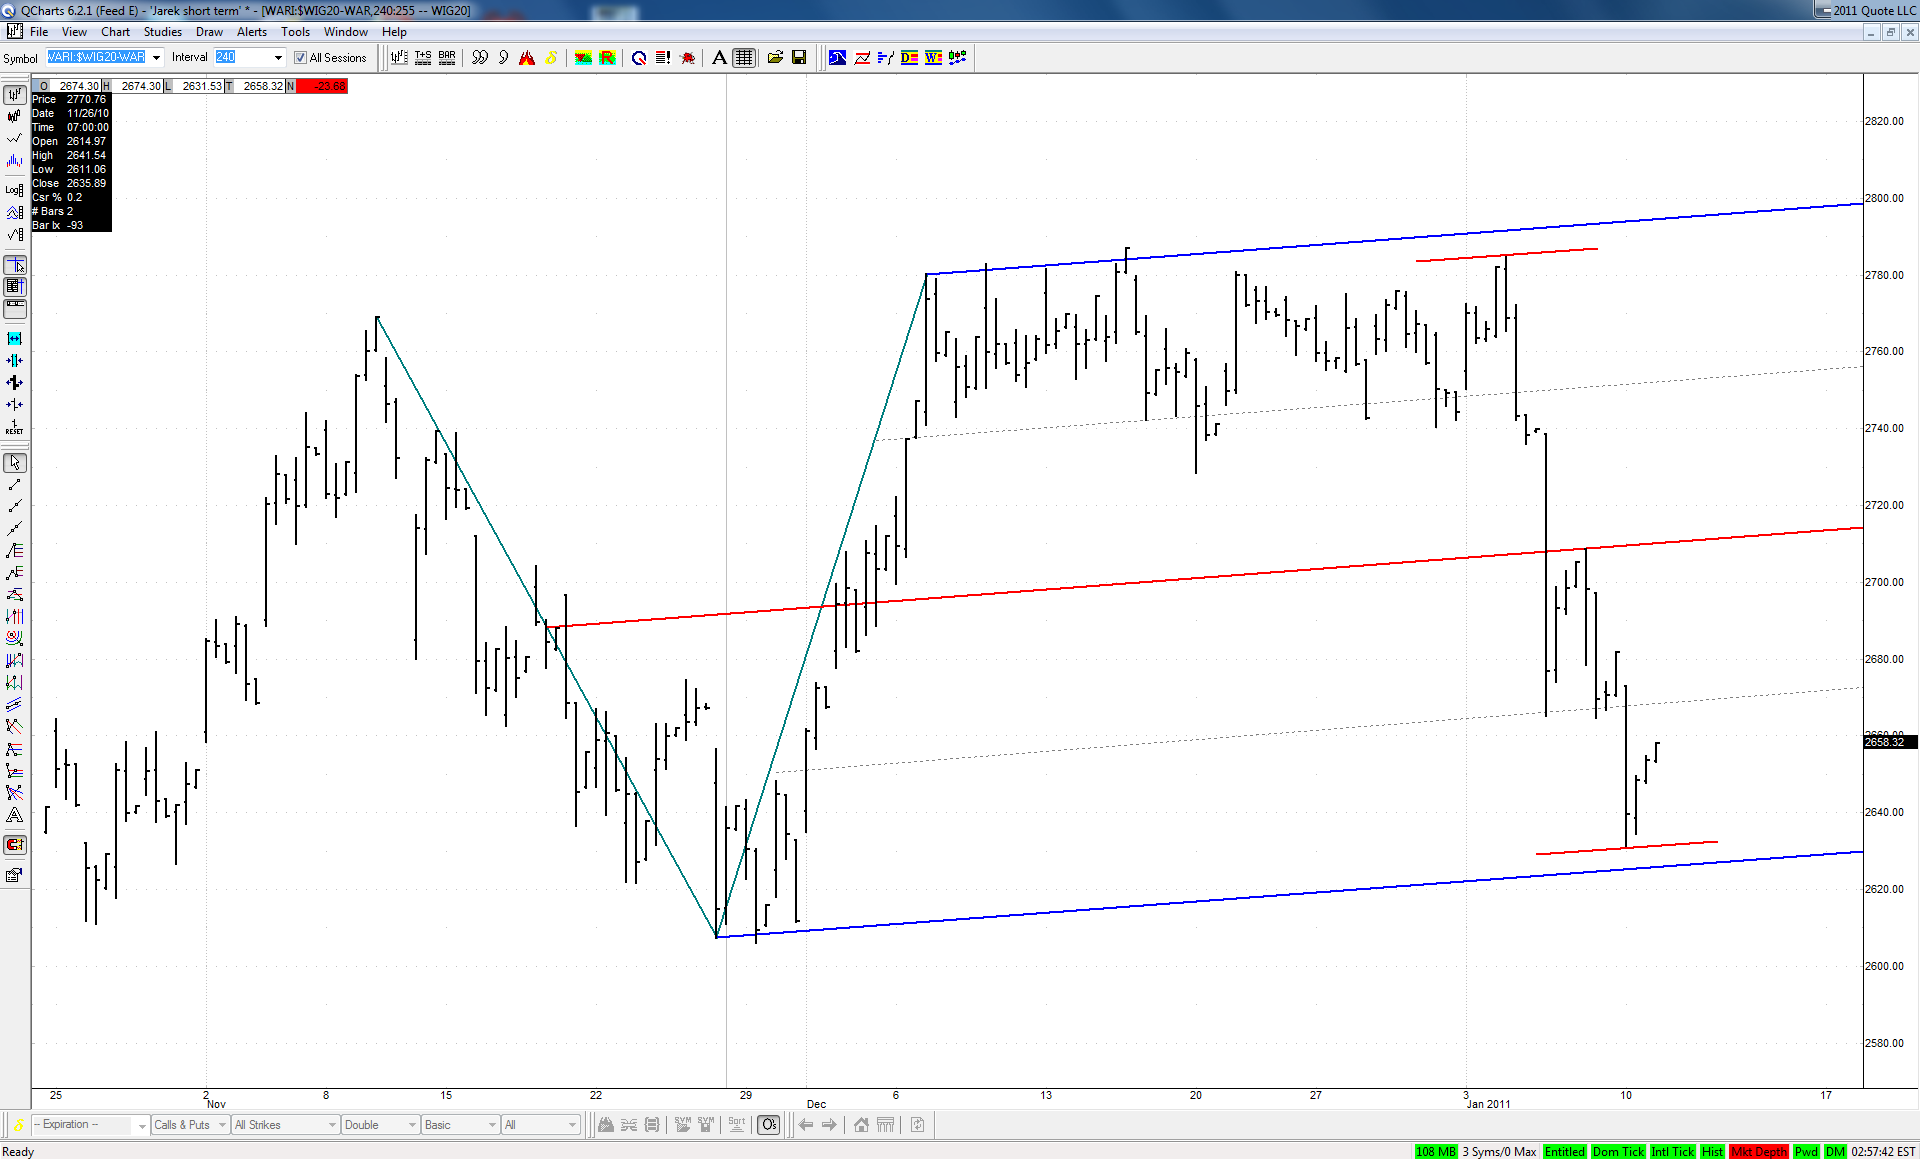
And yet we've been able to drop on our own to retrace the previous capitulation move to the upside: