MyPivots
Sign In
JA
jarek
Rep: 94
Posts: 3,474
ES went exactly to the target area for the move off the bullish DT ABCD shown here on Friday:

Click image for original size
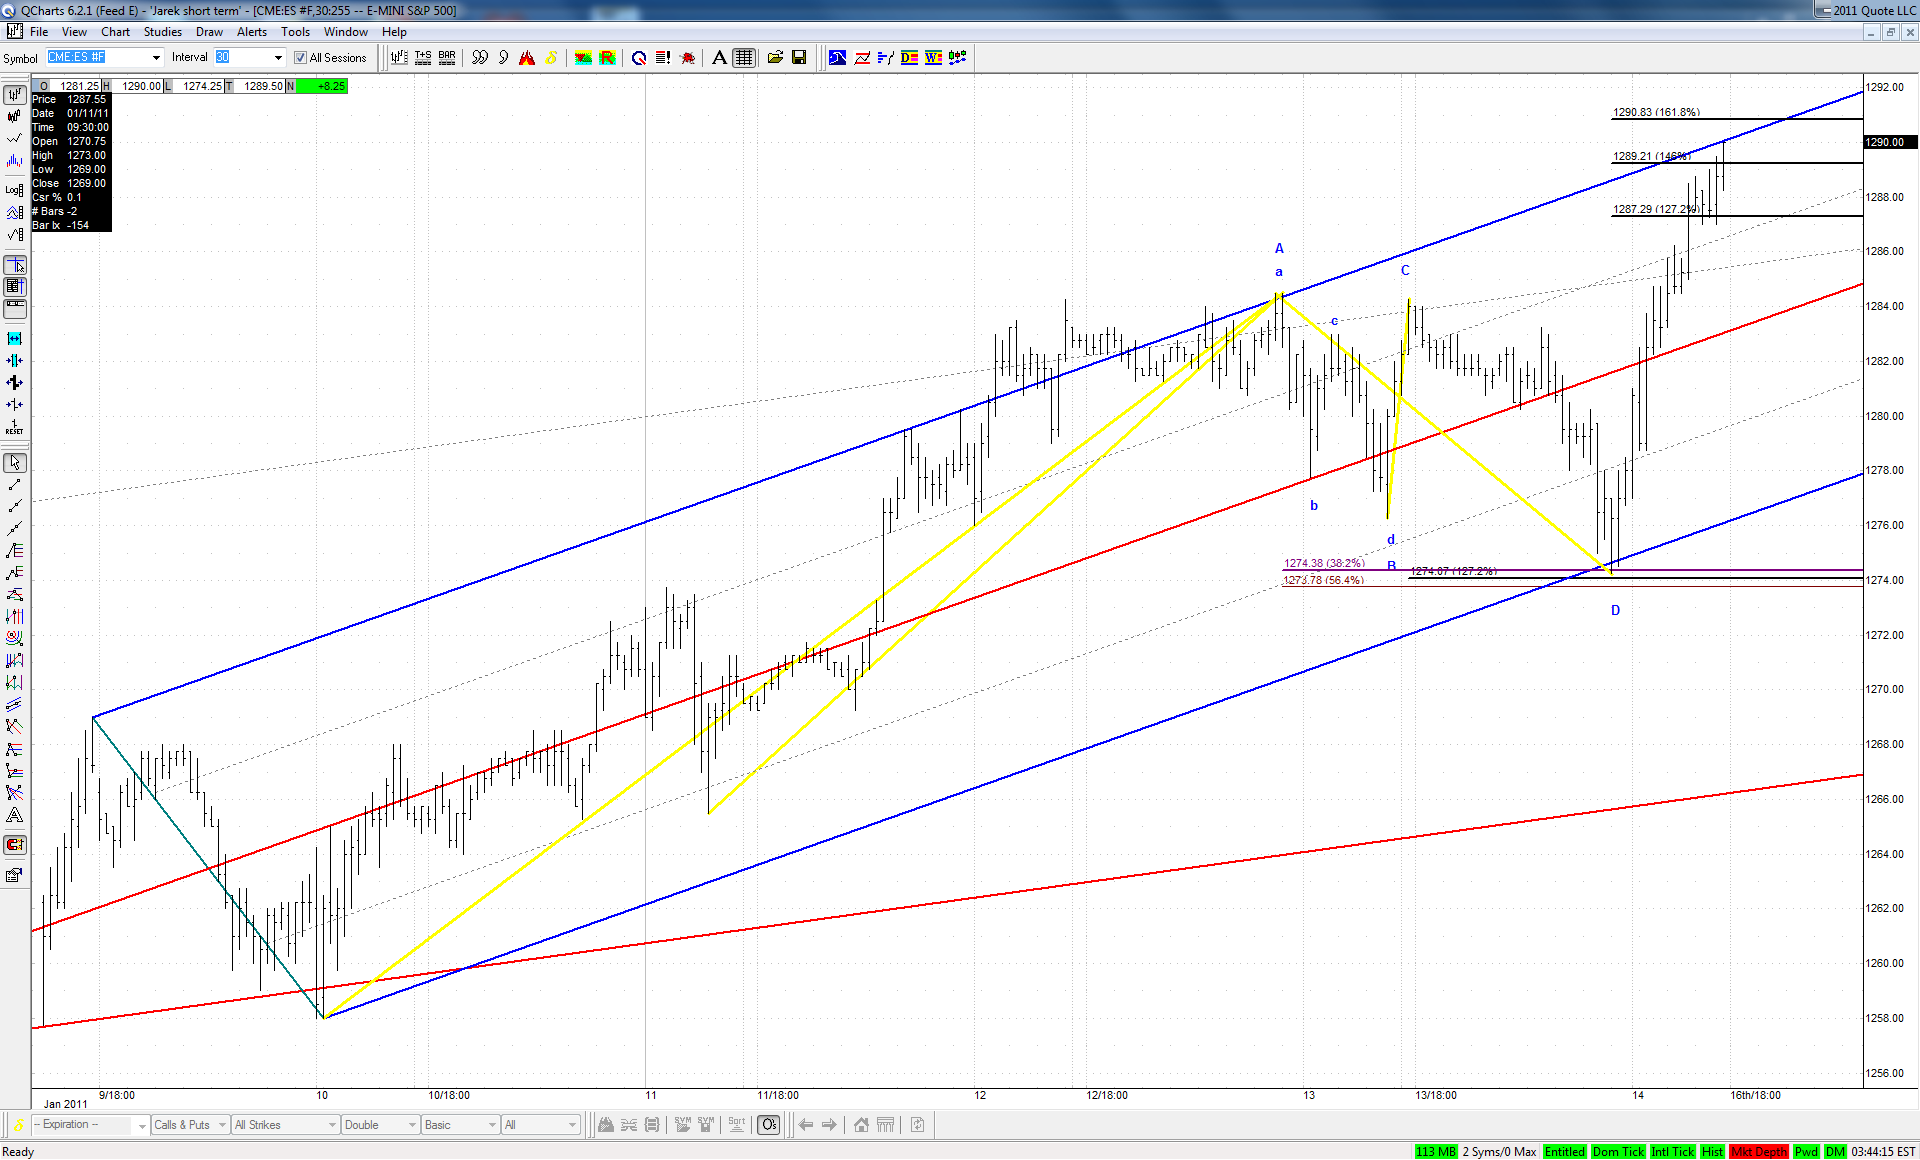


It's also in Eric's long term area and within my last weekend's long term setup.
All this suggest that we should see at least a correction during this relentless move up. But isn't this exactly what was expected before last week and many more weeks in the recent past in which the market just continued to grind higher and higher? ...
JA
jarek
Rep: 94
Posts: 3,474
Well done Eric! You identified the turn area spot on and much in advance. Let's now see if it really was a major turn.
JA
jarek
Rep: 94
Posts: 3,474
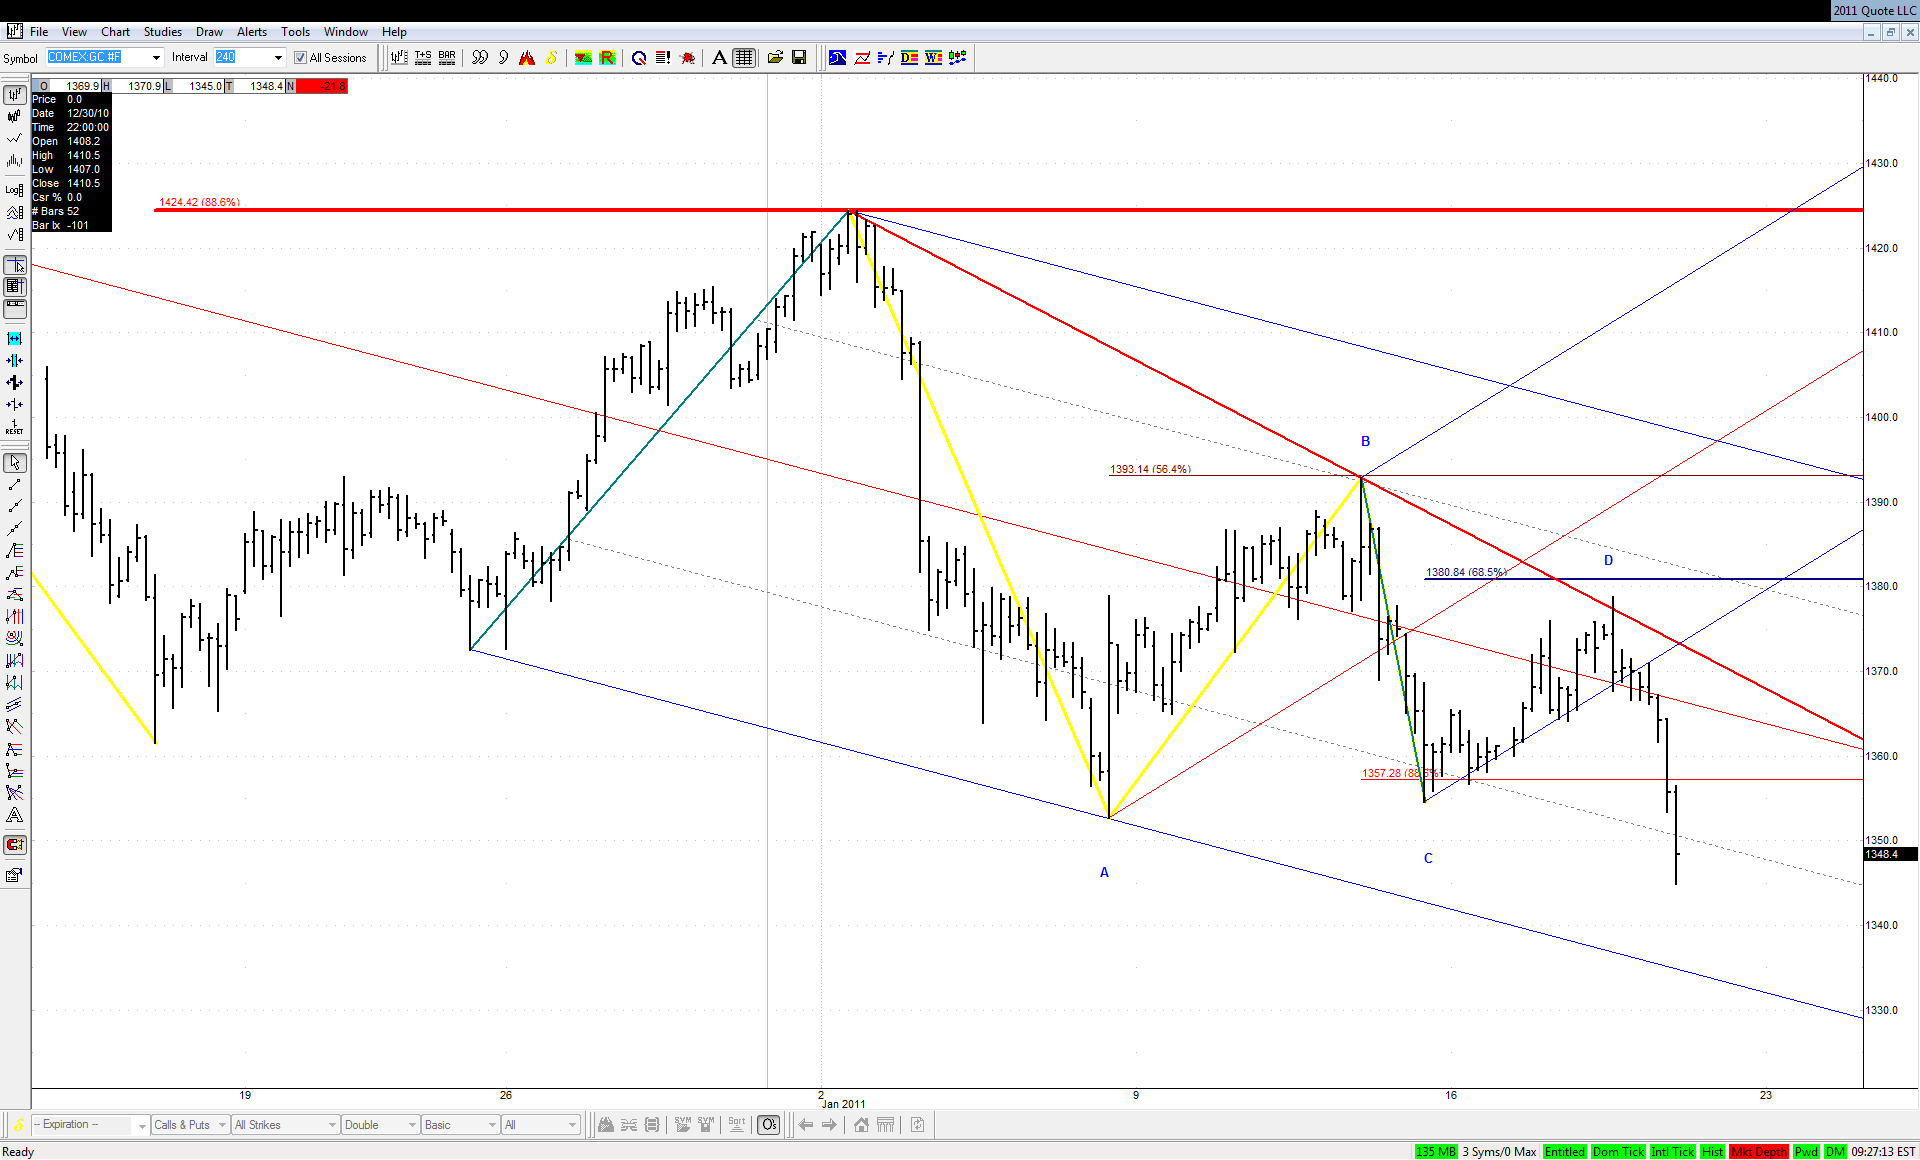
So Gold decided to continue its move down of the all important .886. I'm not sure if we can still call the last correction a bearish 4PT (with a slight overshot on .886 at point C and a slight undershot on .685 at point D), but this downsloping TL was clearly it:


Click image for original size


And also the TL creep ended up as it did in good old times...
JA
jarek
Rep: 94
Posts: 3,474
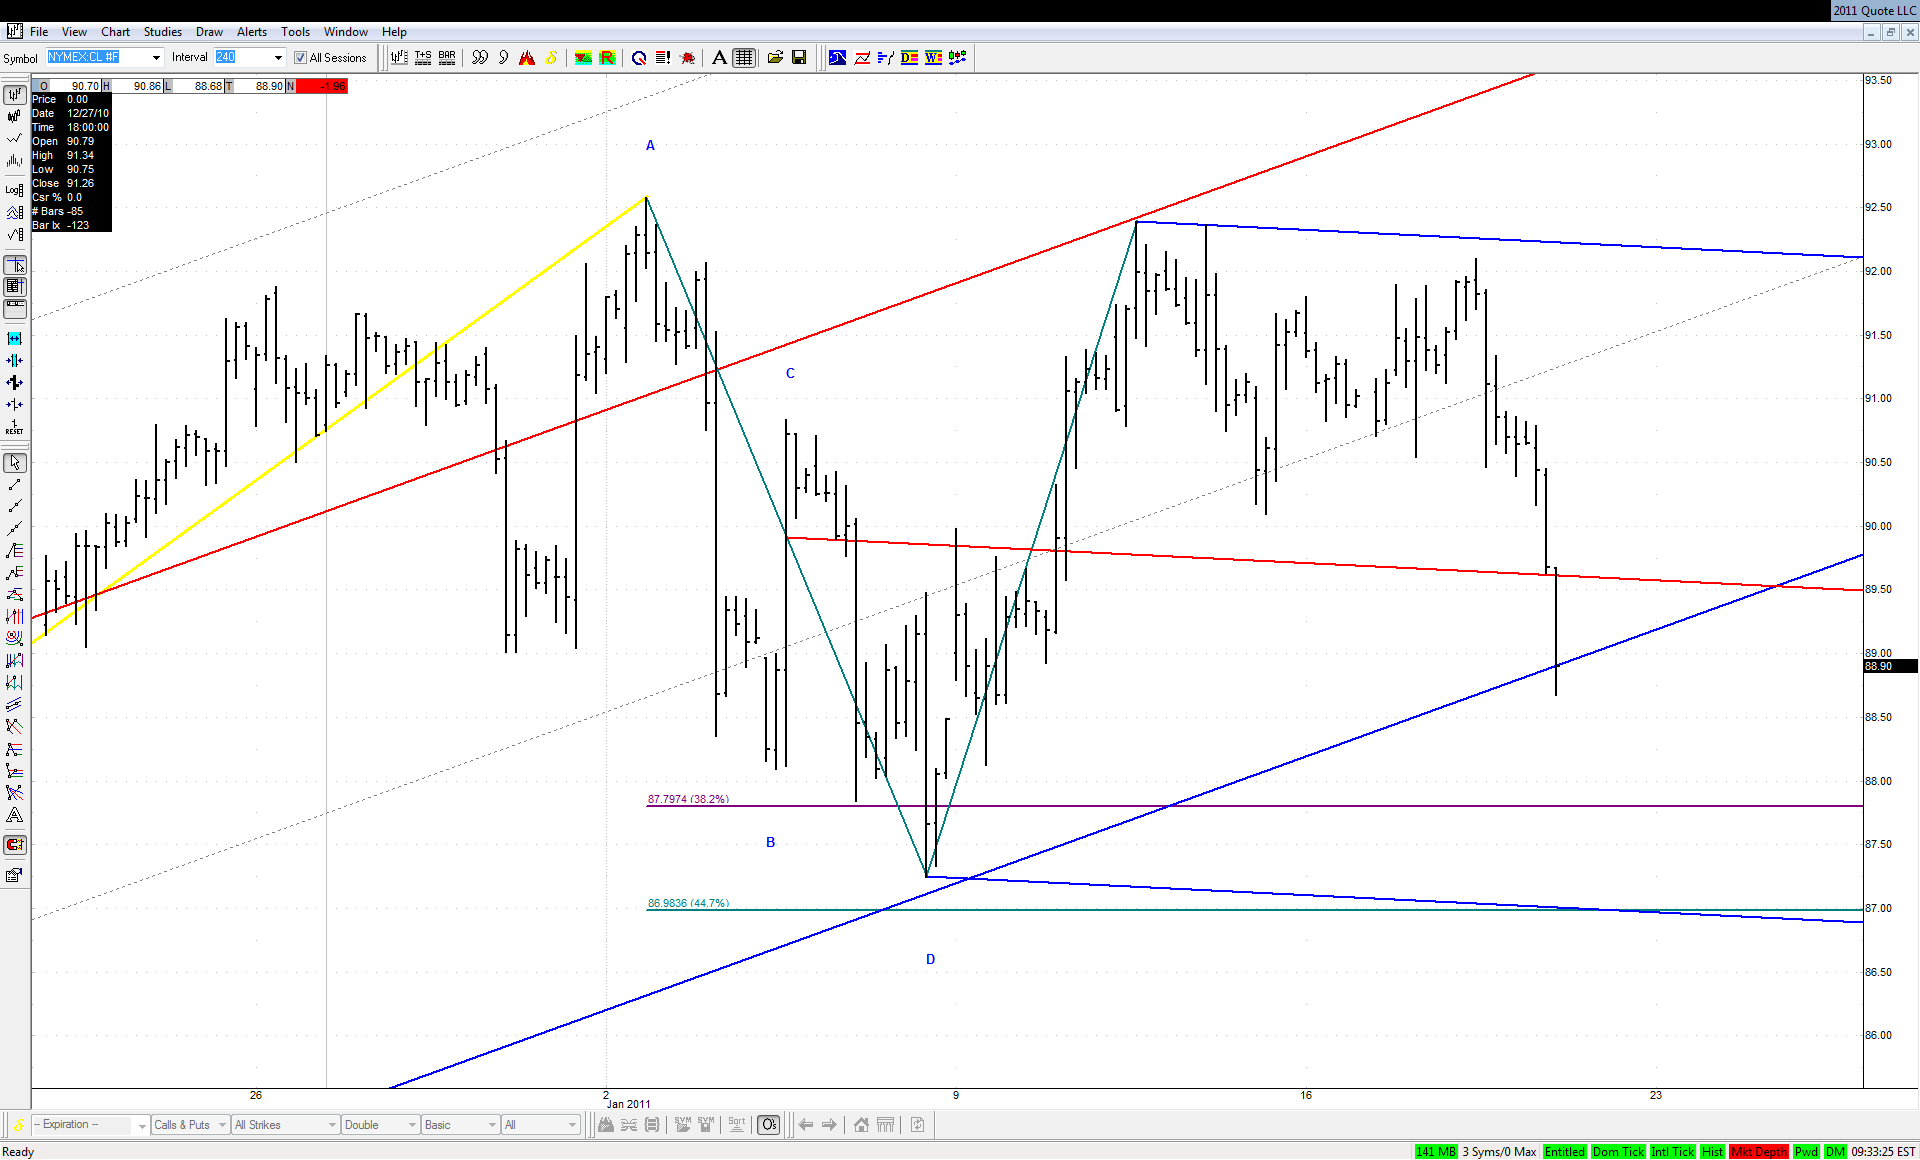
Moment of truth in Crude: will the upsloping set take over here, or will the Schiff set play out to its lower ML after test and retest at upper ML:


Click image for original size


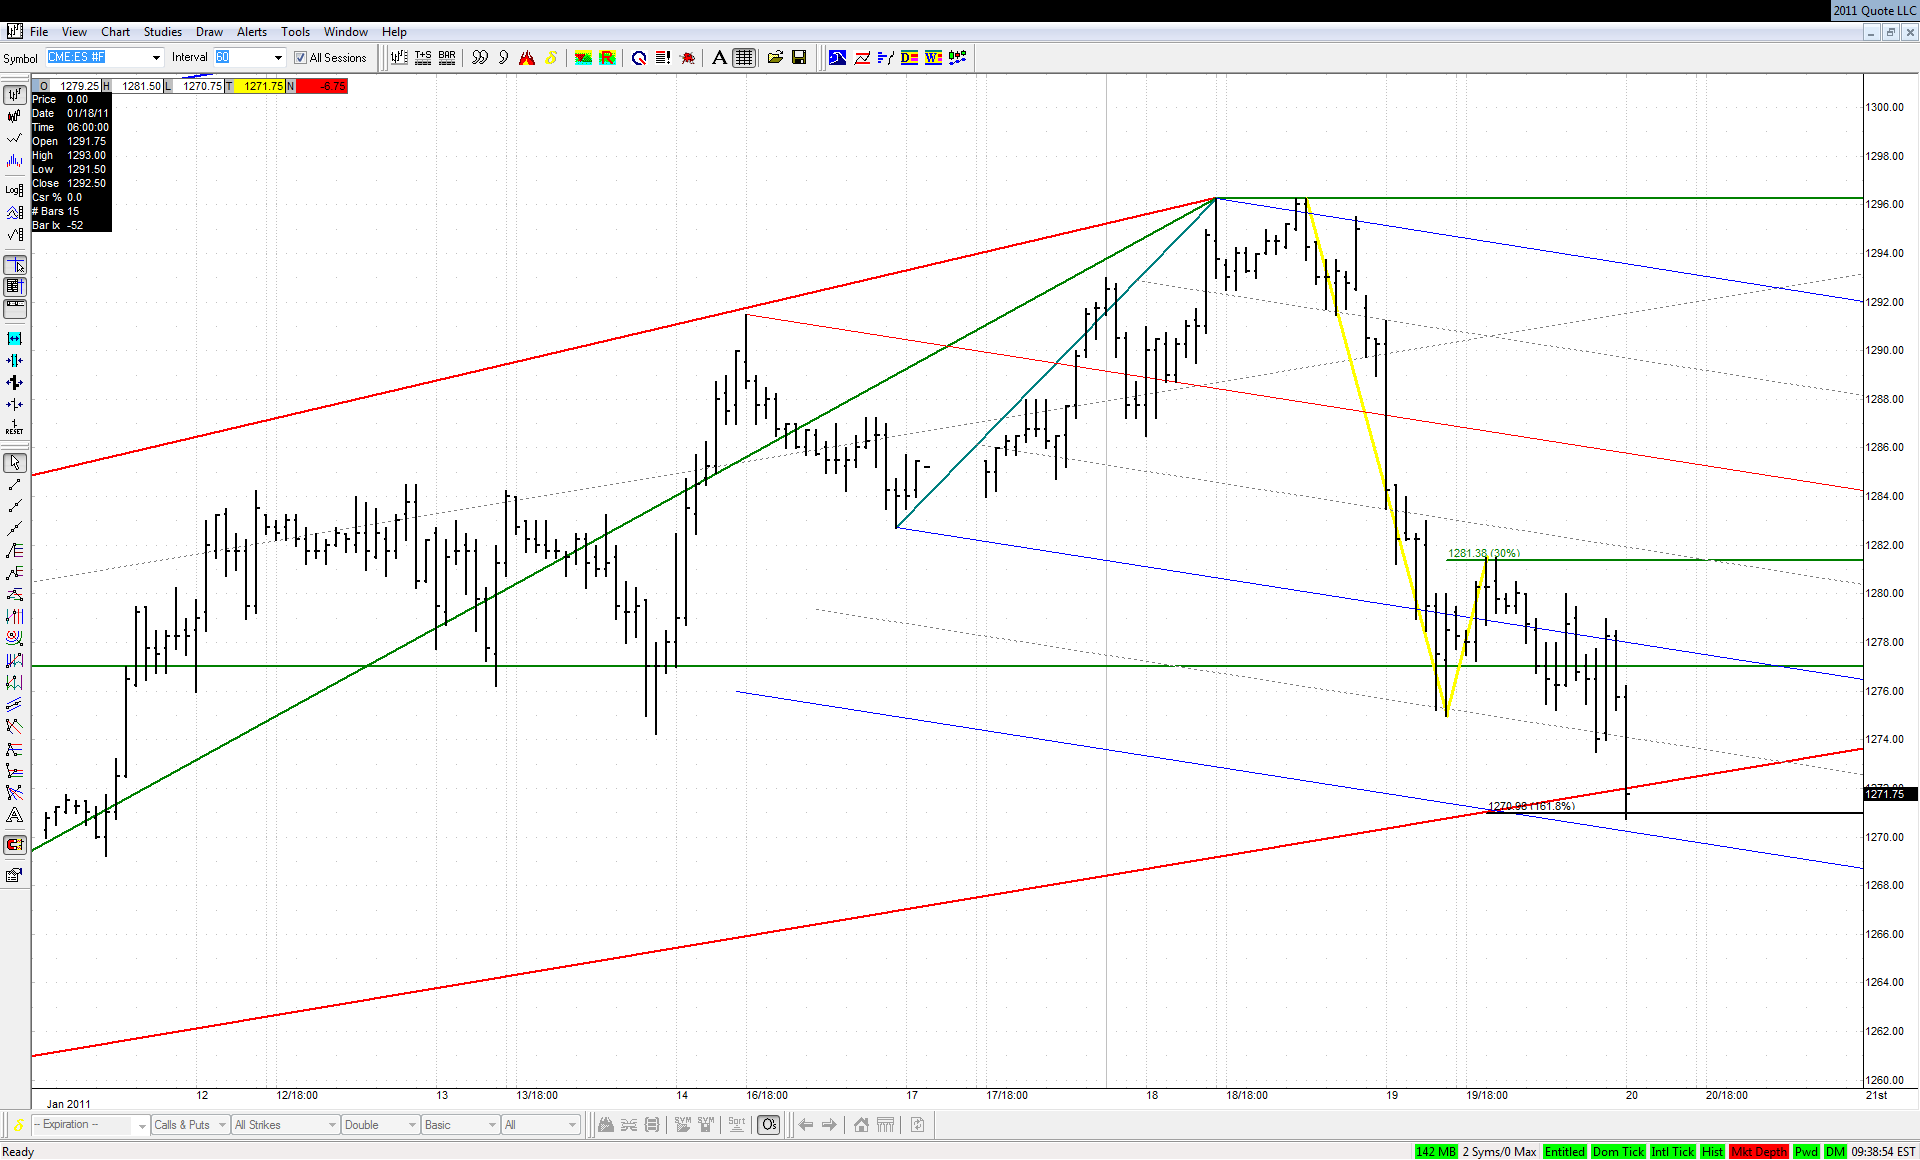
Similar setup in ES yesterday ended up with the journey all the way down to the lower ML
JA
jarek
Rep: 94
Posts: 3,474
Originally posted by jarek

Was the green line it or is the all important upsloping ML calling?


Looks like it really was calling:

Click image for original size
AL
albert
Rep: 99
Posts: 3,094
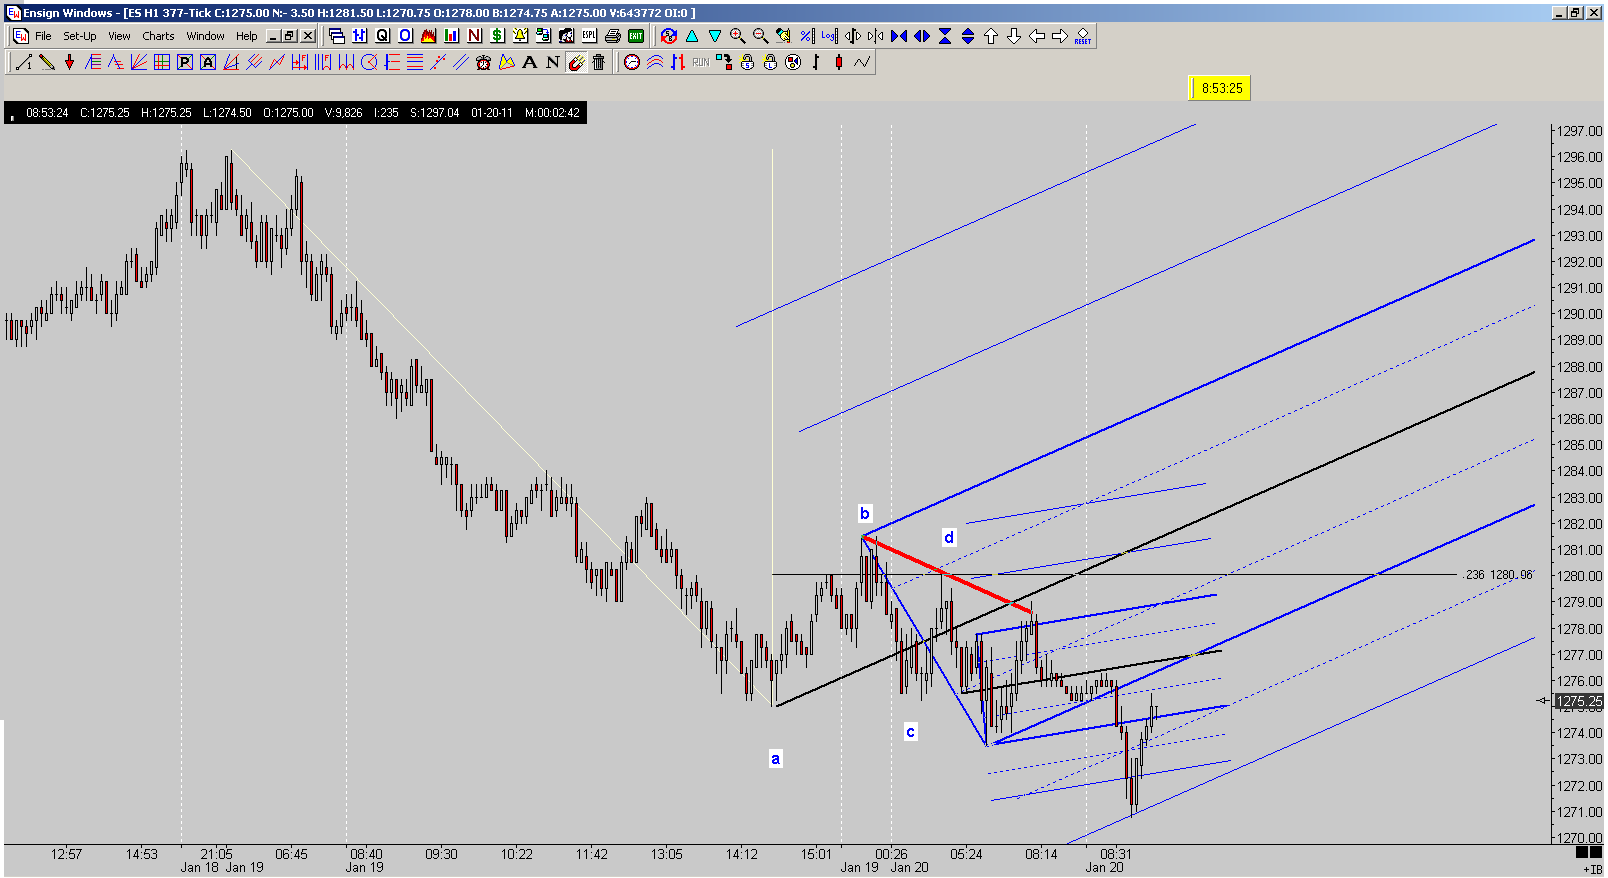
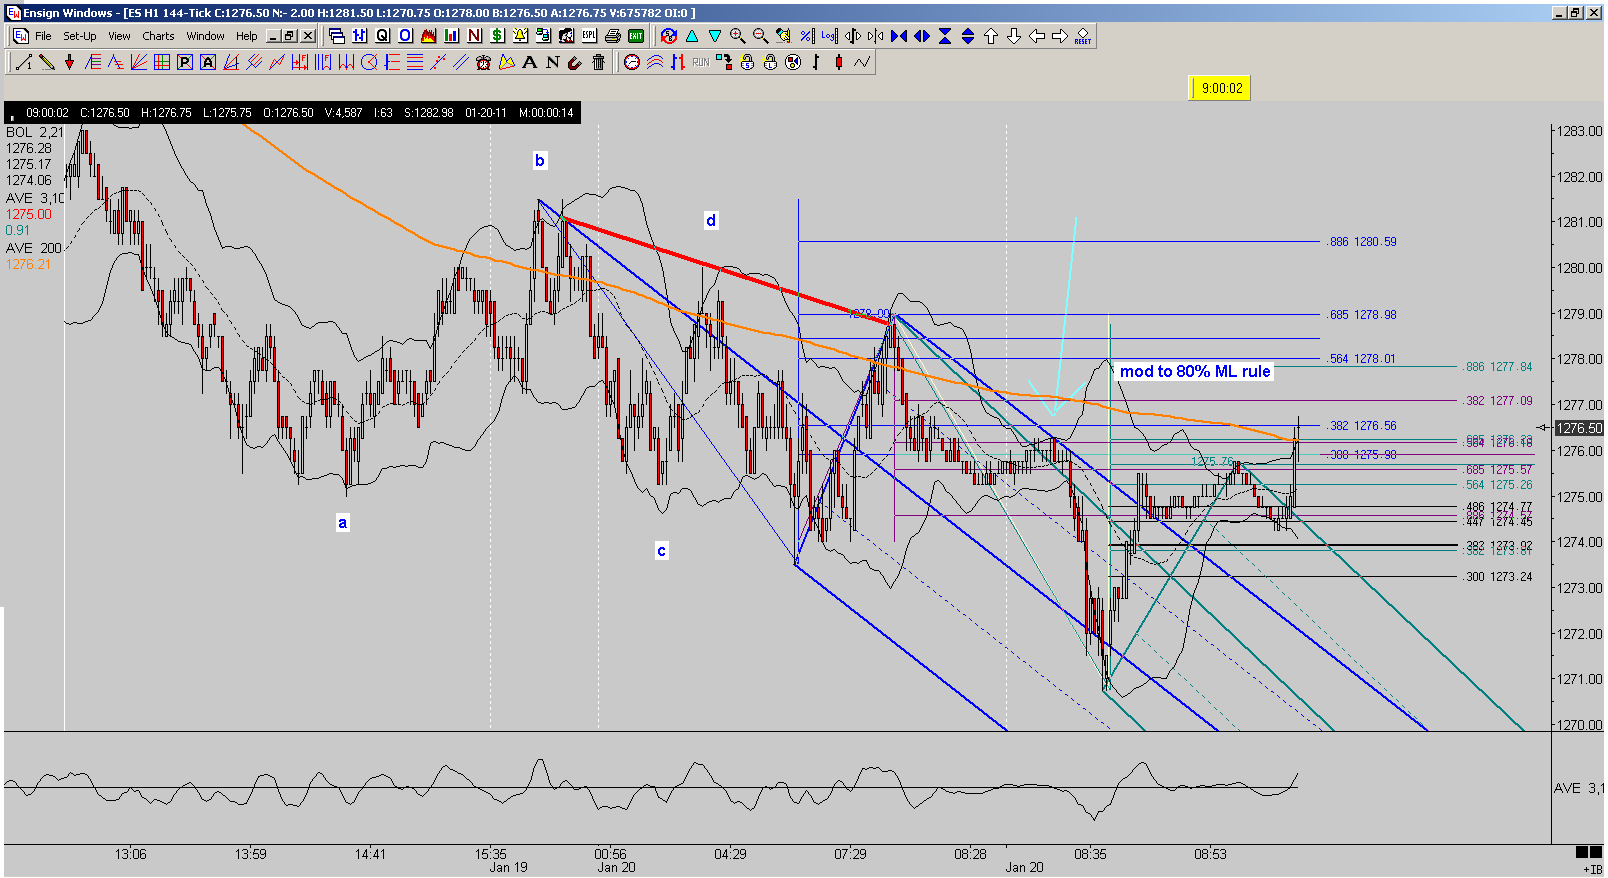
Kane 4 PCP, followed by a 0.685 fibo retrace of decline from Point D. ML set based on spike line. The "Mod to Tim's 80% rule" at 0.382 fibo worked well! Thanks to all the Kane Traders. Kane Trading rocks!

Al Kamego


Click image for original size

Click image for original size
ER
EricD
Rep: 63
Posts: 692
Thanks Jarek....I think it is not "THE TOP " but maybe a larger correction to throw it up to that 1332 number(area of 1332-1365) that Jim has been saying for months.
Originally posted by jarek

Well done Eric! You identified the turn area spot on and much in advance. Let's now see if it really was a major turn.
JA
jarek
Rep: 94
Posts: 3,474
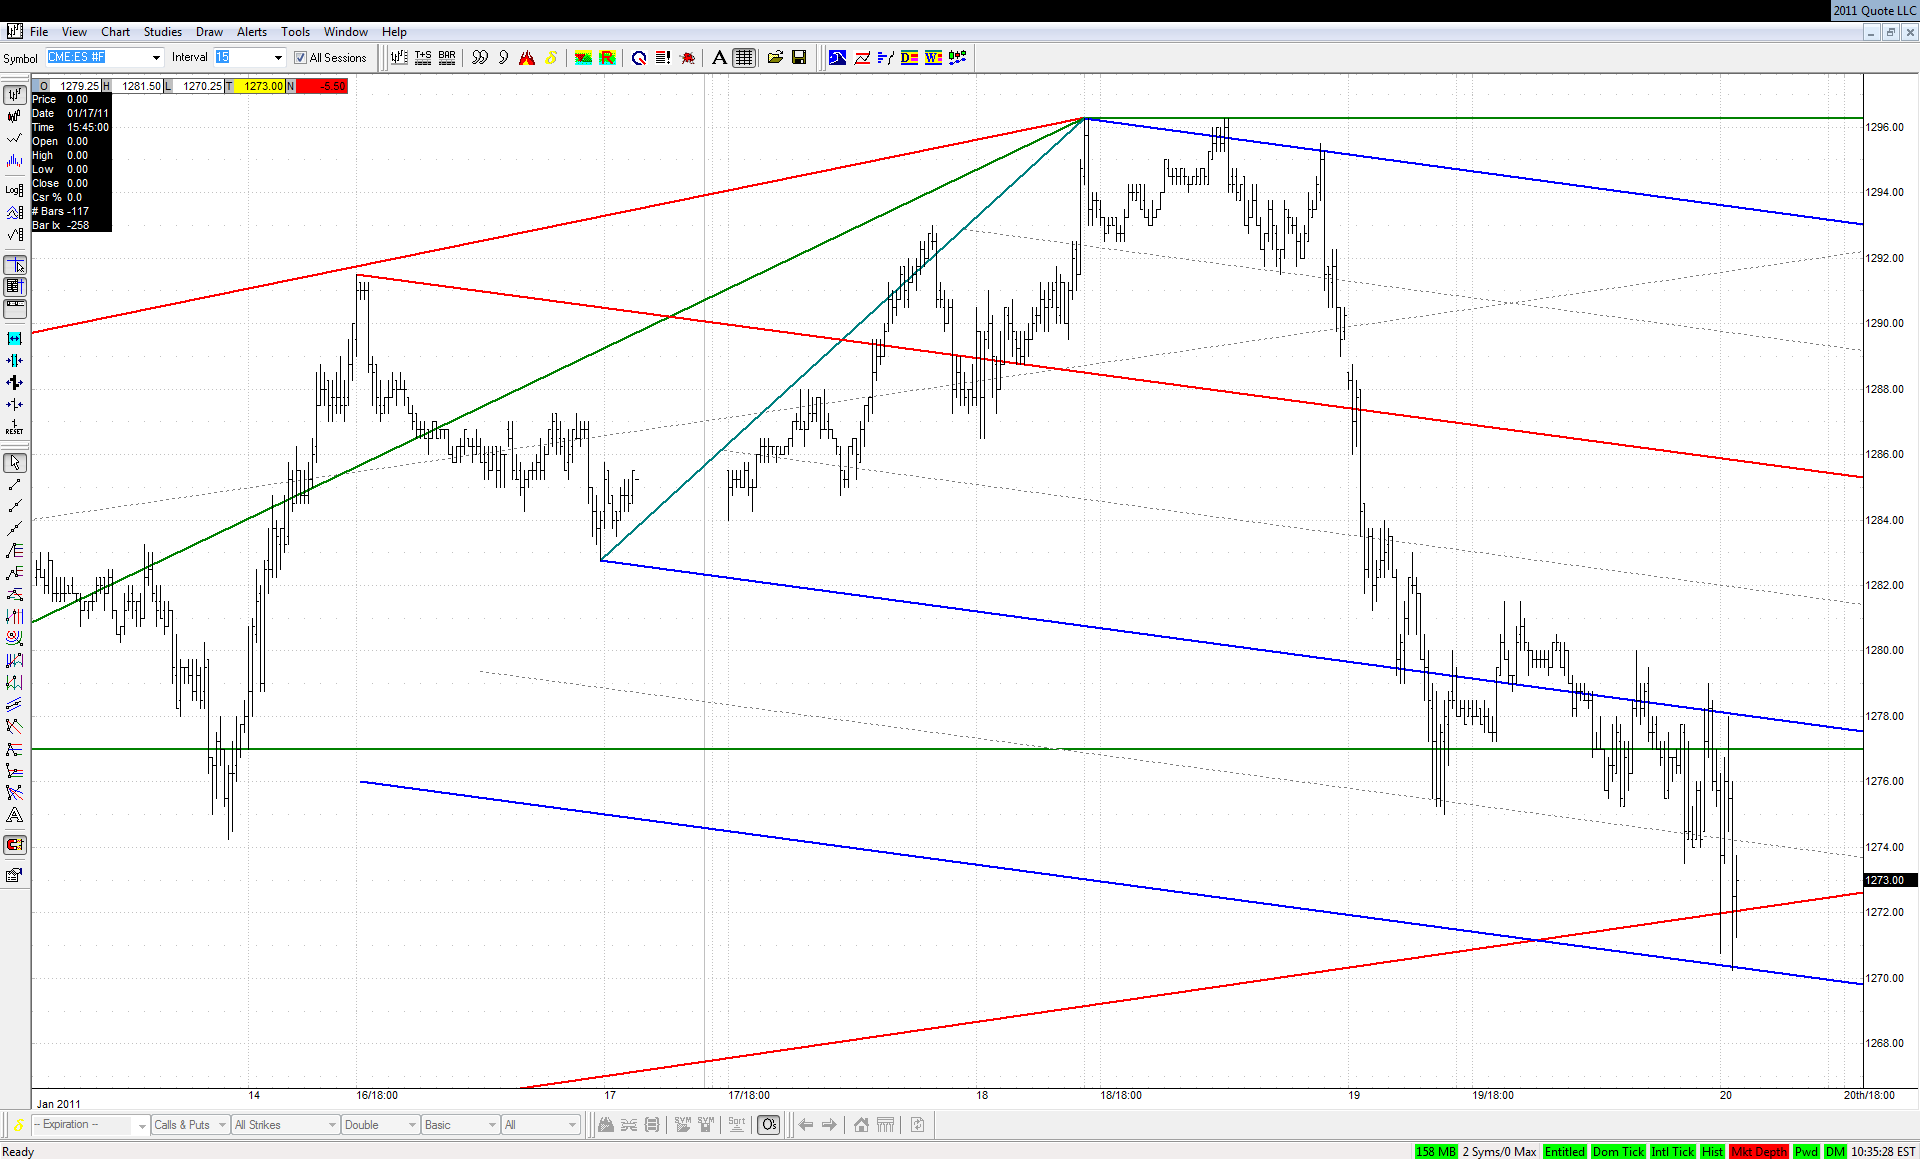
This seemingly disorganized ping-pong today was almost to the tick line to line from our downsloping set:


Click image for original size
JA
jarek
Rep: 94
Posts: 3,474
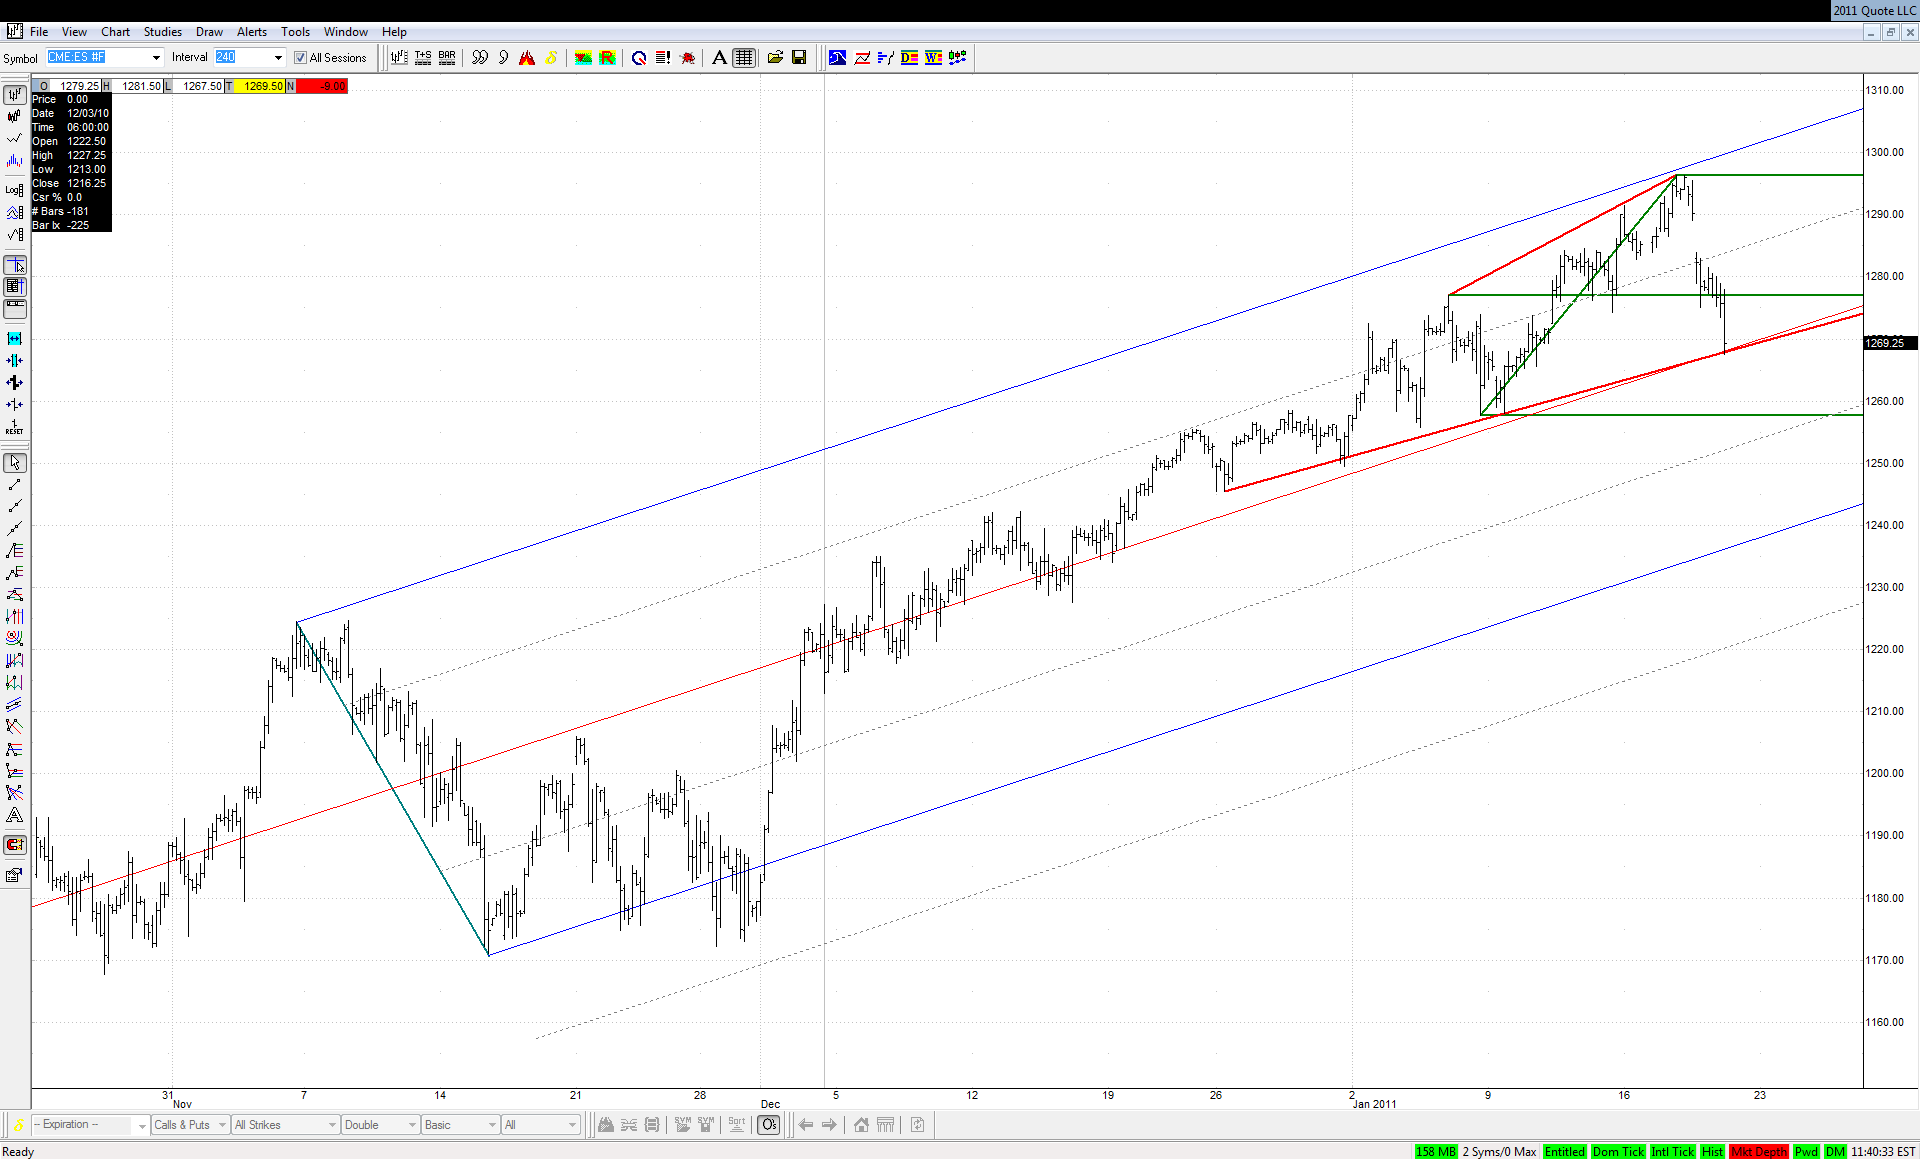
Current LOD lies on the last rising TL between here and a lower ML of the green set. Current decline is also in comparison to the fast part of the November drop:


Click image for original size


So it should be all the way down to the green ML if current LOD gives way.
JA
jarek
Rep: 94
Posts: 3,474
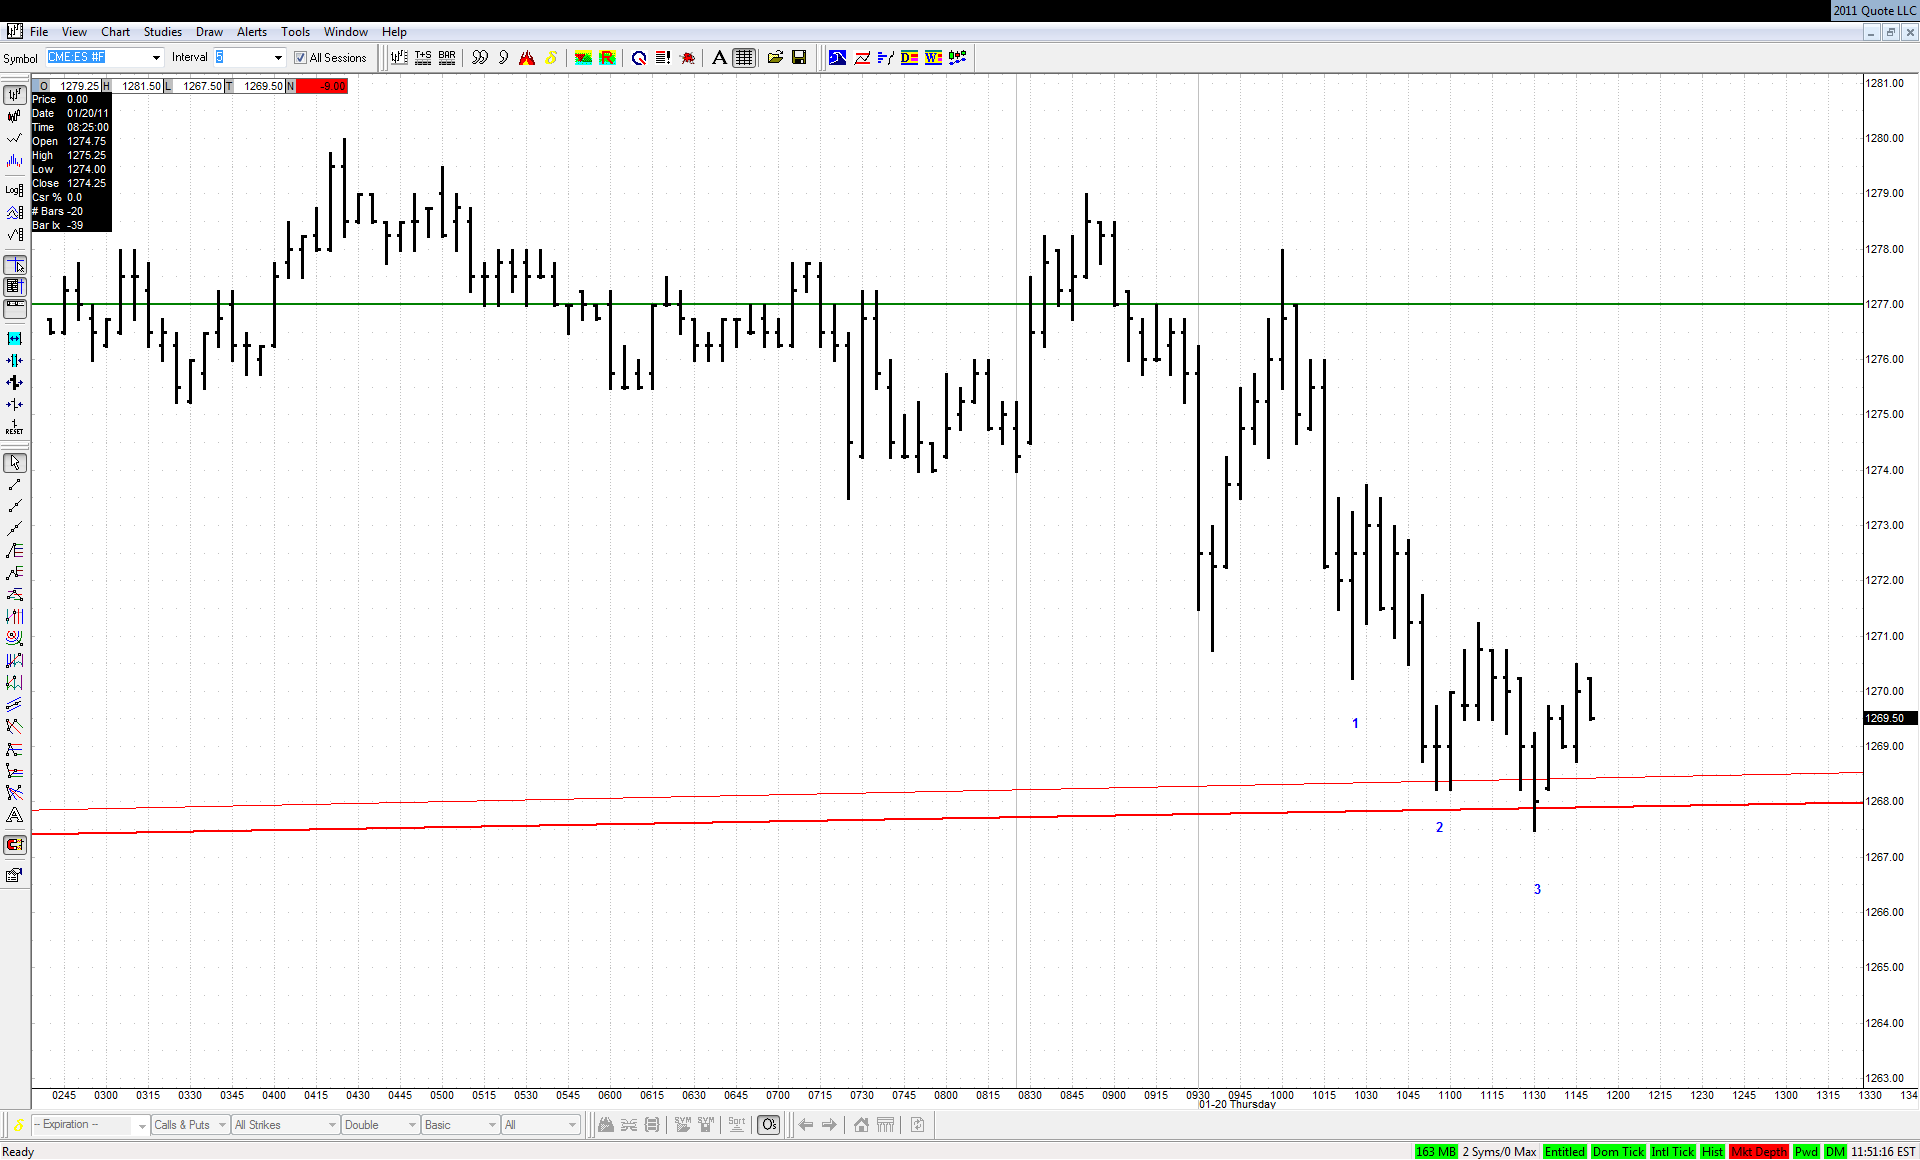
... and there was a bullish 3D right to the lines adding significance to my thesis above:


Click image for original size
AL
albert
Rep: 99
Posts: 3,094
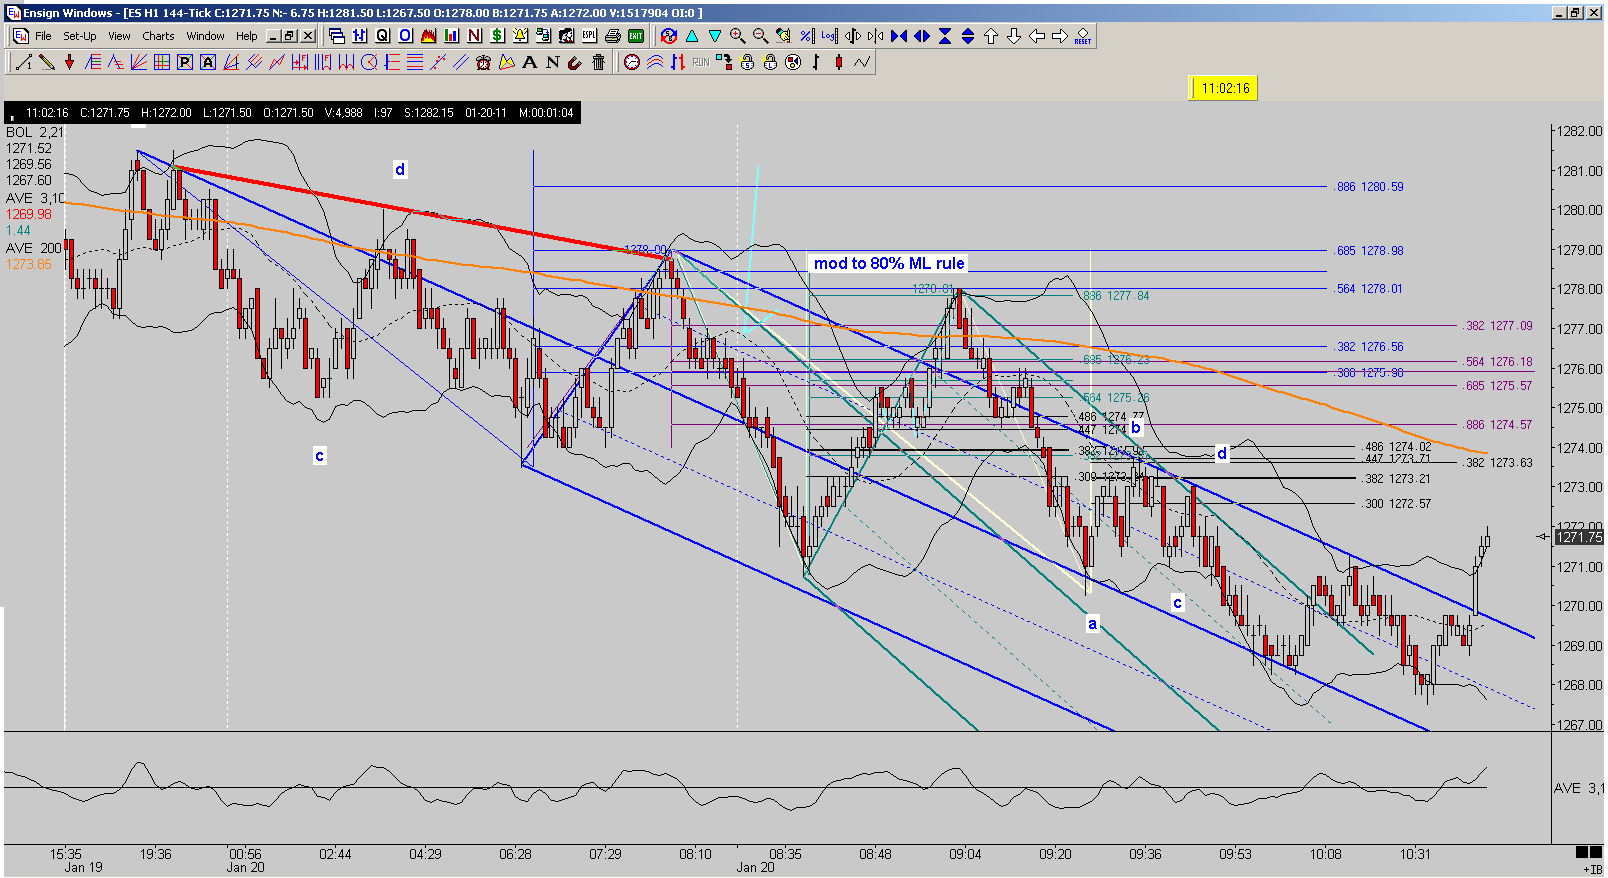
I may be having some data issues. I could not replicate the 144 tick on my last post here. New chart included. I will, however, keep the gains on that trade for my records. More Kane ABCDs.

Al Kamego
Click image for original size
RO
roofer
Rep: 3,689
Posts: 3,574
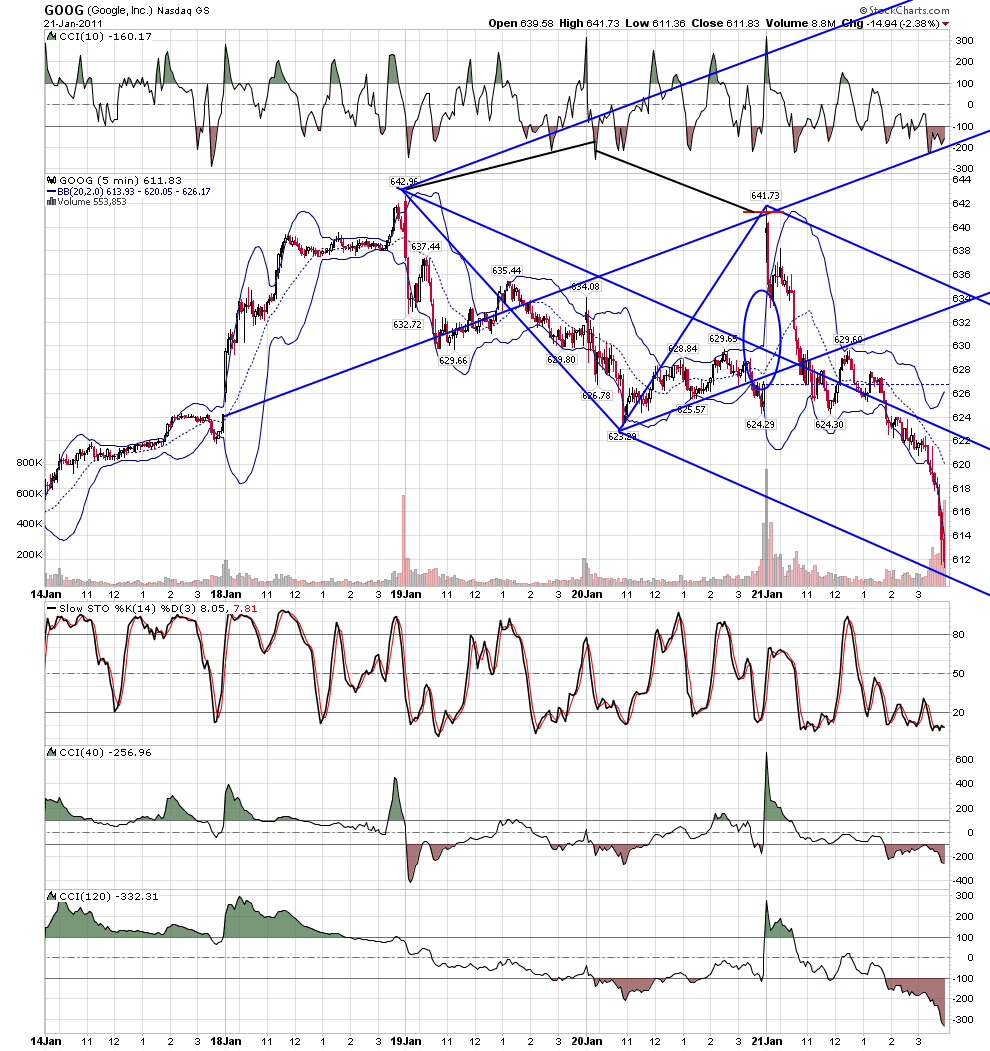
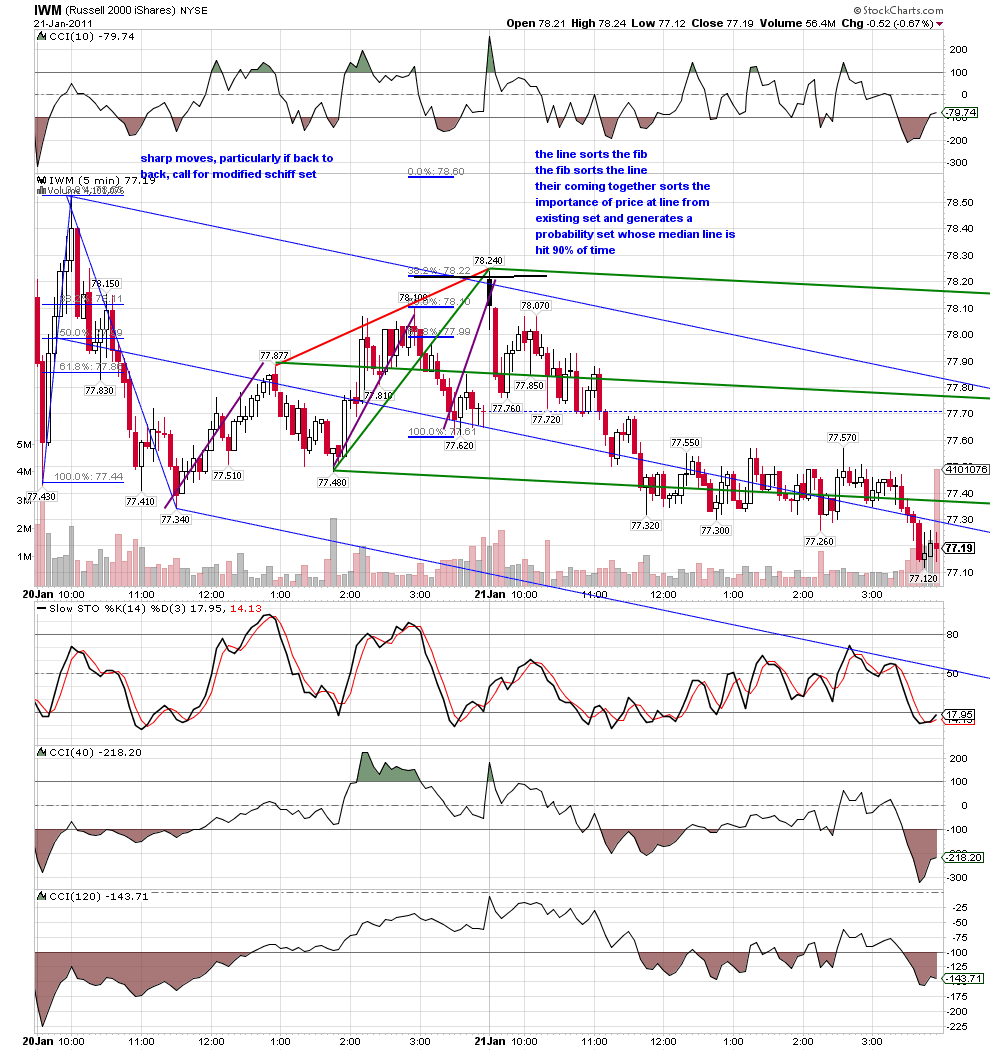
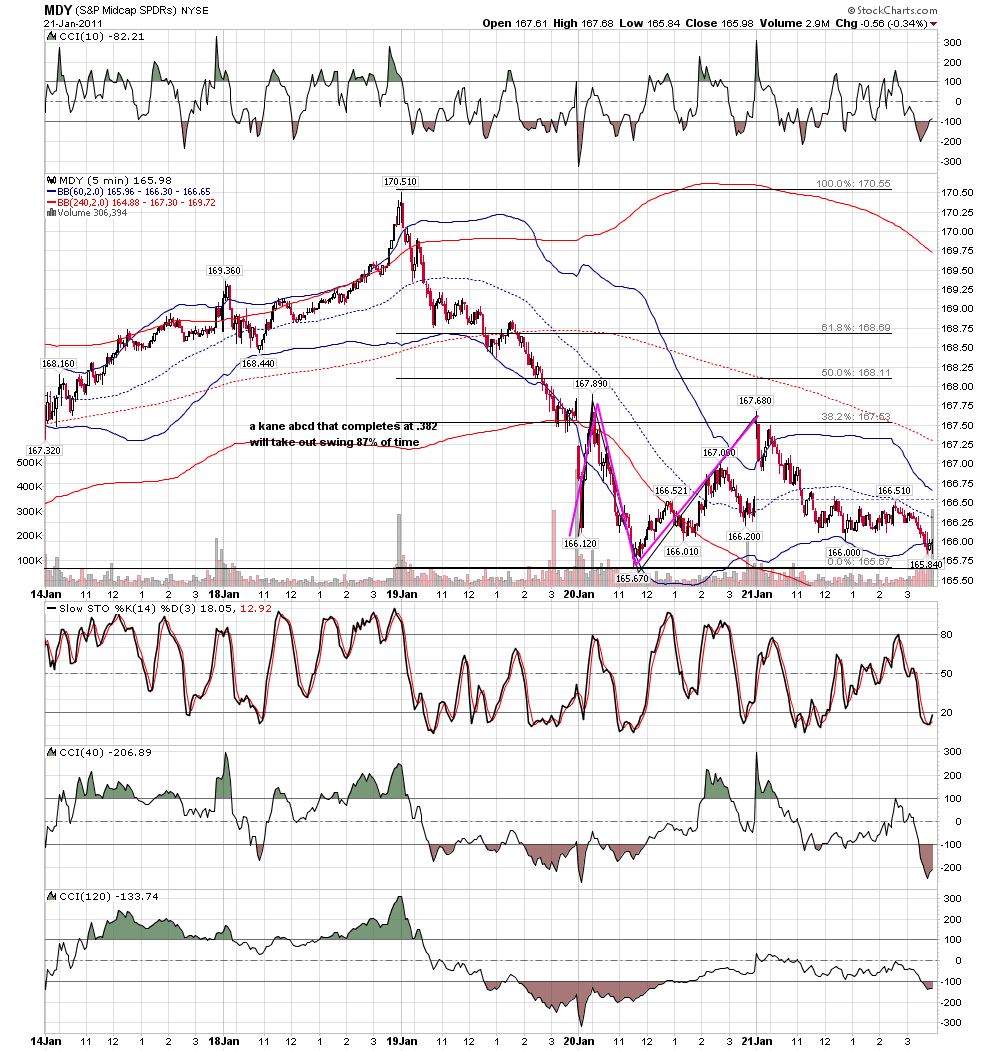
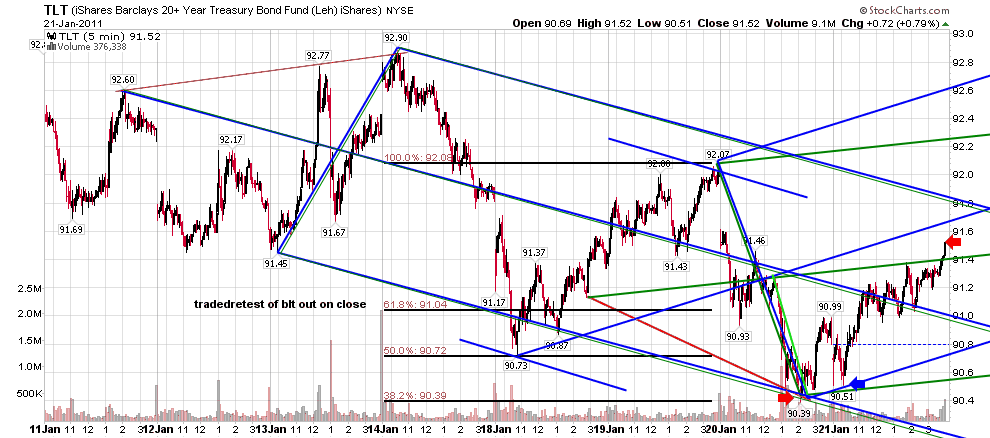
today... i had a good week so i used the geometry to buy a lottery ticket of 100 shares in GOOG.OUT AT CLOSE... I TRIED TO SAY WHAT I WAS THINKING on each chart...
Click image for original size

Click image for original size

Click image for original size

Click image for original size

Click image for original size

Click image for original size