MyPivots
Sign In
JA
jarek
Rep: 94
Posts: 3,474
Originally posted by jimkane

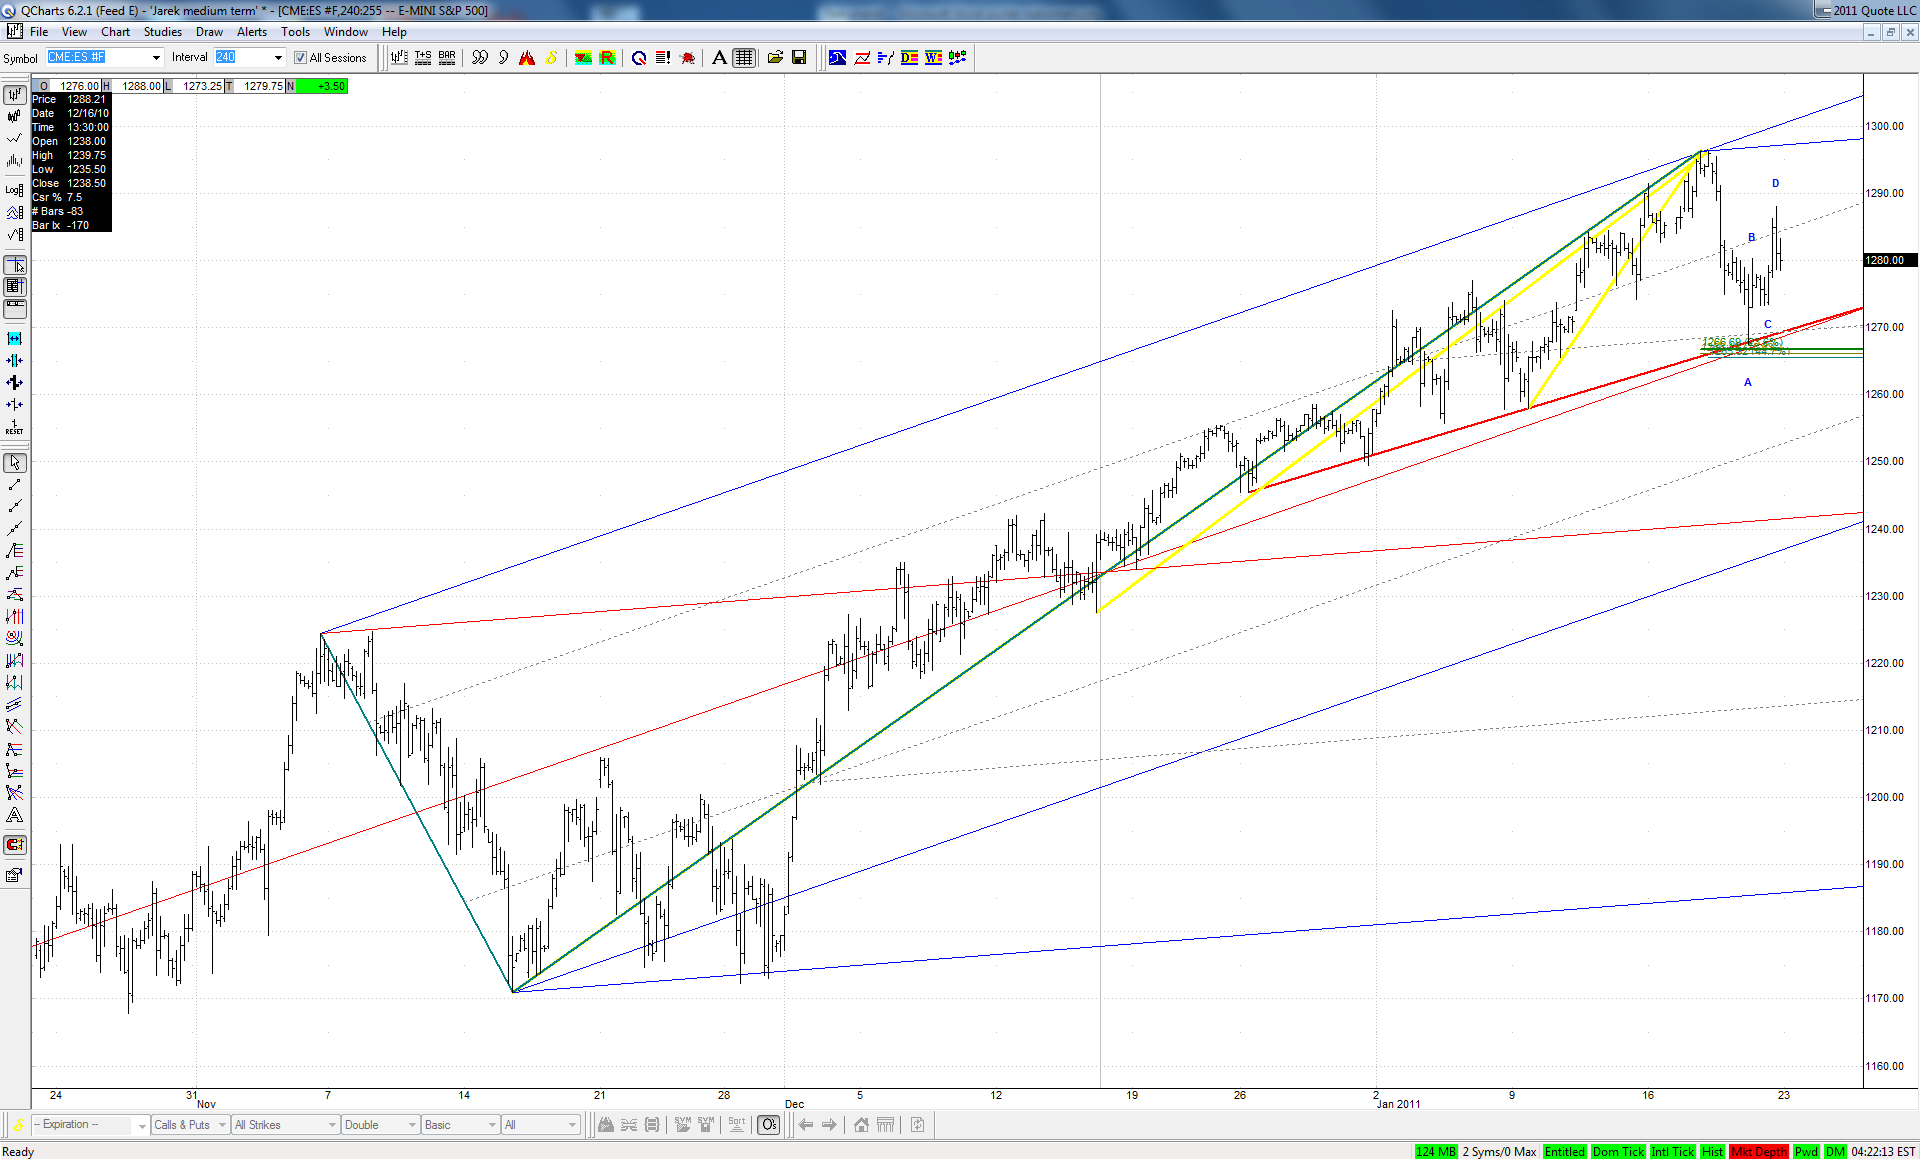
...the A point of that bigger bearish ABCD is a big, key area on the higher timeframes. So, it really comes down to if one thinks a bigger correction is at hand, or that was it and new highs are coming.


So we may expect stronger move either way in the coming week:


Click image for original size
JA
jarek
Rep: 94
Posts: 3,474
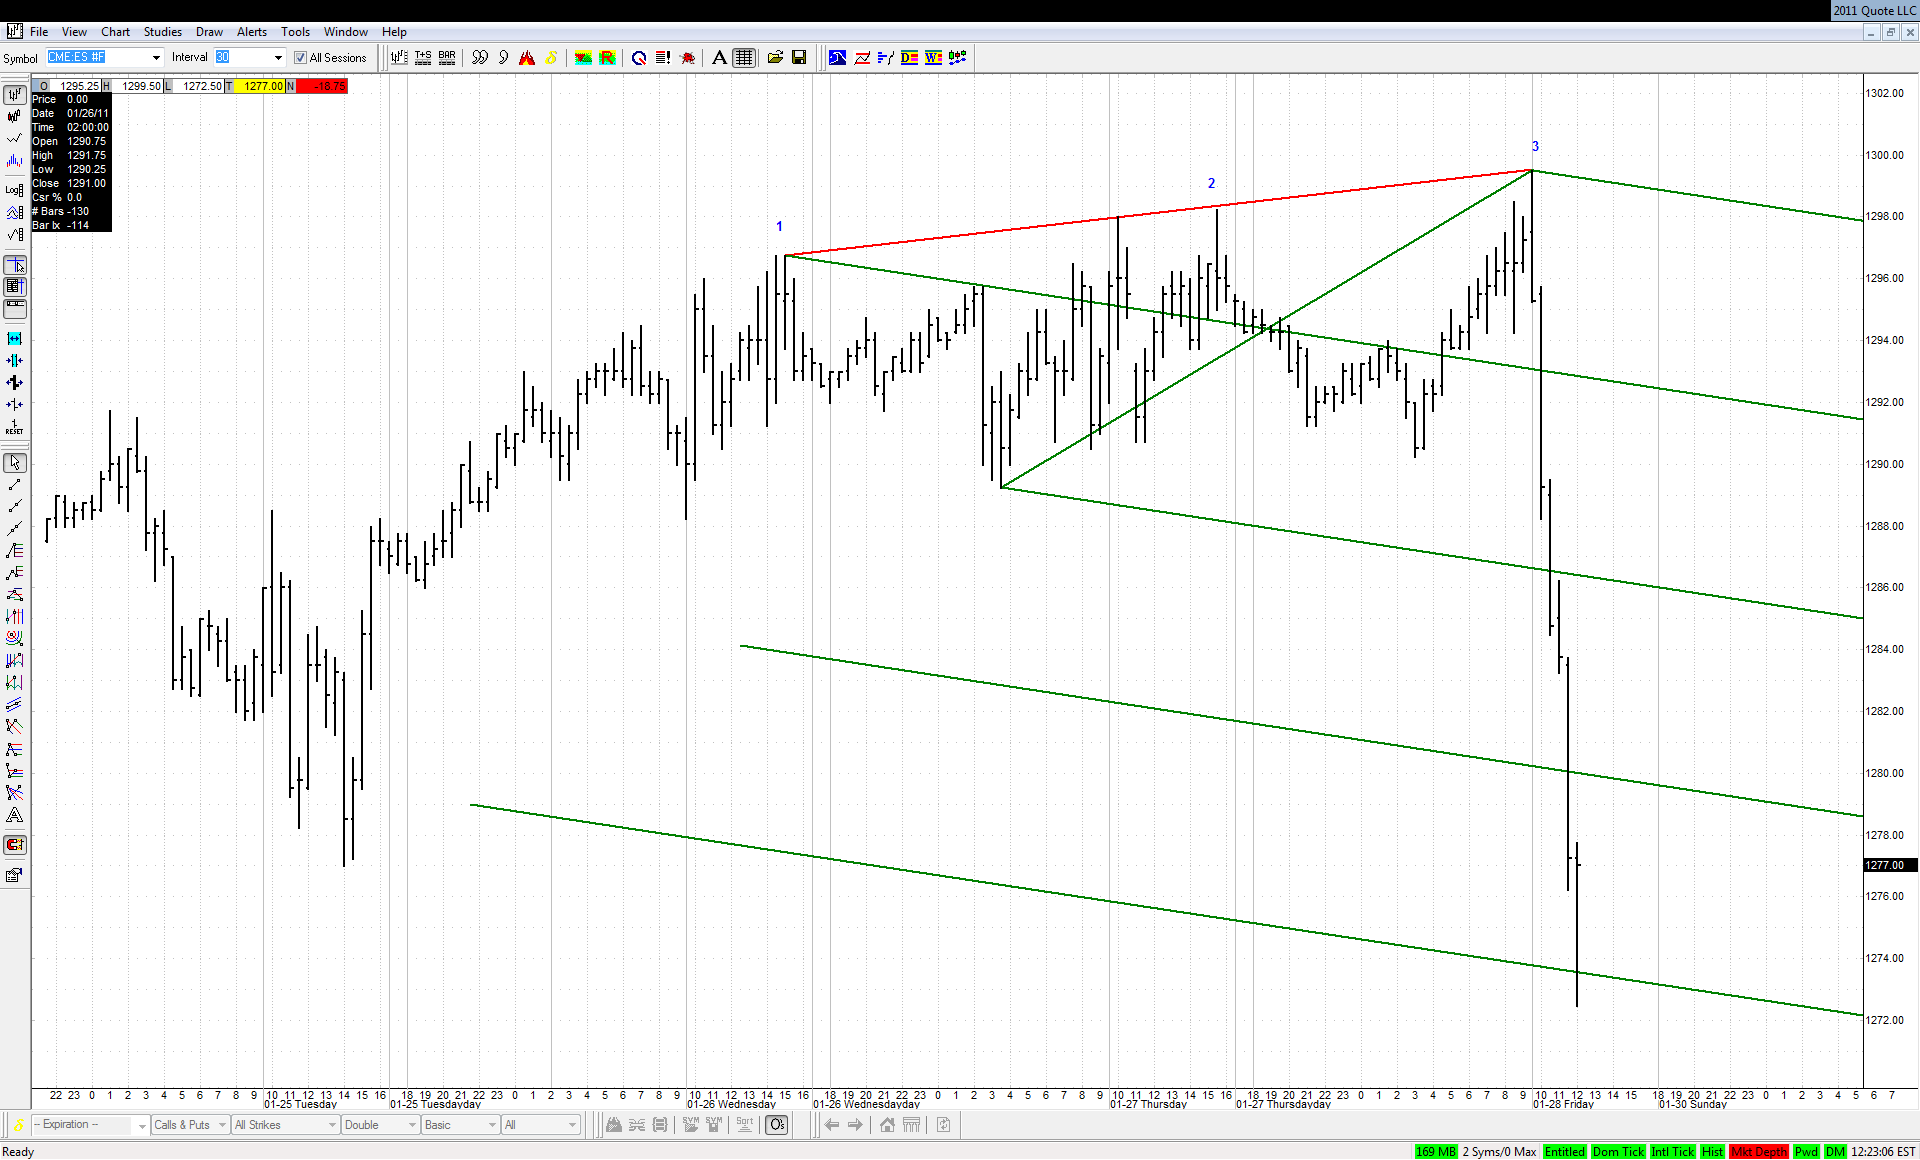
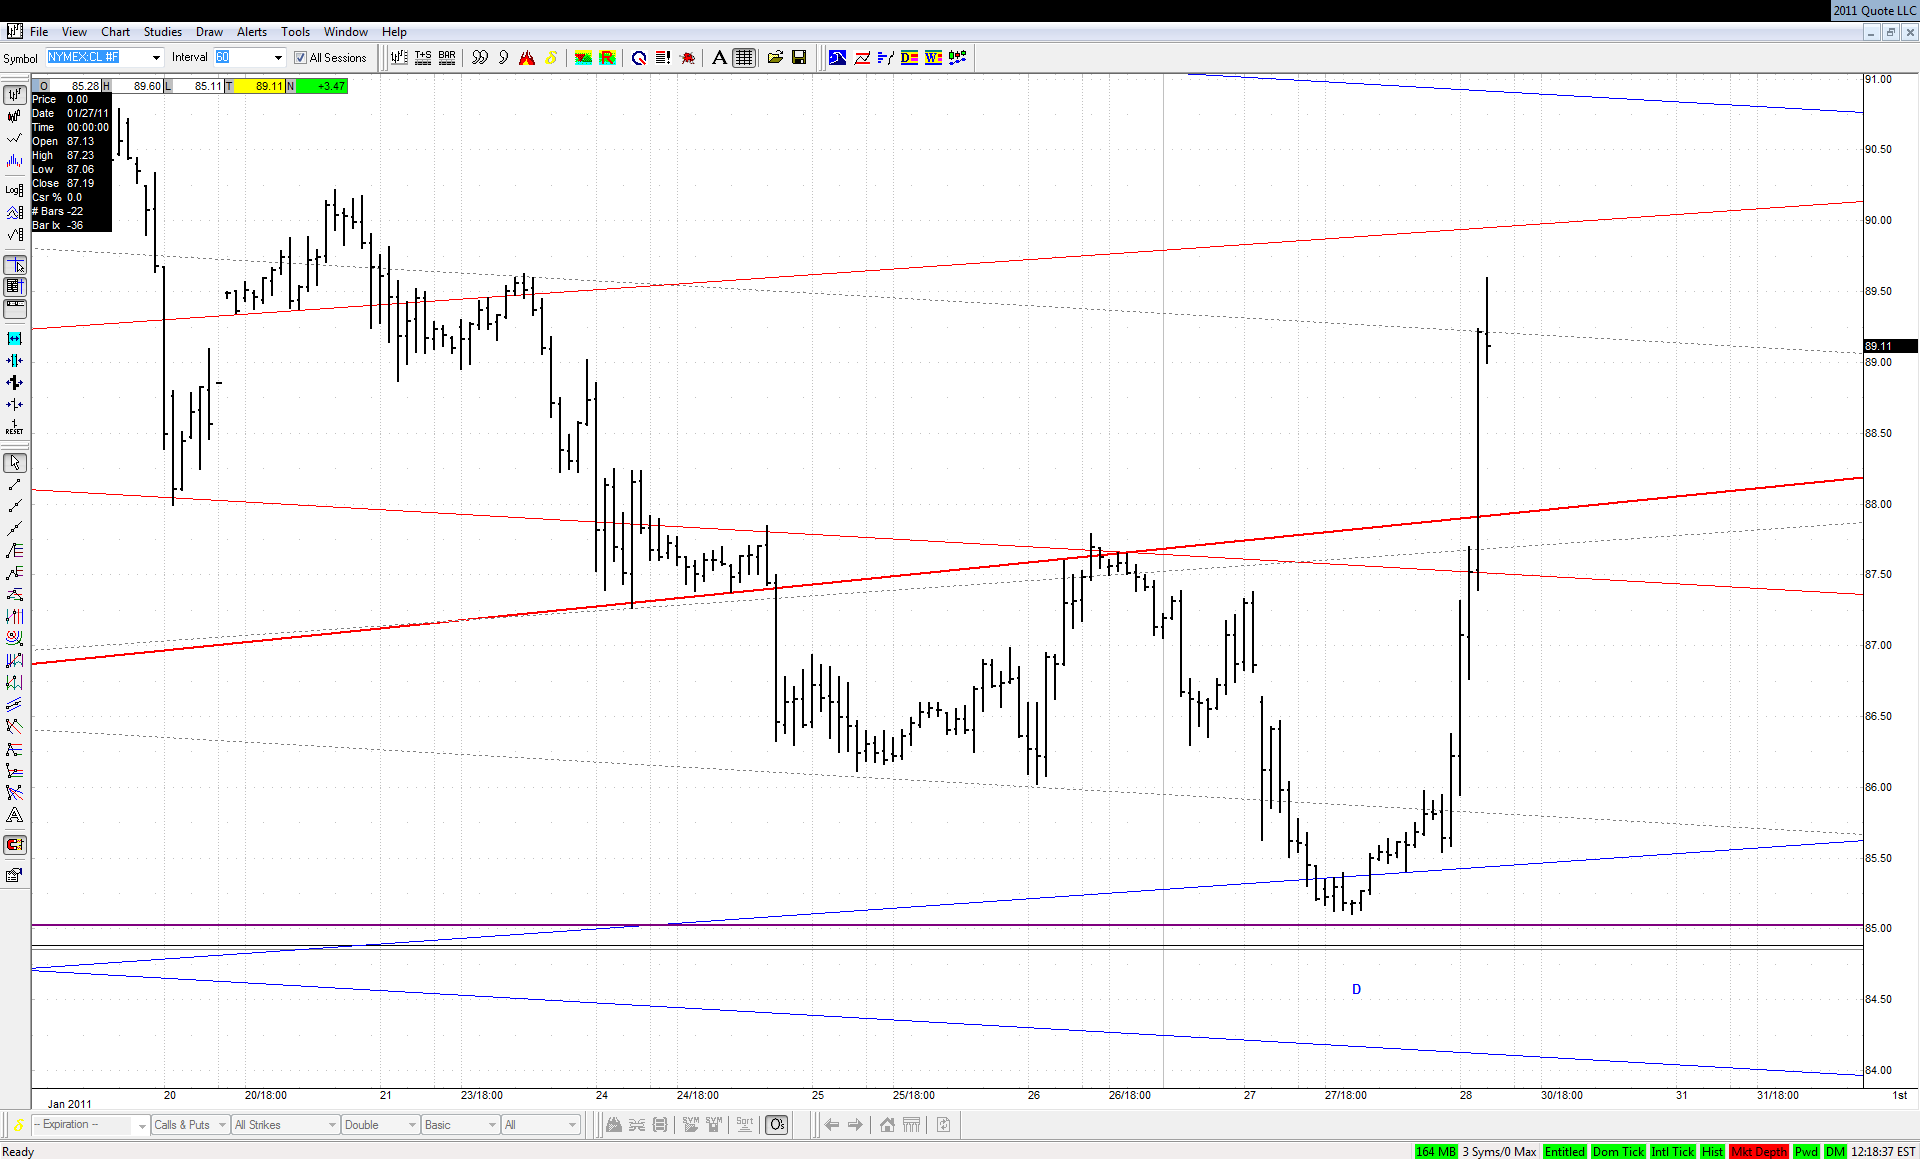
Nice drop - over 25 points in 2 hours. If this is not the climax move that ends the decline, than it would have to be start of something monstrous to the downside.
JA
jarek
Rep: 94
Posts: 3,474
Crude on fire!!!


Click image for original size


More than 5% up from yesterday's low. Now, this is volatility!
JA
jarek
Rep: 94
Posts: 3,474
Interesting:


Click image for original size
JA
jarek
Rep: 94
Posts: 3,474
Originally posted by jarek

Crude on fire!!!


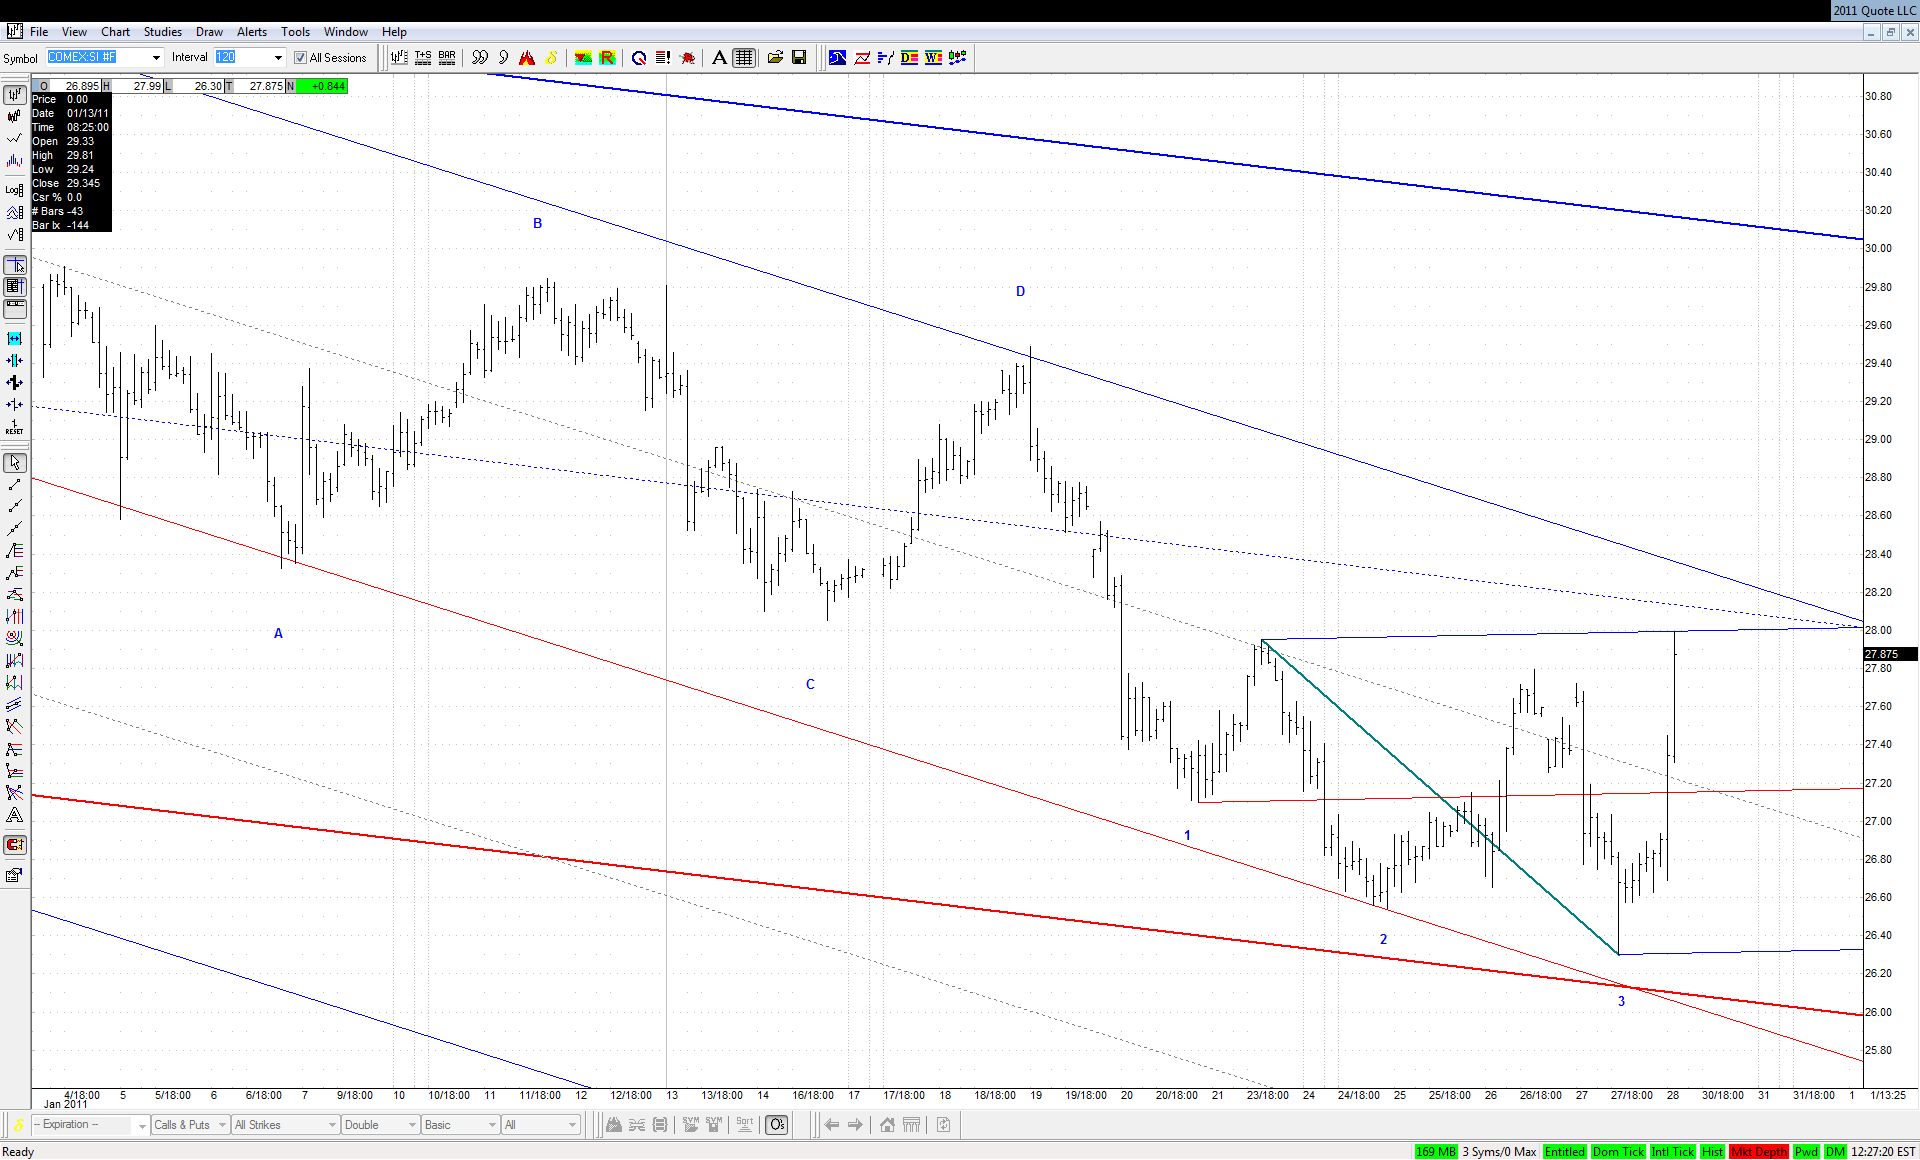
Silver as well:

Click image for original size


It just reached the target for the move off the bullish 3D at this major ML.
JA
jarek
Rep: 94
Posts: 3,474
Originally posted by jarek

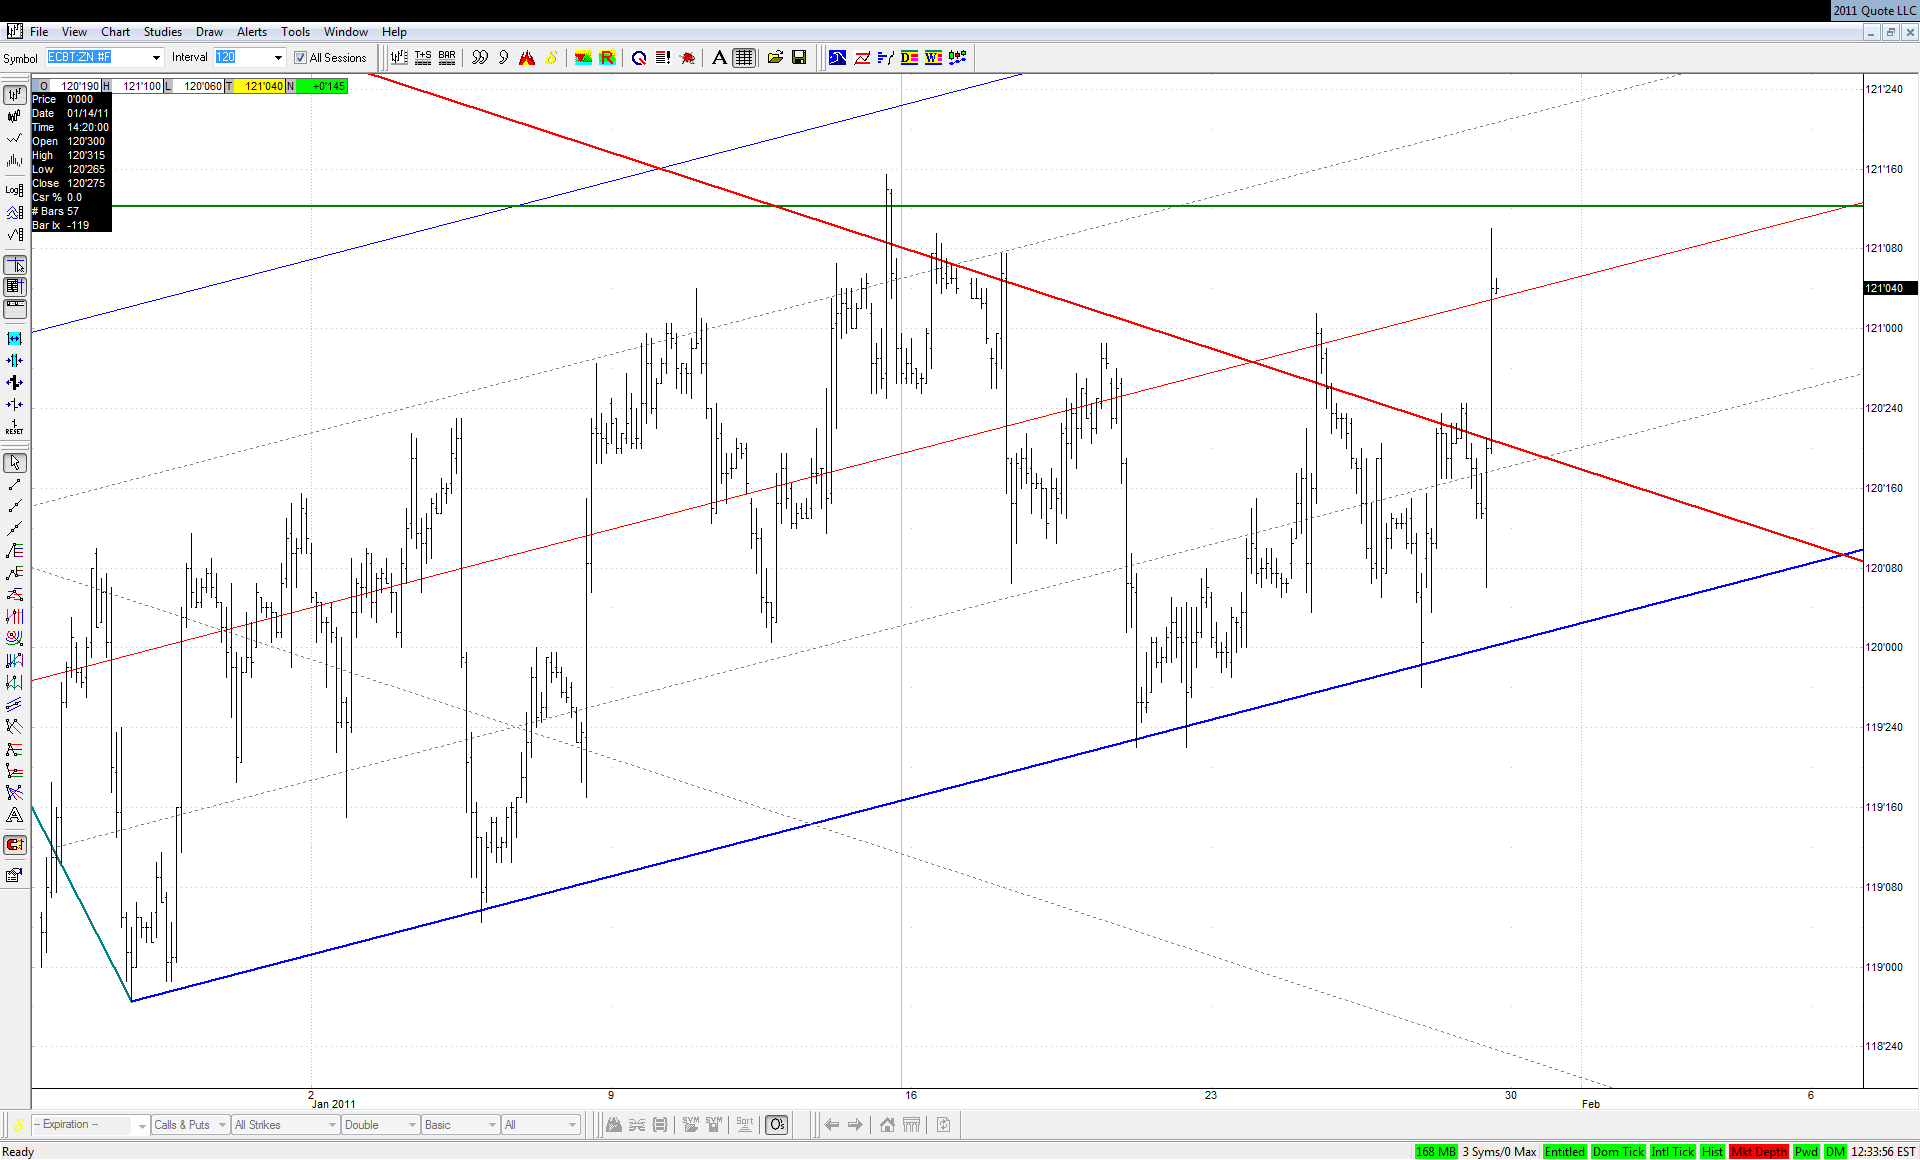
"A Tale of Two Lines" saga in Bonds continues but its end is already in sight:


Looks like somebody decided not to wait for the credits at the end of the movie:


Click image for original size
JA
jarek
Rep: 94
Posts: 3,474
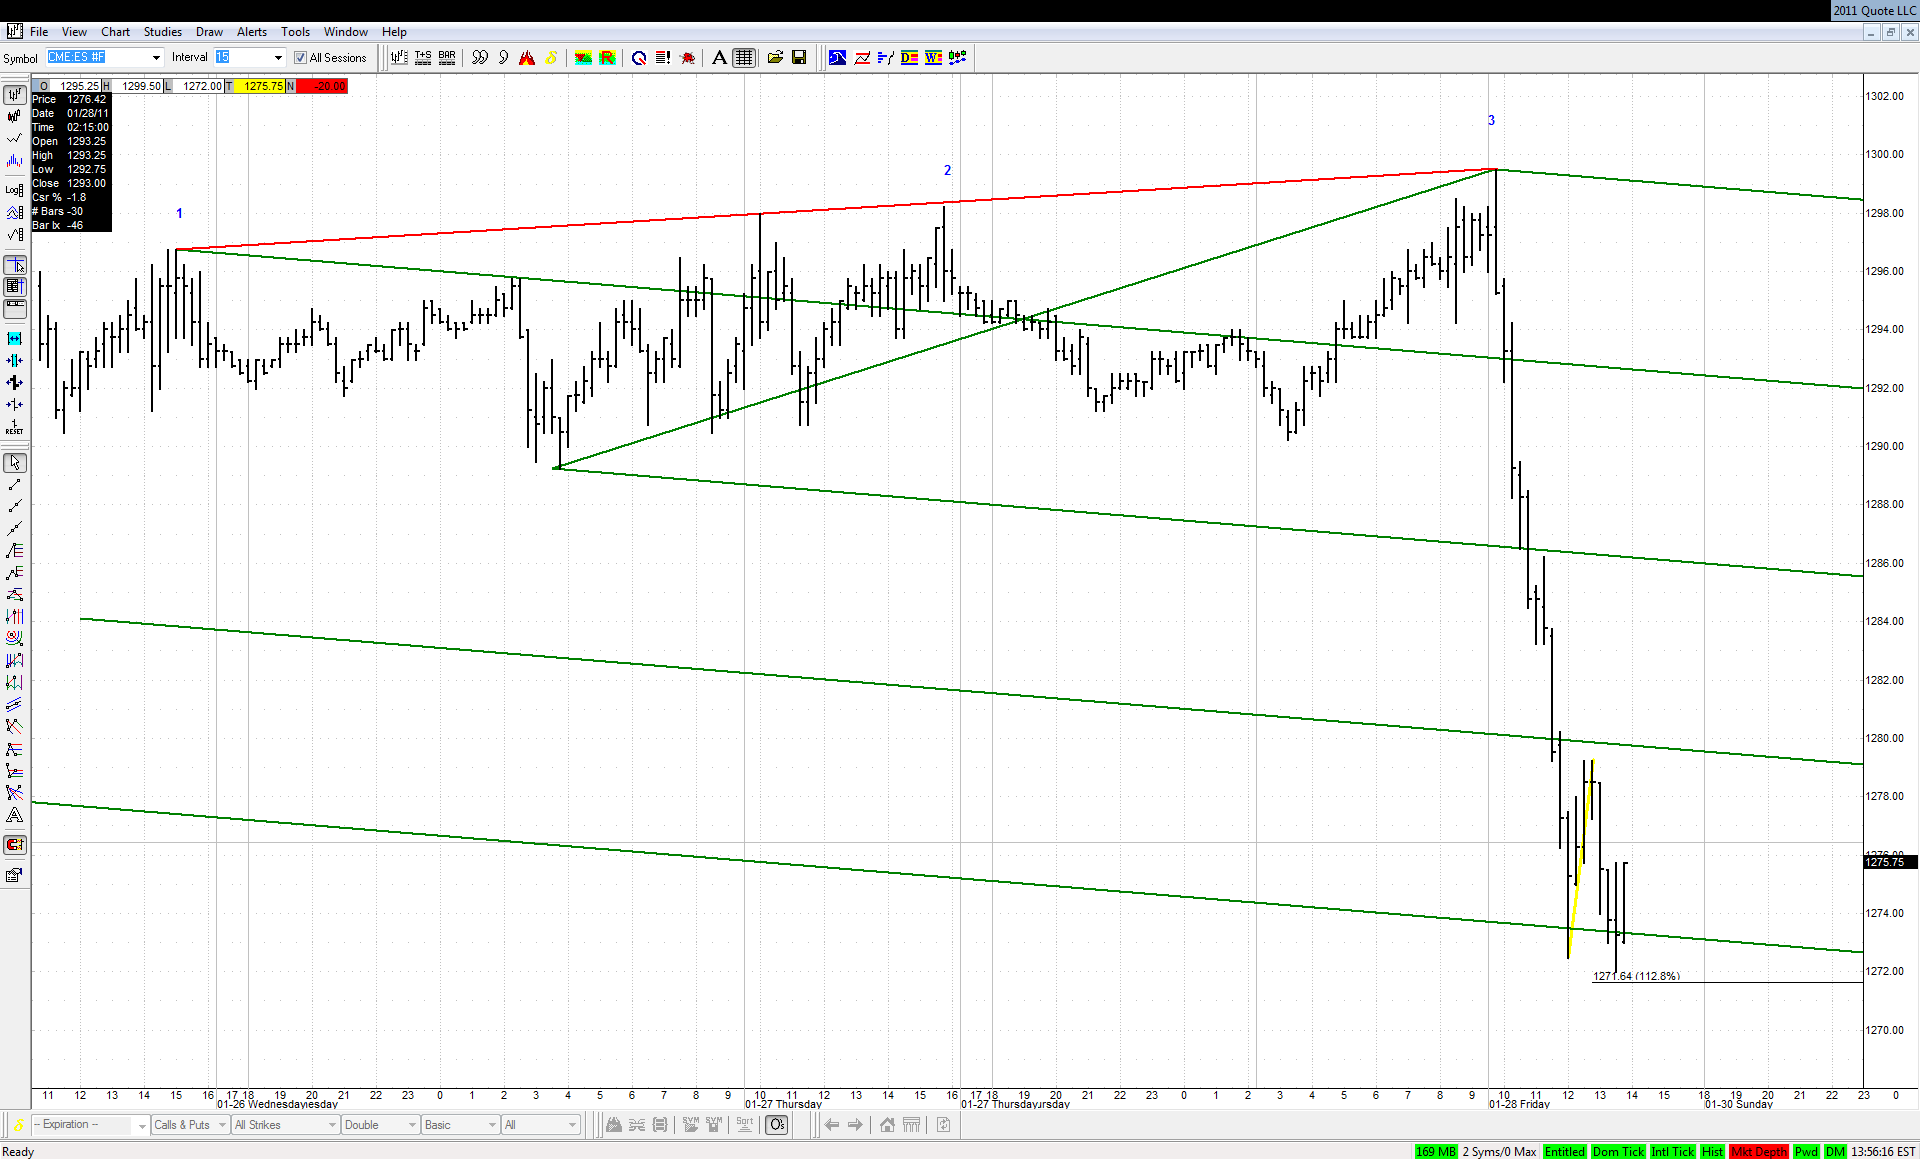
I left for some time and now see that ES "likes" the LOD area and tries to establish some kind of bottom there:


Click image for original size


Will this 3-4-5 sequence do, or will it go one more time to form bullish 3D?
JA
jarek
Rep: 94
Posts: 3,474
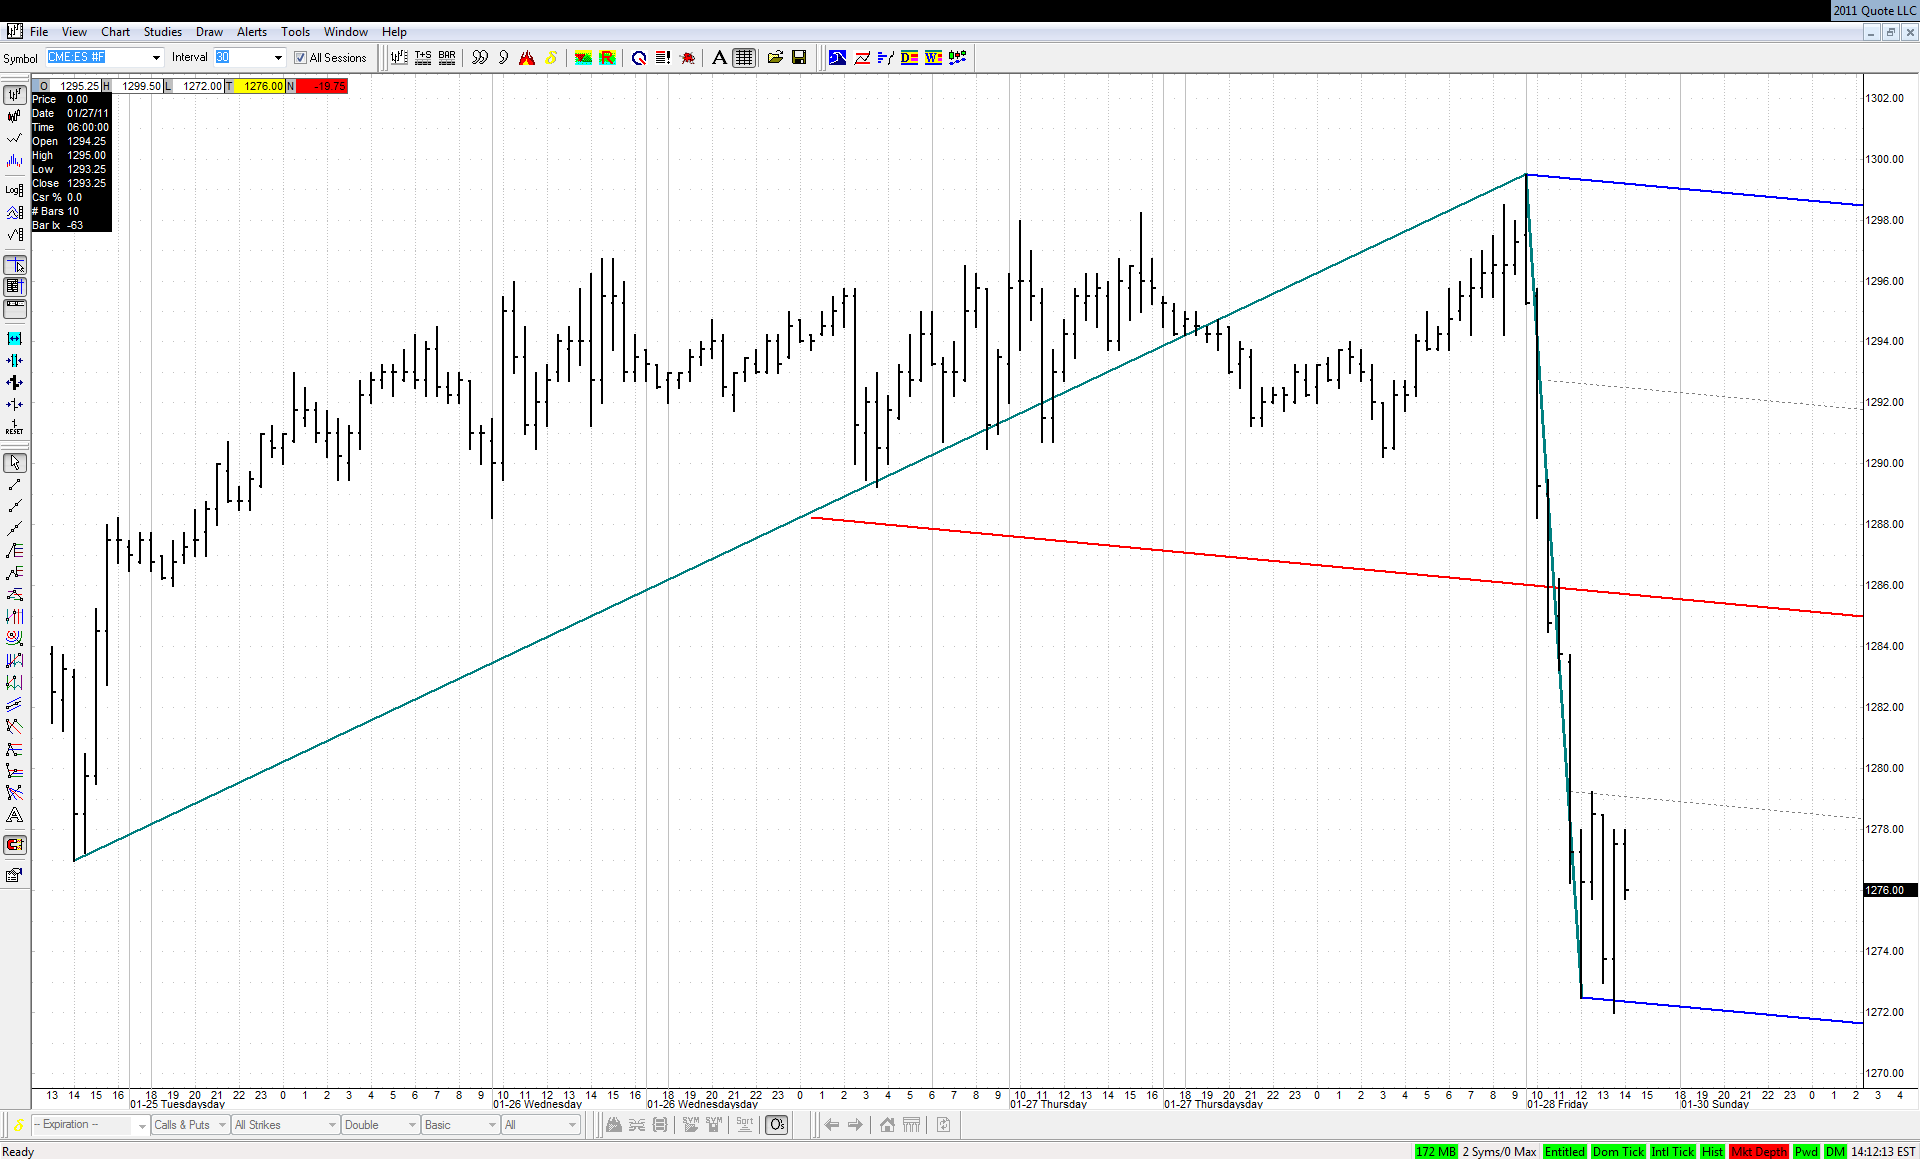
I'll switch from the green parallel lines to a Schiff set, which seems to represent recent price action well:


Click image for original size


It looks disproportionate, but it's only because today's decline was so fast
JI
jimkane
Rep: 3,058
Posts: 33,089
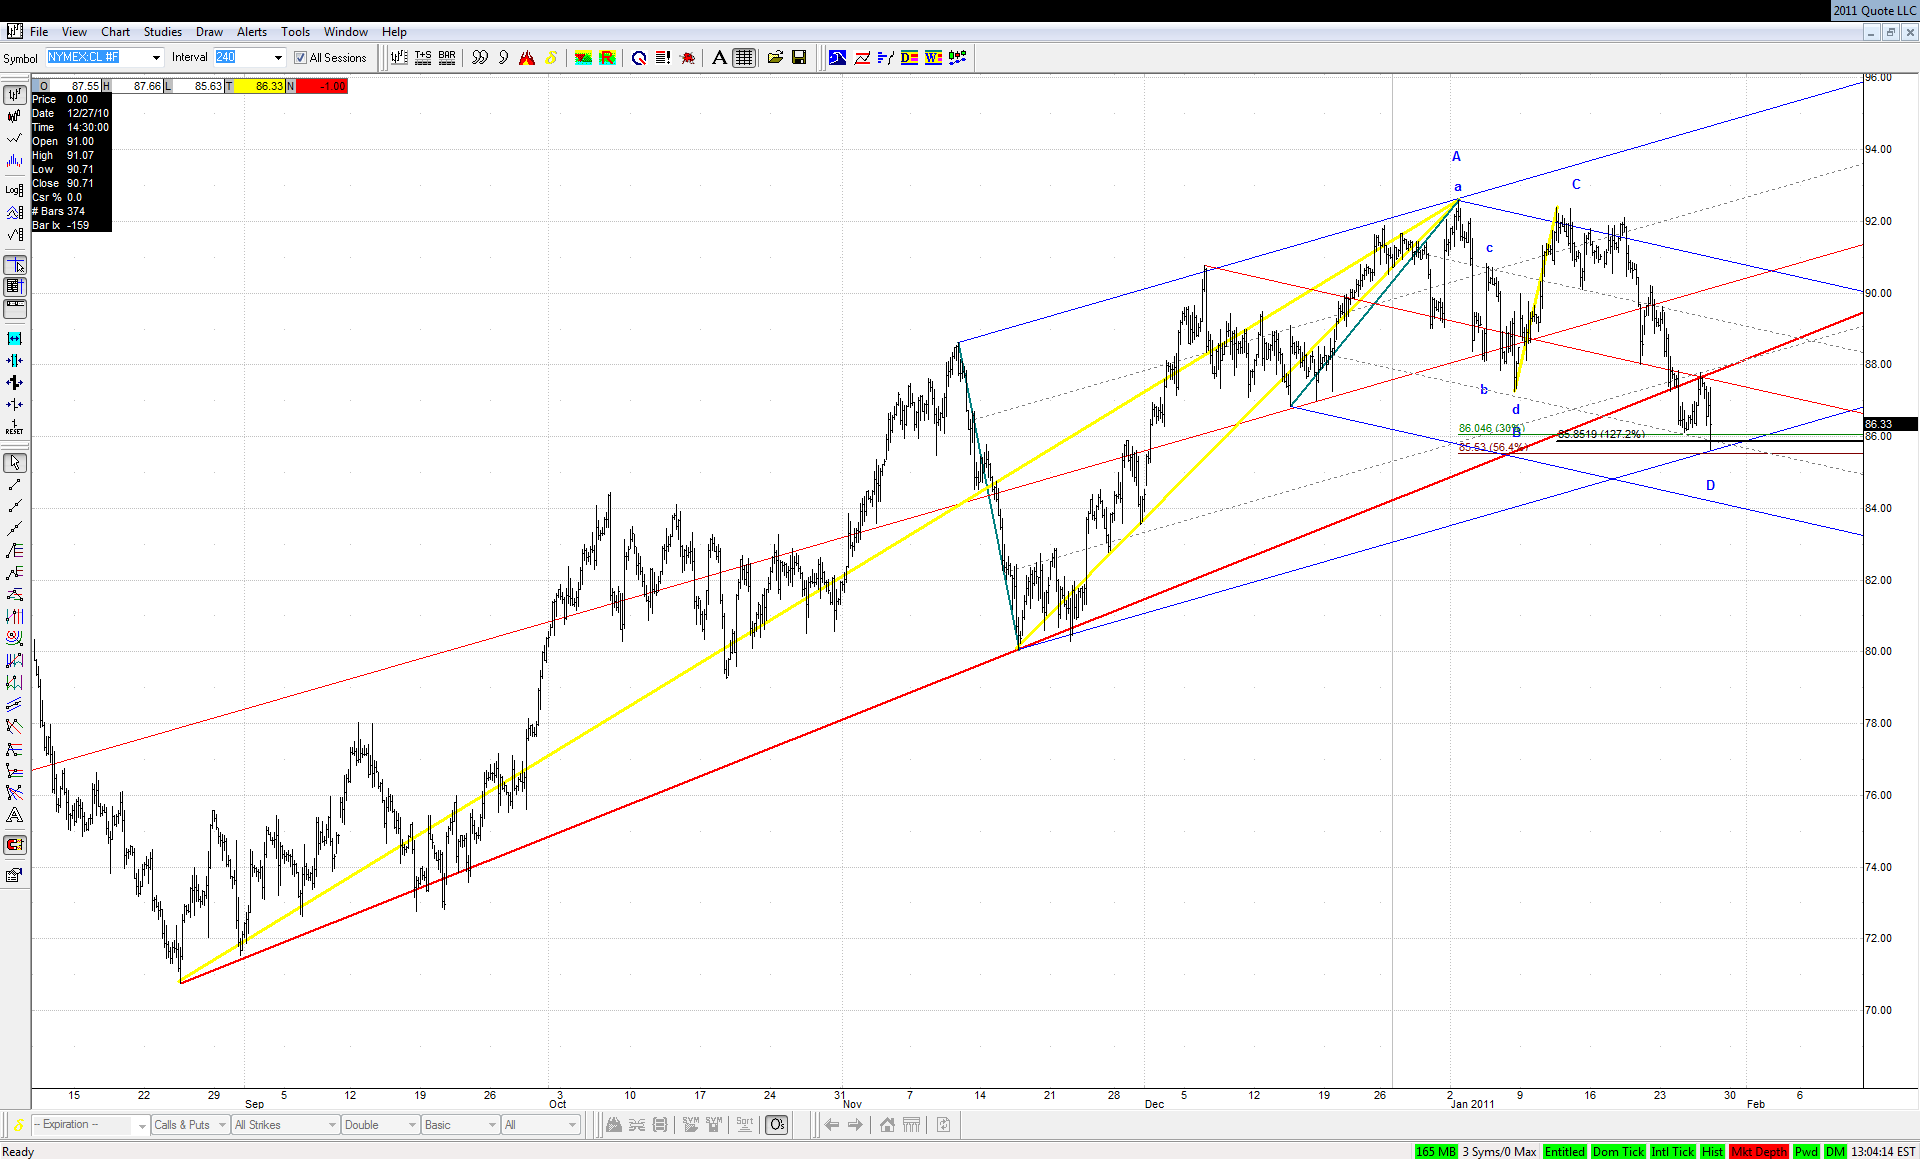
I hope everyone studied this comment of mine and took heed... Also note the parameters I use for the DT ABCD are from 1.272 to 1.618, and I find the 1.272 to probably be the least common variation. It depends on the lines and groupings, too. Do some additional work on this one and you'll see why the 1.272 may have been overshot by a bit.

I added jarek's previous chart here for perpsective:

Click image for original size


Originally posted by jimkane

I think this chart is more important than most people realize...


Originally posted by jarek

If the decline in Crude is not contained at recent low with the help of 1.272 DT ABCD than much more bearish scenario would be in cards heralded by this return move to the broken trendline:


Click image for original size

JA
jarek
Rep: 94
Posts: 3,474
Good to know that I'm not alone here talking to myself ...
JI
jimkane
Rep: 3,058
Posts: 33,089
No way. I'm reading what you post. I just save comments until later. You might reread the above post, as I added a little bit to it on an edit.
RO
roofer
Rep: 3,689
Posts: 3,574
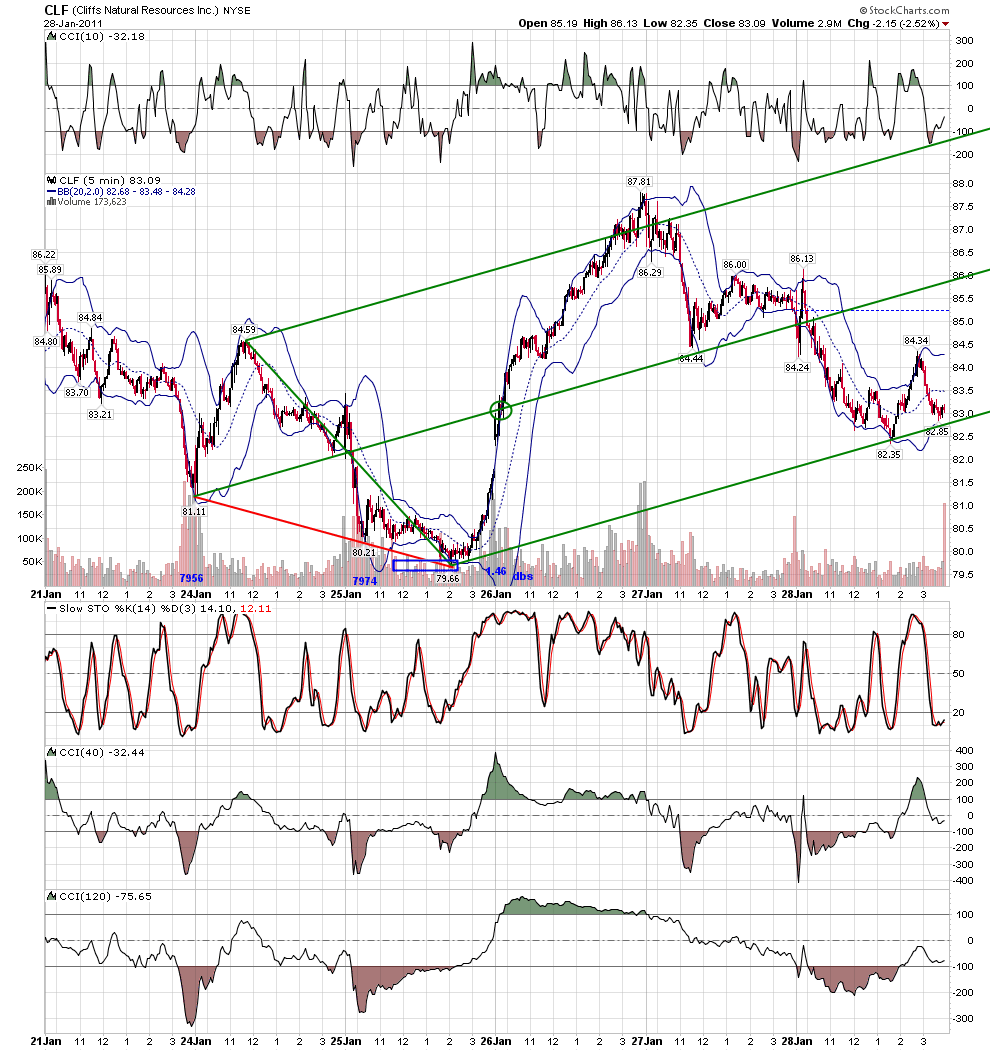
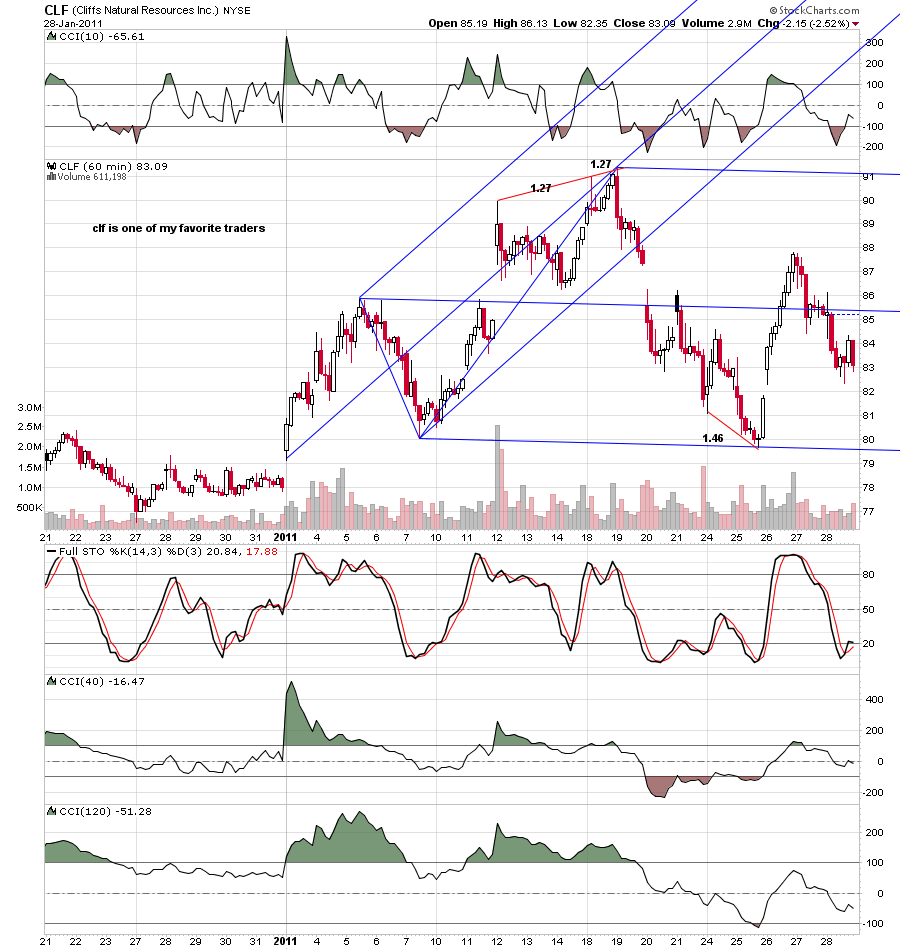
clf has long been one of my favorite traders that i have kept to myself..... here is a peak
Click image for original size

Click image for original size