ES Short Term Trading 02-07-2011
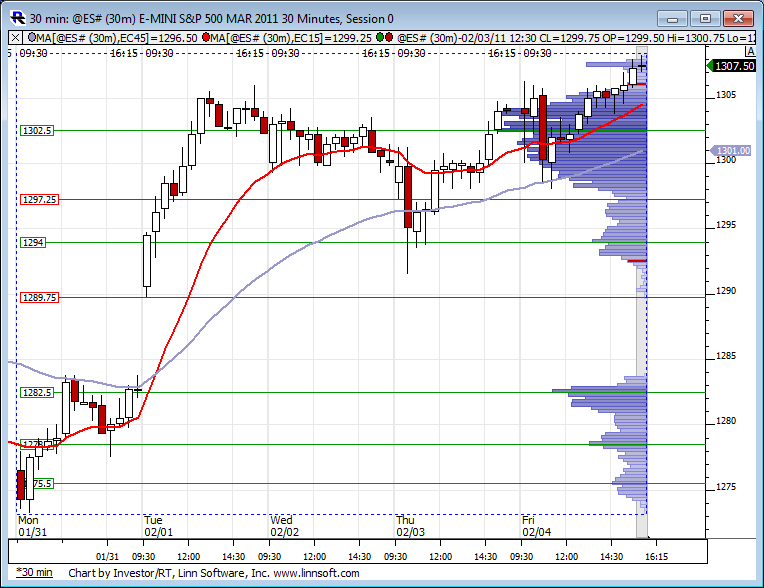
Well here is last weeks RTH profile. Prices are currently trading above this range.
Click image for original size

Yes indeed.
Originally posted by BruceM
good odds they test the center of the distibution Lorn posted near 1302...sometime this week!!....a weekly buldge!!
Click image for original size

Click image for original size
As Bruce mentioned earlier, TICKS barely coming below the zero line here so far. There is equity buying happening which is causing this big push up. Until TICKS show some above average selling this market isn't going to correct much.
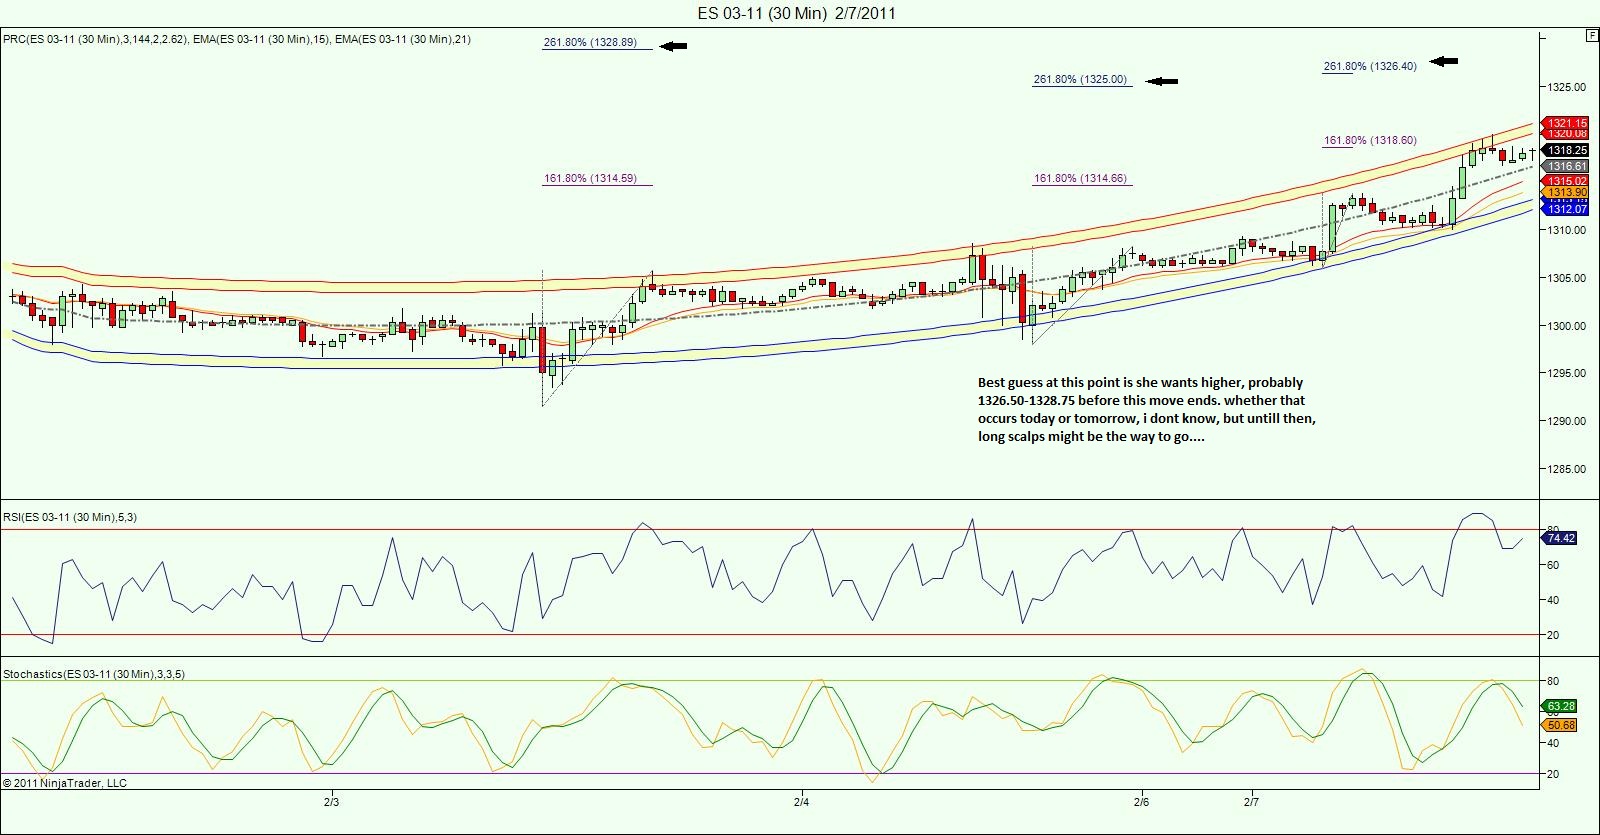
Here are some comments and observations I'm sure Kool would agree with. Notice the green up arrow on the chart. This is the low of the O/N session and where prices started to rally. Drawing the initial projection upward you can see all the major fib levels were quickly taken out and in fact provided no resistance.
The red down arrow where the early morning consolidation occurred had prices unable to reach the 2.618 projection downward another sign the bulls were out this morning.
Some added thoughts not on this chart. 1310.50 was where VWAP was at the 9:30 open and the subsequent rally since then. As already mentioned, TICK has been incredibly strong right out of the open which in my view adds valuable weight to what the projections are saying, ie be careful trying to fade.
Click image for original size

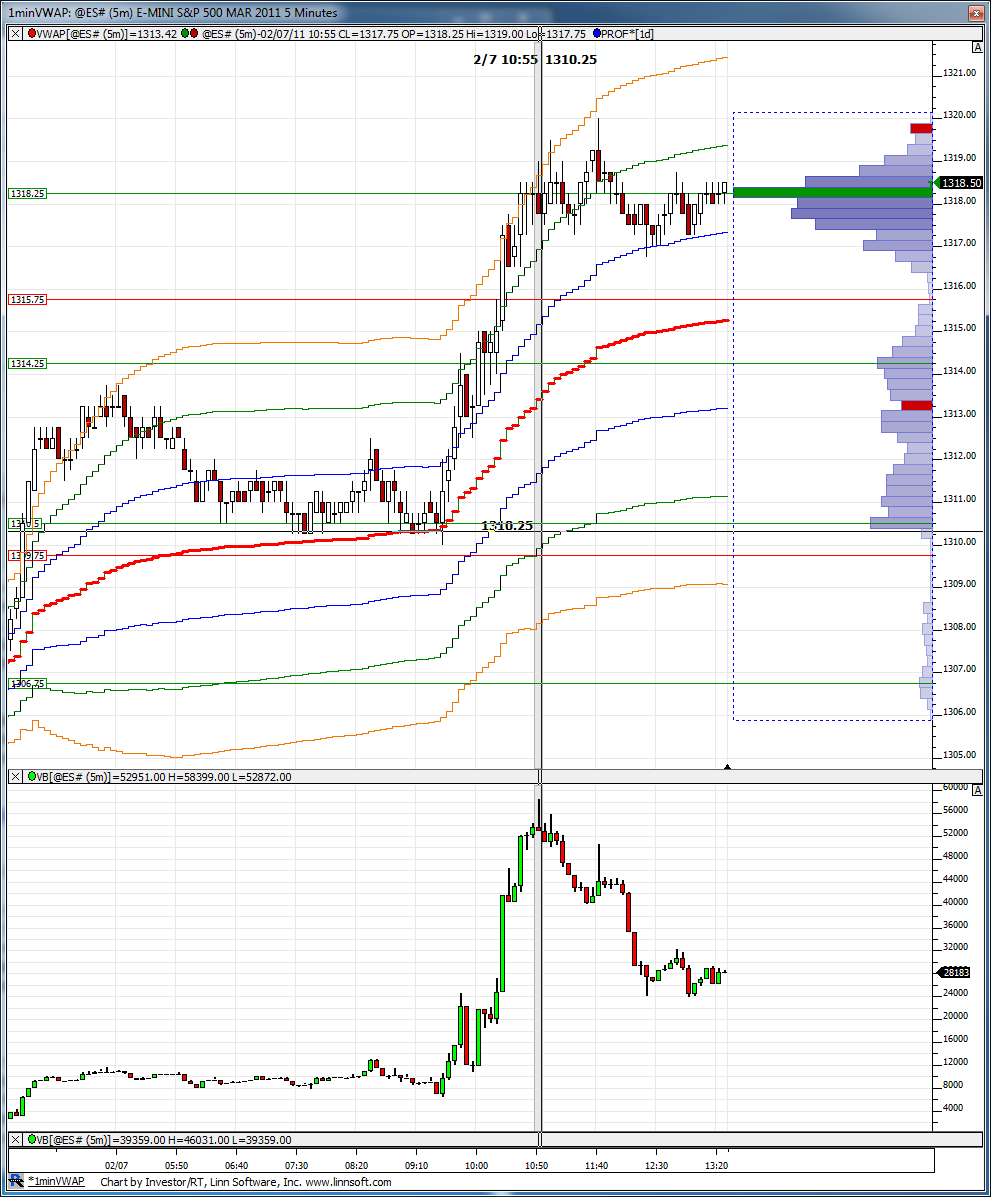
and 50% of the On range came in at 1309.75.......just for reference...we don't mention that one enough in here...
Yea good point Bruce!
Originally posted by BruceM
and 50% of the On range came in at 1309.75.......just for reference...we don't mention that one enough in here...
Here is a look at the VWAP chart. Notice at the 10:00 time frame prices reversed up off the blue 1st VWAP band? Riding that band now since 12:30ish.
Click image for original size
Originally posted by LornJust got back, but only for a few.. Great chart, Lorn, but i would go back a bit further to see what may be happening. The most important low of the last week or two was the recent low of 1291.50. and using the entire initial move from there to 1305.75 may add some perspective, a little longer term.. I also look at the secondary low and even the third one looking for confluence,or confirmations...
Here are some comments and observations I'm sure Kool would agree with. Notice the green up arrow on the chart. This is the low of the O/N session and where prices started to rally. Drawing the initial projection upward you can see all the major fib levels were quickly taken out and in fact provided no resistance.
The red down arrow where the early morning consolidation occurred had prices unable to reach the 2.618 projection downward another sign the bulls were out this morning.
Some added thoughts not on this chart. 1310.50 was where VWAP was at the 9:30 open and the subsequent rally since then. As already mentioned, TICK has been incredibly strong right out of the open which in my view adds valuable weight to what the projections are saying, ie be careful trying to fade.
Click image for original size
Click image for original size
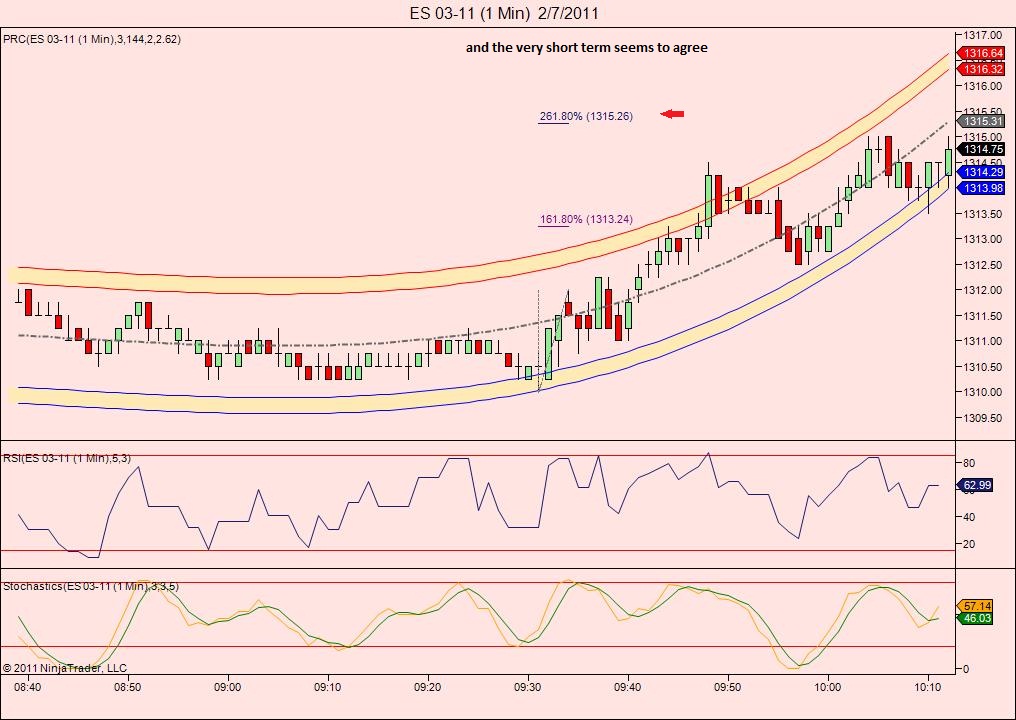
Note also that c= a at 1315.50 and the recent one min projection appears to give 1.618=1316.25 and 2.618=1314.75, so a lot of confluence there... gotta run! Good trading all!
Emini Day Trading /
Daily Notes /
Forecast /
Economic Events /
Search /
Terms and Conditions /
Disclaimer /
Books /
Online Books /
Site Map /
Contact /
Privacy Policy /
Links /
About /
Day Trading Forum /
Investment Calculators /
Pivot Point Calculator /
Market Profile Generator /
Fibonacci Calculator /
Mailing List /
Advertise Here /
Articles /
Financial Terms /
Brokers /
Software /
Holidays /
Stock Split Calendar /
Mortgage Calculator /
Donate
Copyright © 2004-2023, MyPivots. All rights reserved.
Copyright © 2004-2023, MyPivots. All rights reserved.