CL April crude oil
Click image for original size
Click image for original size
Click image for original size
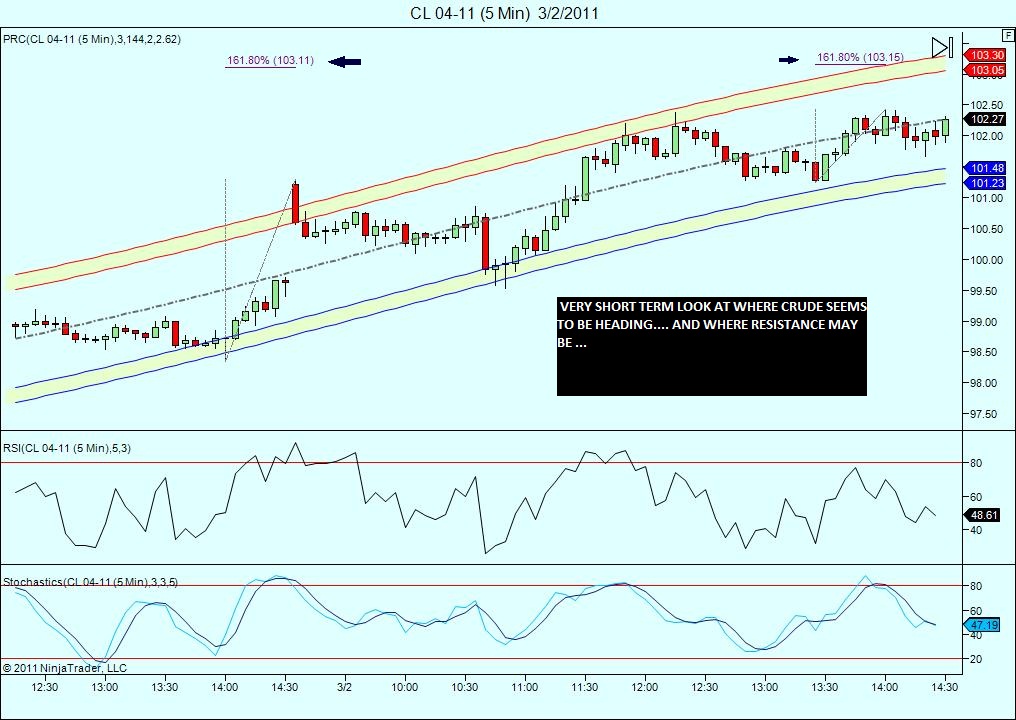
I think you are right KB. I am looking at two projections before we get there though. The GLBX low of 10037-10108 >>> 10223 for the full projection and the move off the last major down retrace 10051-10125 >>> 10245 for the full projection.
Originally posted by prestwickdrive
I think you are right KB. I am looking at two projections before we get there though. The GLBX low of 10037-10108 >>> 10223 for the full projection and the move off the last major down retrace 10051-10125 >>> 10245 for the full projection.
and the 10223 projection wold be a gap fill
10223 just hit
initial projection off of 10223 - 10197 retrace = 10181 which just hit. Full projection down = 10155 but until uptrend is broken we usually don't retrace much more than the initial projection.
Originally posted by prestwickdrive
initial projection off of 10223 - 10197 retrace = 10181 which just hit. Full projection down = 10155 but until uptrend is broken we usually don't retrace much more than the initial projection.
And break it did. 10223-10180 full projection = 10110 and it turned at 10106 and retraced 40 up cents off of it.
initial projection off of 10199 - 10165 retrace of 10144 hit. Full projection is 10110.
Originally posted by prestwickdrive
initial projection off of 10199 - 10165 retrace of 10144 hit. Full projection is 10110.
10110 hit
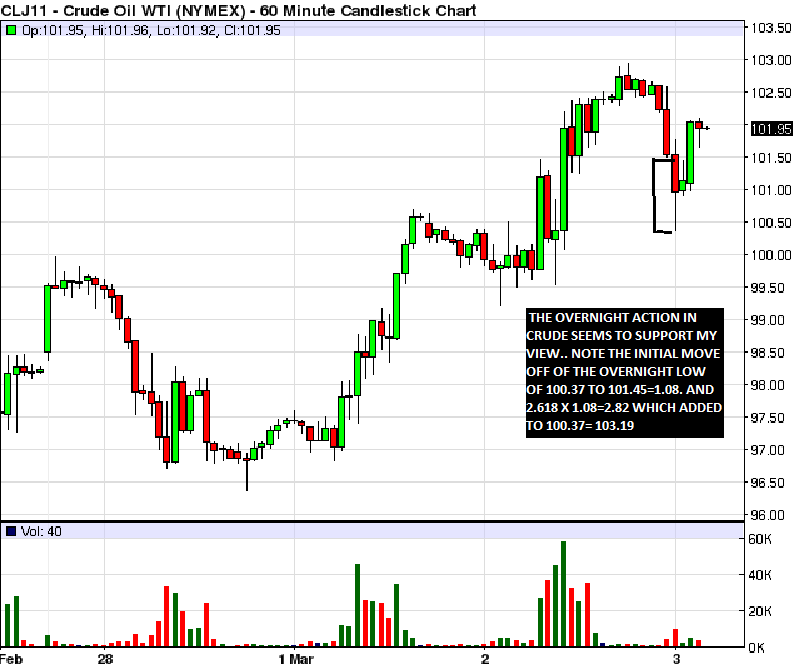
Click image for original size

On the "Here goes" thread it was mentioned how dangerous the CL is to trade and I couldn't agree more. With more risk comes potential for greater rewards but one has to stay alive by prudently and aggressively managing risk in order to live long enough to capture the reward.
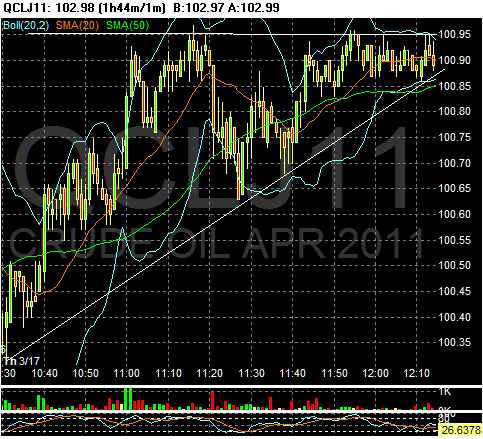
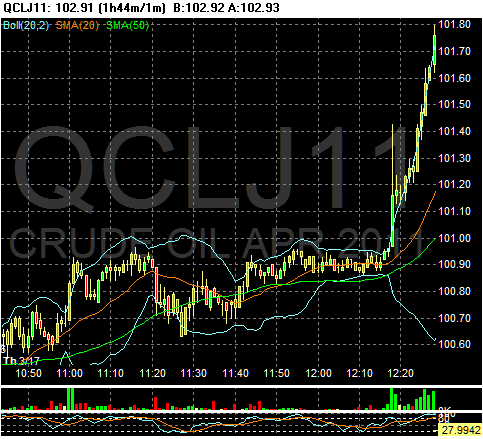
Everything with the CL moves faster and farther than an instrument like the ES. The following is an example of what I mean from last week with the CLJ contract which was the front month then. This first chart shows a typical ascending wedge.
Because the underlying trend of the market was up one could reasonably expect an up breakout. On top of that they "usual" ascending wedge continuation pattern is up and the following is what happened in the next eleven minutes after the above picture was taken:
The extent of the berakout was way more than one would usually expect from an instrument like the ES or NQ as it moved 80 cents in 11 minutes. That is $800 per contract or the equivalent of 16 ES points. What compounded the situation was the breakout point was the round number of $101. When stop losses at $101 got hit for those who were short it got really nasty. Even shorts with stops at $101 likely got hurt more than they expected because the market is so thin and their stop market orders likely got very poor fills. Those with stop limit orders just above $101 likely did not get fills at all.
The point of this is to point out the volatility of the crude oil contract and the need to be well capitilized to trade it and to really protect one's capital.
Everything with the CL moves faster and farther than an instrument like the ES. The following is an example of what I mean from last week with the CLJ contract which was the front month then. This first chart shows a typical ascending wedge.
Click image for original size
Because the underlying trend of the market was up one could reasonably expect an up breakout. On top of that they "usual" ascending wedge continuation pattern is up and the following is what happened in the next eleven minutes after the above picture was taken:
Click image for original size
The extent of the berakout was way more than one would usually expect from an instrument like the ES or NQ as it moved 80 cents in 11 minutes. That is $800 per contract or the equivalent of 16 ES points. What compounded the situation was the breakout point was the round number of $101. When stop losses at $101 got hit for those who were short it got really nasty. Even shorts with stops at $101 likely got hurt more than they expected because the market is so thin and their stop market orders likely got very poor fills. Those with stop limit orders just above $101 likely did not get fills at all.
The point of this is to point out the volatility of the crude oil contract and the need to be well capitilized to trade it and to really protect one's capital.
Emini Day Trading /
Daily Notes /
Forecast /
Economic Events /
Search /
Terms and Conditions /
Disclaimer /
Books /
Online Books /
Site Map /
Contact /
Privacy Policy /
Links /
About /
Day Trading Forum /
Investment Calculators /
Pivot Point Calculator /
Market Profile Generator /
Fibonacci Calculator /
Mailing List /
Advertise Here /
Articles /
Financial Terms /
Brokers /
Software /
Holidays /
Stock Split Calendar /
Mortgage Calculator /
Donate
Copyright © 2004-2023, MyPivots. All rights reserved.
Copyright © 2004-2023, MyPivots. All rights reserved.