Reply to Liam
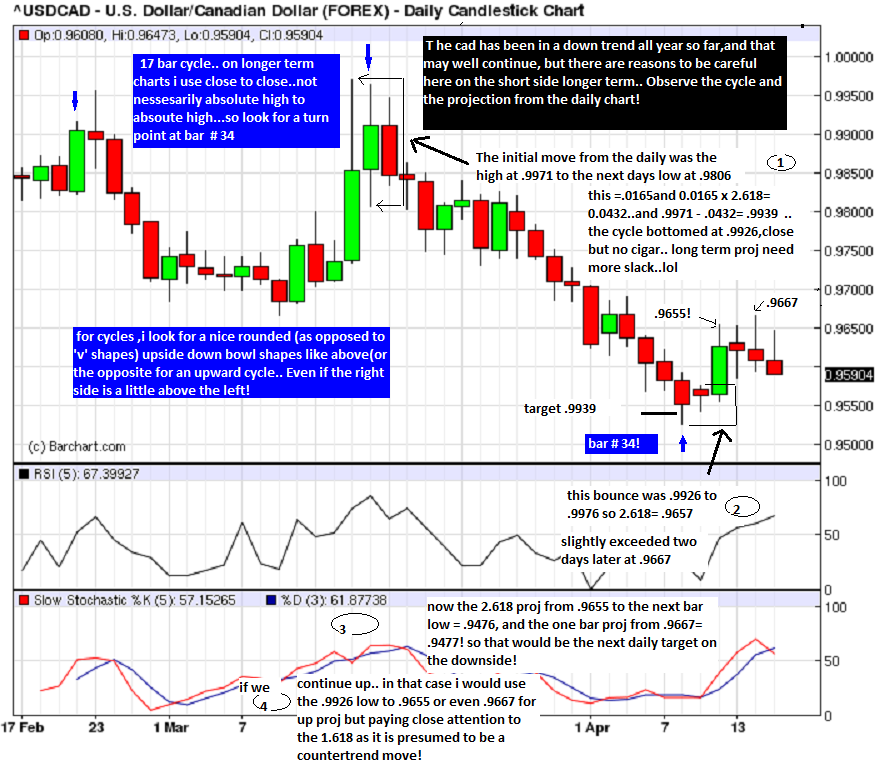
I have no set rules on how i determine the exact initial move.. perhaps i should! Its a very visual judgement and therefore somewhat subjective. However, i do usually look at what i consider the initial move (#3 on your chart) and the full initial move(#4 ? on your chart) . Most times i look at a bigger chart also, like the 15 min for perspective on what might really be the initial move. Remember, it all depends on how long or short term orientated you are! Your chart seems to indicate to me you have a pretty good handle on the concept!.. just for fun, and to show the thought process ,here is a look at the daily chart. By the way,THE PRICES MAY VERY SLIGHTLY DIFFER FROM YOUR CHART since spot prices are different from say, IMM or CME exchanges. For instance this chart has .9667 as the high where you have .9669. But again, the intent is to show the thought process, more than anything else!...
Click image for original size
Click image for original size
thanks I got your pm. For the benefit of others here was the chart I sent. USDCAD last Thursday 5min, times are GMT (I was sending it to a friend of mine so I was detailing the various aspects of the trade)
is was a great trade, losts of fib ratios confluence which I like to see.
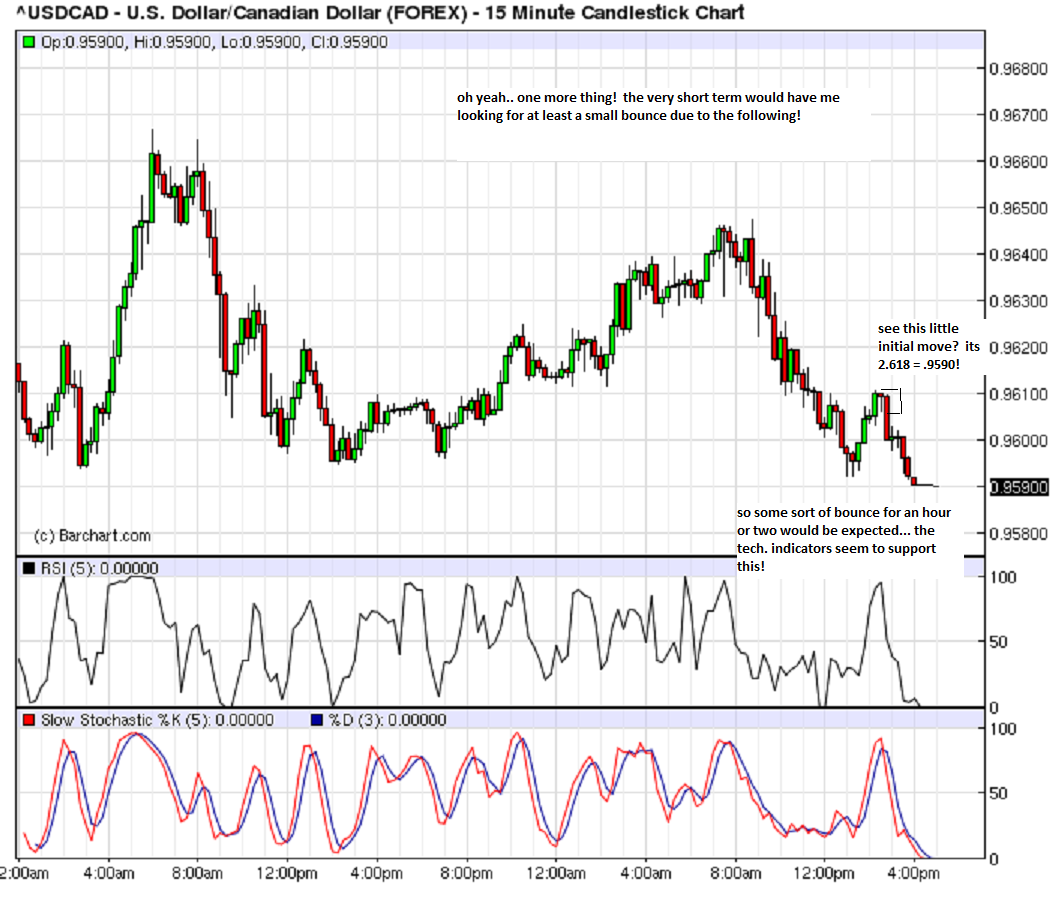
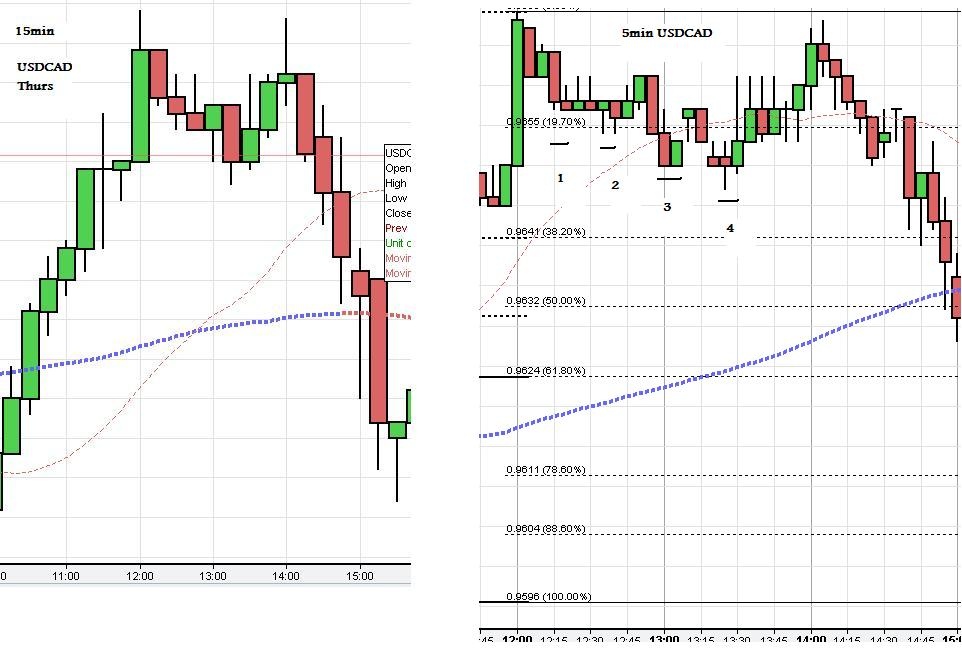
I zoomed in on the initial move with a 15min and 5min chart, your suggestion to look at the 15min helps here and seems to make #2 the point to use.
KT, based on your own trading strategy for intra day where would you have entered the sell? do you look for confirmation of the secondary high along the lines I suggest or would try and catch the second high in some manner?
Thanks
is was a great trade, losts of fib ratios confluence which I like to see.
Click image for original size
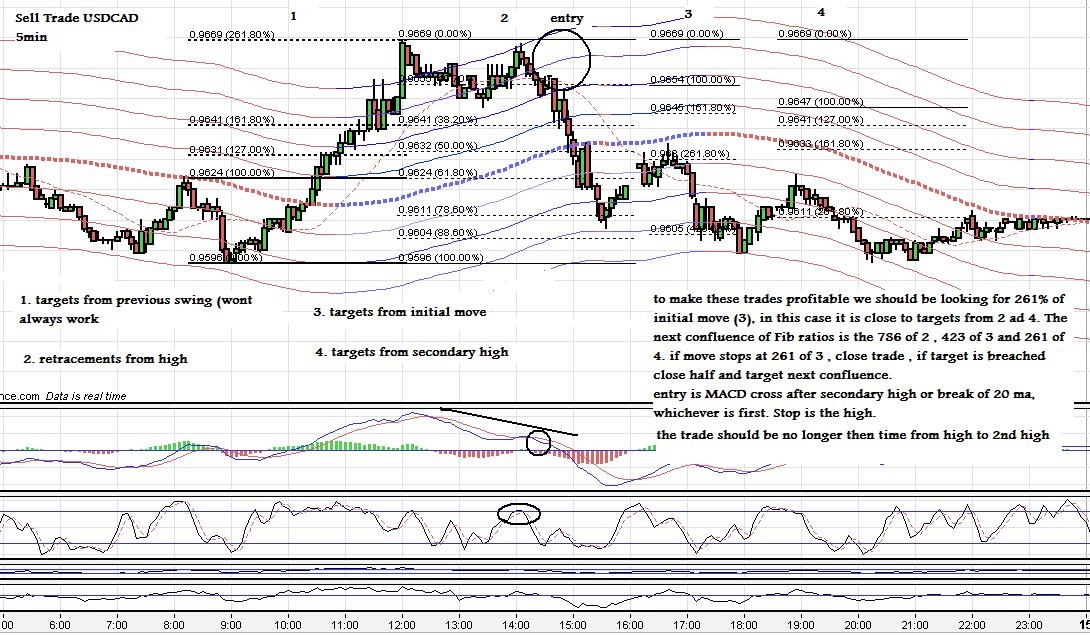
I zoomed in on the initial move with a 15min and 5min chart, your suggestion to look at the 15min helps here and seems to make #2 the point to use.
KT, based on your own trading strategy for intra day where would you have entered the sell? do you look for confirmation of the secondary high along the lines I suggest or would try and catch the second high in some manner?
Thanks
Click image for original size
refer to my first chart ... " i would be looking for the 1.618 from .9590 to 9655 or even .9667... .9667 s 1.618= .9715... the defense rests!...lol
Observe the first chart..." now the 2.618 proj from .9655 to the next bars low=.9476 and the one bar projection from .9667=.9477 so that would be your next daily target on the downside!".... .9475 hit today!
KB "Observe the first chart..." now the 2.618 proj from .9655 to the next bars low=.9476 and the one bar projection from .9667=.9477 so that would be your next daily target on the downside!".... .9475 hit today!"
I see that very cool. when would you have spotted that? is it something you would have looked as it when it started making new lows?
I see that very cool. when would you have spotted that? is it something you would have looked as it when it started making new lows?
I've been watching that since my post on 4/17.. remember ,thats a daily proj... i use much shorter term charts for actual trading....kool
Emini Day Trading /
Daily Notes /
Forecast /
Economic Events /
Search /
Terms and Conditions /
Disclaimer /
Books /
Online Books /
Site Map /
Contact /
Privacy Policy /
Links /
About /
Day Trading Forum /
Investment Calculators /
Pivot Point Calculator /
Market Profile Generator /
Fibonacci Calculator /
Mailing List /
Advertise Here /
Articles /
Financial Terms /
Brokers /
Software /
Holidays /
Stock Split Calendar /
Mortgage Calculator /
Donate
Copyright © 2004-2023, MyPivots. All rights reserved.
Copyright © 2004-2023, MyPivots. All rights reserved.