YMM1, (3, -1), open short offset basis Stretch
Hi,
Last night I posted my June e-mini $5 Dow futures (YMM1) short, 12675 (21:13PDT).
Open position: YMM1 short 12675 (21:13), rational ... trading from unchanged, 12641 + 1.618% of the Stretch = 12641 + 42 = 12683 (high=12687). Fading the first move higher with a price projection that applies the (3, -1) formula. This is a 'Federal Reverse President (Bernanke) Press Conference rally,' i.e., when there is chaos markets fall. Today President Obama produced a birth certificate and Bernanke produced a press conference.
Trading from unchanged, 12641 + 1.618% of the Stretch = 12641 + 1.618% of the Stretch = 12641 + 42 = 12683
12687 = high as of 0720PDT
12687 - 26 - 26 - 26 = 12609. 12609 = low as of 07:15PDT)
Short 12675 - 50 points profit = 12625
Fifty points profit at $5 points per tick = $250 per contract.
Basis $672.50 intra-day margin for the June e-mini $5 Dow futures $250 profit per contract = 37% profit less commissions, fees, etc,....
If you do this everyday, and make no mistakes, and you are fully leveraged... it will take you approximately 25 trading days (35 calendar days) to become a millionare. Your target date to have at least $Million in your trading account is 02-Jun-2011.
http://www.mypivots.com/calculators/day-trader-millionaire-calculator.aspx
Starting capital: $672
Capital base per contract traded $672
Number of trades per day: 1
Round trip commission per contract: $5.00
Average points profit per trade: 50
Value of 1 point: $5
It will take you approximately 25 trading days (35 calendar days) to become a millionare. Your target date to have at least $Million in your trading account is 02-Jun-2011
Step into the middle, and do the heavy lifting.
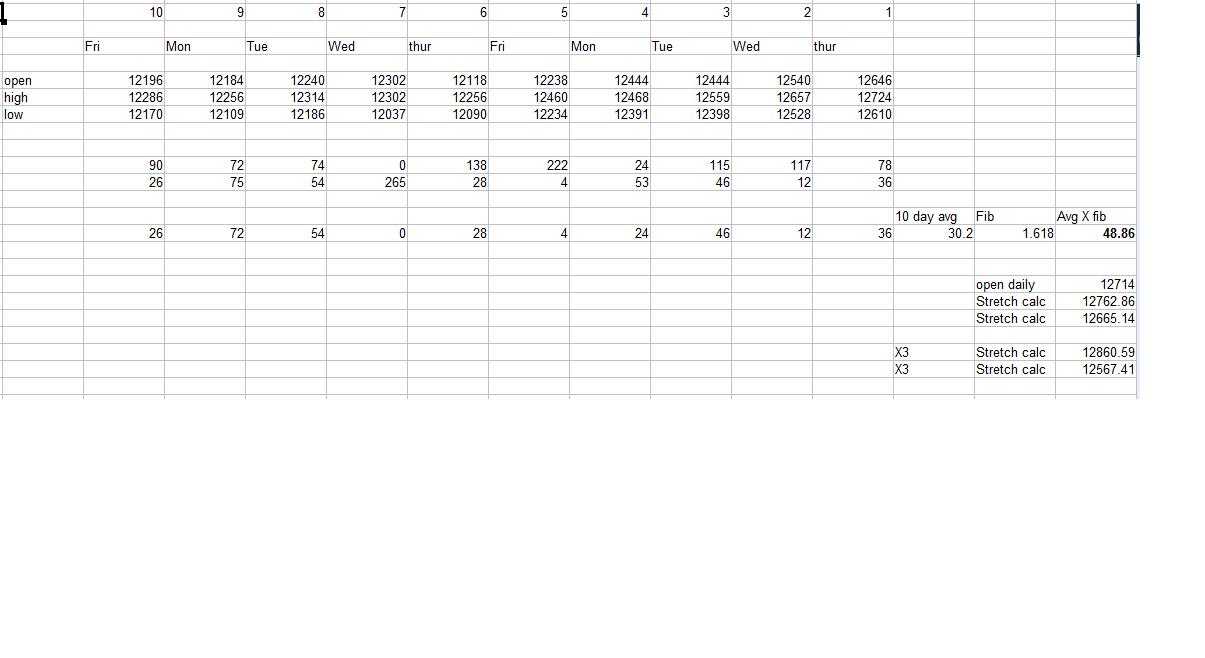
can someone let me know if this is about right? I am using a daily futures chart, ignored Sunday.
to use this I would have to put in buy and sell orders so stops are a issue? between 30 or 40 from the calculation seem reasonable? I would miss the Asian trading session but can catch the Euro session on to cancel the side that will not be activated.
So far today neither level reached. Will watch with interest.
Click image for original size
Hi Silverharp,
My slow response, my bad. I may have missed your replies because I usually (never until recently) read the "trading strategies and setups forum."
The markets are mecurial. Thanks for your shared mutual interests. For the most part, all information is factored into price. Price is a temporary consensus of value, which is always wrong. Price is always searching for value.
With that disclaimer, lol, ... you're calculations are counting from the open. I've learned to trade from unchanged.
Your data appears to apply, from the open, only the Stretch calculation, and not 1.618% of the Stretch from unchanged. Trading in the early A session may serve you better than getting caught up in the volatility that you'll find with the much greater volume during the B session.
27 April:
This technique may serve you. My notes printed something like the following: "Where there's leadership, there is calm (read: rallies) in the market. And where there is chaos, the markets fall. Mr. Bernanke held the Federal Reserves first press conference. This represented transparency and leadership. The end result, given that that press conference was known a few day's in advance... the market rallied. And, President Obama produced a birth certificate. (That's a non-event, more entertaining than anything else.)
Throw into the mix that the June e-mini $5 Dow continued rallying away from the respective pivot points, the trend was up.
Now the Stretch analysis:
Previous settlement: 12517
Stretch = 26 = 12543 or -12491
1.618% of the Stretch = 42 = +12559 or 12475
2.618% of the Stretch = 68 = 12585 or - 12449
4.25% of the Stretch = 110 = 12627 or -12407
4.25% is often close to the daily trading range.
The 26 April last hour pullback into the close was from the 26 April high 12560, and settled at 12517. The 27 April A session opened at 12524, with a low at 12514 (12560 - 12514 = 46 and 1.618% of the Stretch = 42. (See: Bernanke, ... 1st time Fed conference in 97 years). Here's the finesse, you measure the previous B Session's last price rotation, in the case of the late 26 April B session high, 12560, into 27 April's A session (and day's low.... read: respective day's Bernanke rally low) at 12514. That'll give you a 1.618% of the Stretch. So
26 April B session high - early A session low = 46 points (see 1.618% of the Stretch) This is where you start looking for follow through from the previous session's follow through that corrolates with the A sessions early range with respect to the Stretch, or 1.618% of the Stretch. You are counting price measurements from the previous and the current sessions and also the new trading session's Stretch (and the Fibonacci of the Stretch ... also look for a micro count of the Stretch (Look back a few more days previous to 27 April... +22 = -1 of the micro intra-day trend [micro=tiny range from the open] followed by -22 three times = 3 of the (3, -1) where traders took profits and reversed up for the remainder of the day once that low had been established and the pivot point became a thing of the past).
Here are the reversals. Look at the reversals with an eye to the Fibonacci ratios of the Stretch calculation.
26 April @ 12:15PDT 12560 - 12514 (13:31PDT) = -46 points
27 April @ 13:31PDT 12514 + 40 = 12554 (06:54PDT)= +40 pts (1.168%=42)
27 April @ 18:34PDT 12554 - 27 = 12527 (Stretch=26)(00:46PDT)
27 April @ 00:46PDT 12527 + 65 = 12579 (06:54PDT) (2.618%=68)
27 April @ 06:54PDT 12579 - 40 = 12539 (08:00PDT) (1.618% = 42)
27 April @ 08:00PDT 12539 + 66 = 12605 (11:00PDT) (2.618% = 68)
27 April @ 11:00PDT 12605 - 30 = 12575 (11:17PDT) (Stretch = 26)
27 April @ 11:17PDT 12575 + 83 = 12658 (12:42PDT) (83 points,... broke out of previous consolidation by 50%'ish in late B session trading, ... but I digress.)
End of B session:
27 April @ 12:42PDT 12658 - 29 = 12629 (12:58PDT)settle 12641
28 April:
Previous settlement 12641
Stretch = 26 = = +12667 or -12615
1.618% of the Stretch = 42 = +12683 or -12599
2.618% of the Stretch = 68 = +12683 or - 12573
4.25% of the Stretch = 110 = +12751 or -12531
27 April @ 12:58PDT 12641 into 28 April A session + 46 points = 12687 (19:35PDT)
28 April 19:35PDT 12687 = A session high and reversal
28 April 12687 - 78 = 12609 12687 - 1.618% = 12619 where prices revesed +4.25% into the close 12719 (Closing high = 12724)
Low to high = 12609 + 115 = 12724
4.25% of the Stretch = 110
This walked you through the technique with times, reversals and rational for taking a profit along the way.
Worrying about all the other markets is ego.
Single mind. Single focus.
http://www.mypivots.com/calculators/day-trader-millionaire-calculator.aspx
Starting capital:
Capital base per contract (self-imposed / broker imposed):
One trade per day: 1
Round turn commission: $5
Average points per profit: 20 points
Value of a point: $5
It will take you approximately 97 trading days (133 calendar days) to become a millionare. Your target date to have at least $Million in your trading account is 11-Sep-2011.
Emini Day Trading /
Daily Notes /
Forecast /
Economic Events /
Search /
Terms and Conditions /
Disclaimer /
Books /
Online Books /
Site Map /
Contact /
Privacy Policy /
Links /
About /
Day Trading Forum /
Investment Calculators /
Pivot Point Calculator /
Market Profile Generator /
Fibonacci Calculator /
Mailing List /
Advertise Here /
Articles /
Financial Terms /
Brokers /
Software /
Holidays /
Stock Split Calendar /
Mortgage Calculator /
Donate
Copyright © 2004-2023, MyPivots. All rights reserved.
Copyright © 2004-2023, MyPivots. All rights reserved.