ES Tue 8-9-11
It's been a while for me posting. In this large volatility I have ONLY been trading at the low volume points on the chart. You will find that when these get broken from a previous day the market will very often come back to retest the area again. In other words the market will take some time to "fill in" the low volume zones.
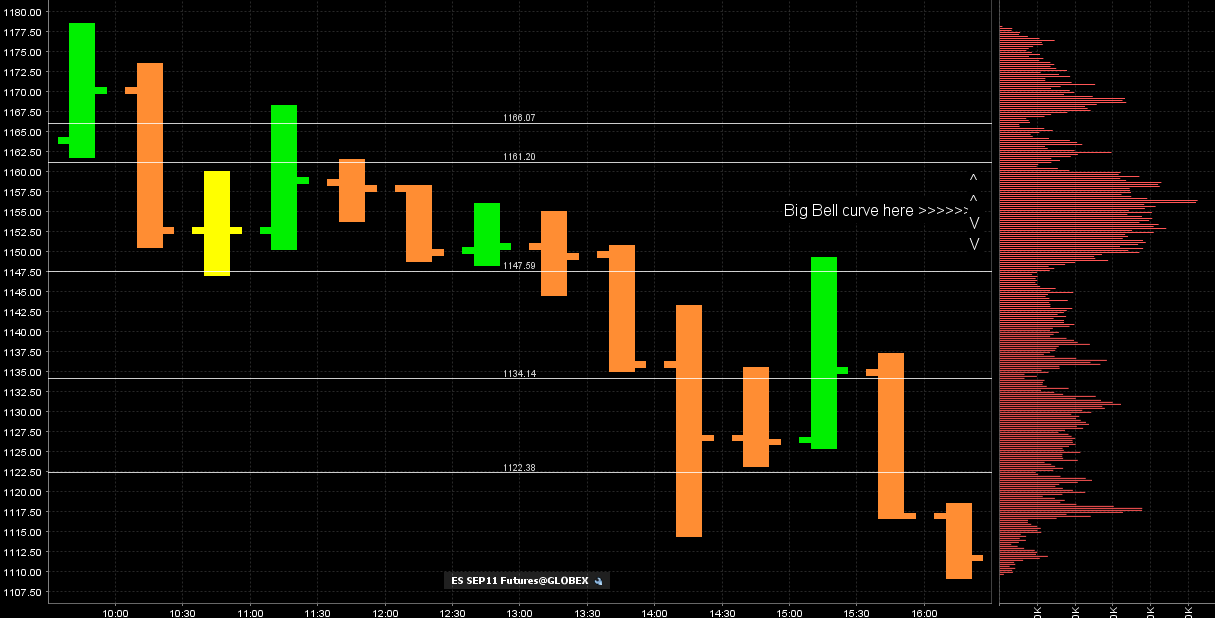
The initial ones I used from Fridays trade where at 1168 , 1171 and 1176. These are not snapped off on my chart that I am posting here but you can see how the market respected them today early on.
I am always looking at what happens with my footprint chart at these zones. For example if I have a number at 1122.50 and we are approaching that number from below then I will look for sells in and around that number. If we don't reject the number immediately then we may pop up above it and I will continue to look for sells for the retest back down. News events are the hardest part and need to be approached with caution.
So with this big range from today we can see how the low volume prices I have snapped really only just separate miniature bell curves. That should be the real take away from this post.
Here are the low volume prices typed out and hopefully you can see them while looking at the volume histogram on the right.
1122.50
1134.25
1147.50
1161.25
1166
here is the chart:
Click image for original size
great piece. ty for posting!
Originally posted by Lisa P
If you are not trading, take a look at this. If this is true, S&P should be in trouble. OF course these MFs will never admit...
http://www.cnn.com/2011/OPINION/08/09/obama.right/index.html?hpt=hp_p1&iref=NS1
Gunwalls, yw. Sorry for the language.
Using Kools Tools, the move off the Fed statement was 1144.5-1112.0. That gives an initial projection of 1092.0 and a full of 1059.25. These projections are valid until 1144.5 is hit again.
Emini Day Trading /
Daily Notes /
Forecast /
Economic Events /
Search /
Terms and Conditions /
Disclaimer /
Books /
Online Books /
Site Map /
Contact /
Privacy Policy /
Links /
About /
Day Trading Forum /
Investment Calculators /
Pivot Point Calculator /
Market Profile Generator /
Fibonacci Calculator /
Mailing List /
Advertise Here /
Articles /
Financial Terms /
Brokers /
Software /
Holidays /
Stock Split Calendar /
Mortgage Calculator /
Donate
Copyright © 2004-2023, MyPivots. All rights reserved.
Copyright © 2004-2023, MyPivots. All rights reserved.