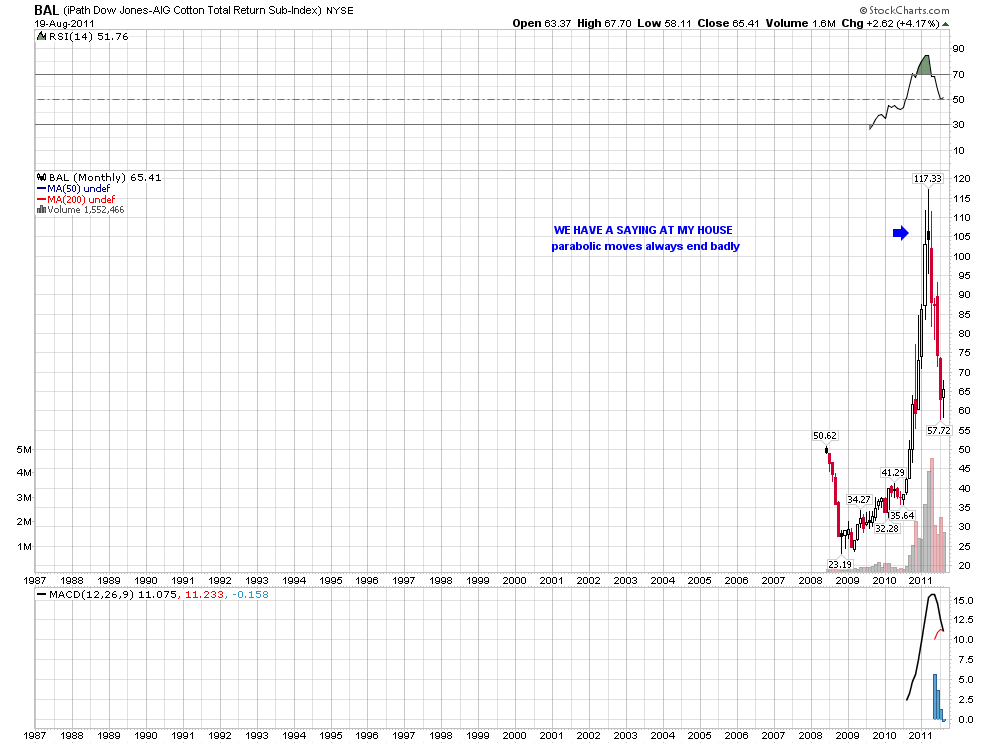
This is real interesting, and really lines up with what I think is coming. I sure wish I could believe the people who say gold is headed for $300, but I can't...
http://slopeofhope.com/2011/08/goldy-von-moldy.html
JI
jimkane
Rep: 3,058
Posts: 33,089
And let me ask this (not that this is going to happen anyway...). If gold did drop to say $1250 from somewhere in here, who would load up? You? And who would say it is then headed up to $5,000? Compare that to how many would say it's in a huge bear market... See the point?
RO
roofer
Rep: 3,689
Posts: 3,574
as always, if the geometry was there and there was a trade signal, i would...
JI
jimkane
Rep: 3,058
Posts: 33,089
Yep, the question is, at what level does gold end its run? Here? $5,000? $10,000? Gold should stop running when money printing ends. That would happen when we shift back to a hard money policy. This cycling from hard money to loose money and back happens regularly. FOFOA (Google it) has a long article on this, and how it's played into many revolutions, like the French revolution.
How soon could we shift our entire system to hard money, no printing? That's when gold should stop rising, I'd think. On the other hand, if gold is in 'weak hands', which all these hedge funds actually would be, if they are forced to deleverage (again, how can that be if the money printing is still going on???), then they would all have to bail at the same time (along with stocks, treasuries, everything they hold), and gold would drop like crazy (theoretically, since China and India may be willing to take all they can buy at even a little lower price).
The powers that be want gold lower, so they may trigger this event, but in doing so, they would also likely drive the S&P to or below the 2009 low level. Bottom line, gold may drop like a rock, but without knowing from where, or when, it doesn't do me much good. And if the system does melt down totally and all fiat currencies worldwide go to zero (which I suspect is going to happen), will gold drop? Not likely. So, this 'bubble' may act differently than any other bubble, for some time (and using bubble here bothers me because I don't think gold is in a bubble).
Gold only appears parabolic when priced in any given fiat currency. Plot its buying power (I recently saw a chart of home prices in gold) and you'll see gold is generally fairly steady, as it is now. Gold is not going up, fiat currencies are going way down, fast. That's not a bubble, it's not even appreciation. Something to think about.
As an aside, chart gold in log scale. Arithmetic scale is mathematically 'incorrect' (perhaps better termed 'deceiving') because the price scale is over such a large range. You'll see it isn't actually parabolic at all, but slow, steady, and very linear. All log scale does is show the price change in 'percent' terms, if you will, in proportion to the price, and not in absolute terms. Is a move on a $1 stock to $2 the same as a move from $500 to $501? Then why does an arithmetic chart make it seem so, with scaling the same? Log scale 'fixes' this. Look at gold on a log scale and tell me it's a bubble...
JI
jimkane
Rep: 3,058
Posts: 33,089
Here's a weekly gold chart for the last ten years, in log scale. Looks pretty steady to me. This, flipped over, is what they are doing to your savings every year. It does look a little overextended in here, so a pullback is 'overdue'.
Chart courtesy QCharts.
Click image for original size
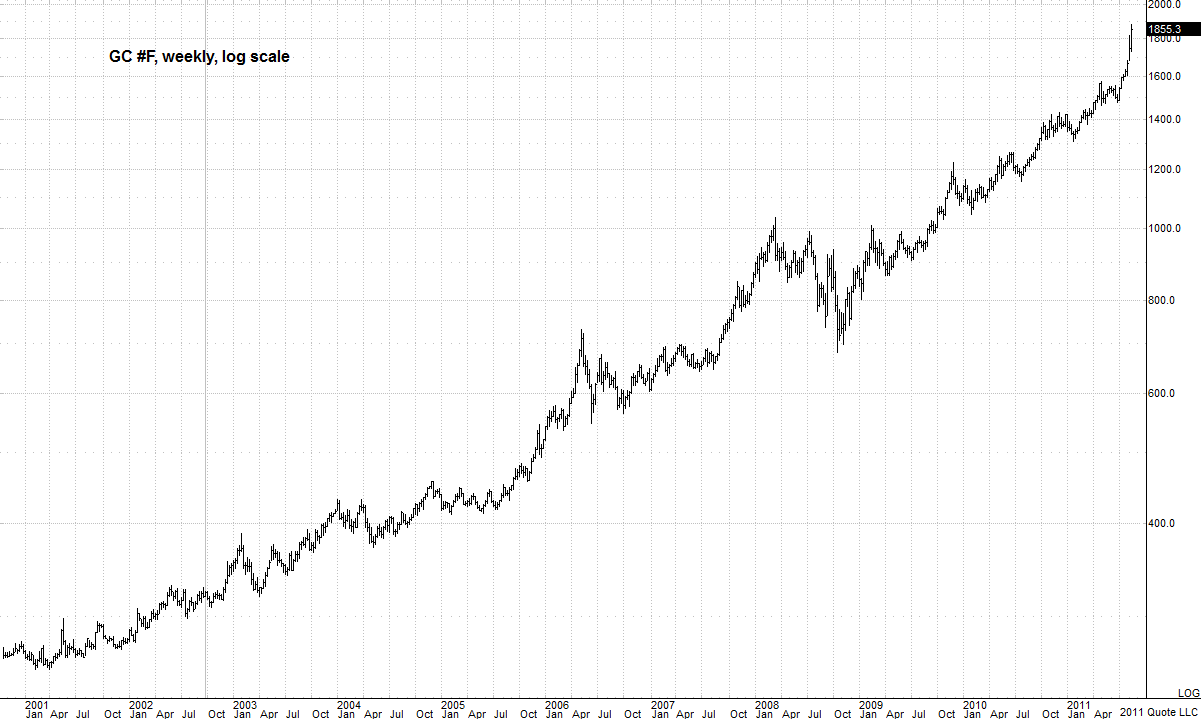
Chart courtesy QCharts.
JI
jimkane
Rep: 3,058
Posts: 33,089
And some thoughts on the upcoming correction in gold:
http://slopeofhope.com/2011/08/bubblicious-gold.html
http://slopeofhope.com/2011/08/bubblicious-gold.html
RO
roofer
Rep: 3,689
Posts: 3,574
as a kane trader, the one thing that sticks out like a sore thumb in the charts seemingly fractal in nature is that the naz chart had enough of a selloff between b and c that a medianline set could then be anchored with projected downside targets off d...... glaringly lacking in gld chart.....
JI
jimkane
Rep: 3,058
Posts: 33,089
So, a gold correction is finally started, right on schedule. I am pretty excited. I have one area to watch around 1735, and then a broad multiple line area from perhaps 1675-1710. I'd love a steeper correction than that (1250 would be nice...), but I'm not even sure it will get down to the lower level. Likely the Chinese and others will start accumulating big time in here soon.
Still, if TPTB decide to do a series of margin hikes, that may cause some temporary liquidation, and down it will go, swiftly. Unless Bern-quacke does indeed announce something soon that is inflation/gold positive, gold could struggle if a forced liquidation starts. But in the long run I see little recourse than total destruction of the dollar (not the relative dollar index, the absolute purchasing power of the dollar for goods and services), and that is gold positive.
But, as I have said many times, if Europe starts to collapse, or any other big event, there may be a flight to dollars, and one view is that would put pressure on gold. I'd think there would be a huge flight to safety, and gold would go up in that case. I just can't make any case for gold going down other than corrections, forced liquidations, and other market manipulations.
JI
jimkane
Rep: 3,058
Posts: 33,089
And here's the CME gold margin hike, as expected:
http://www.zerohedge.com/news/and-theres-your-perfectly-leaked-explanation-cme-hikes-gold-margins-again-time-27
http://www.zerohedge.com/news/and-theres-your-perfectly-leaked-explanation-cme-hikes-gold-margins-again-time-27