MyPivots
Sign In
JI
jimkane
Rep: 3,058
Posts: 33,089
I mention, from time to time, the importance of looking at log scale when the range is large multiples of price. Many overlook this. I mentioned the importance of this in my recent gold post.

http://www.mypivots.com/board/topic/6920/1/real-interesting-gold-chart

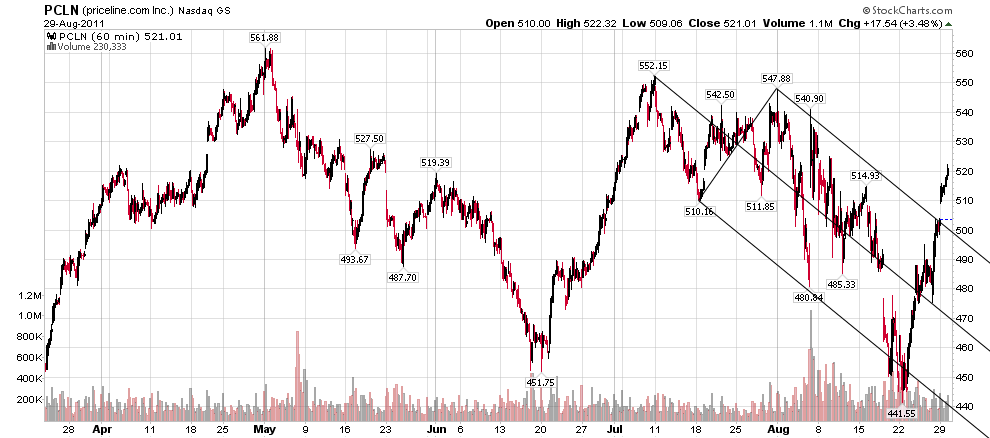
Let's look at a setup I found in PCLN. I'll start with the daily first. A nice ABCD with good local lines on the ABCD, at a key .300. But what about the necessary upsloping line? And to answer the preemptive question from those highly skilled at my methodology, yes, there is another, less significant upsloping line that I haven't shown.


Click image for original size
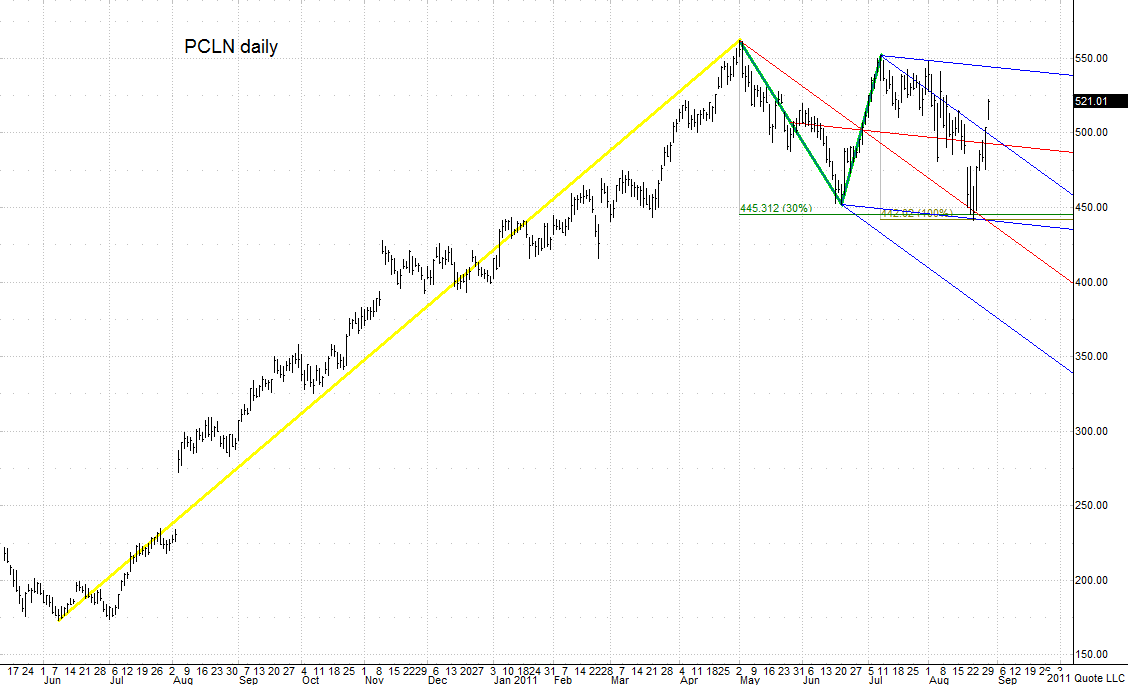
PCLN daily 082811


Let's jump to the weekly, with an obvious potential TL line on there. (I removed the standard set because standard sets can't be used on log scale, although I left the modified Schiff because the program calculations don't skew that.) Hmmm, not even close. It doesn't look like I'm going to be able to find a decent line to build my synergy with...


Click image for original size
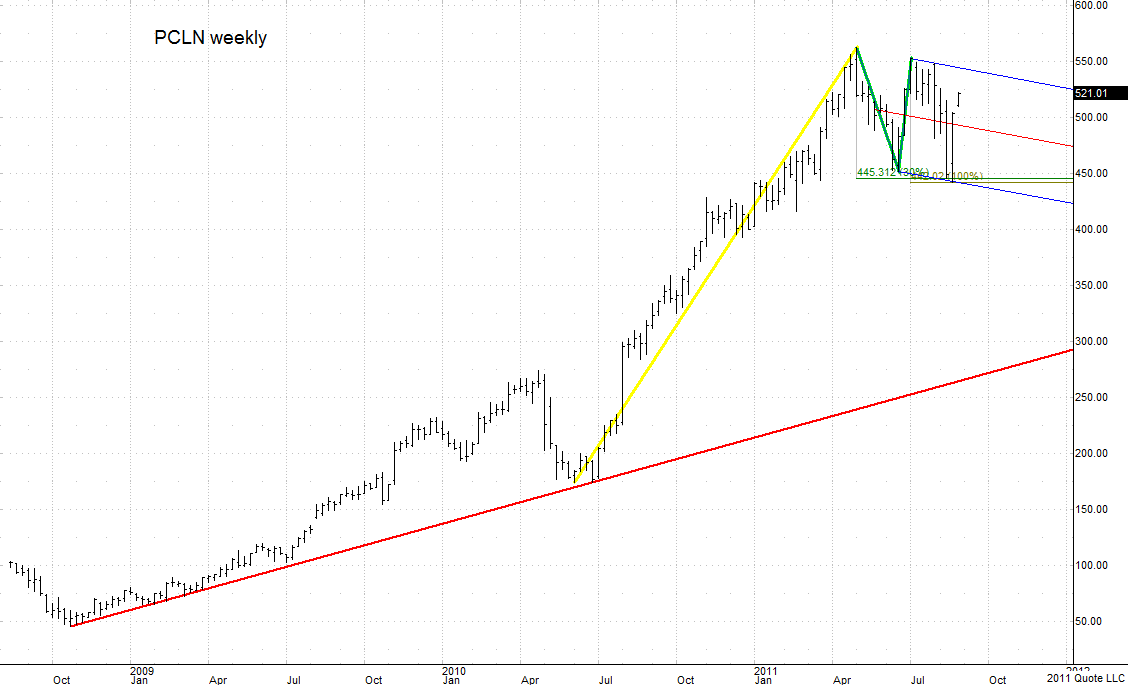
PCLN weekly 082811-1


Let's log scale this chart, just for grins, to see if that shows anything useful.


Click image for original size
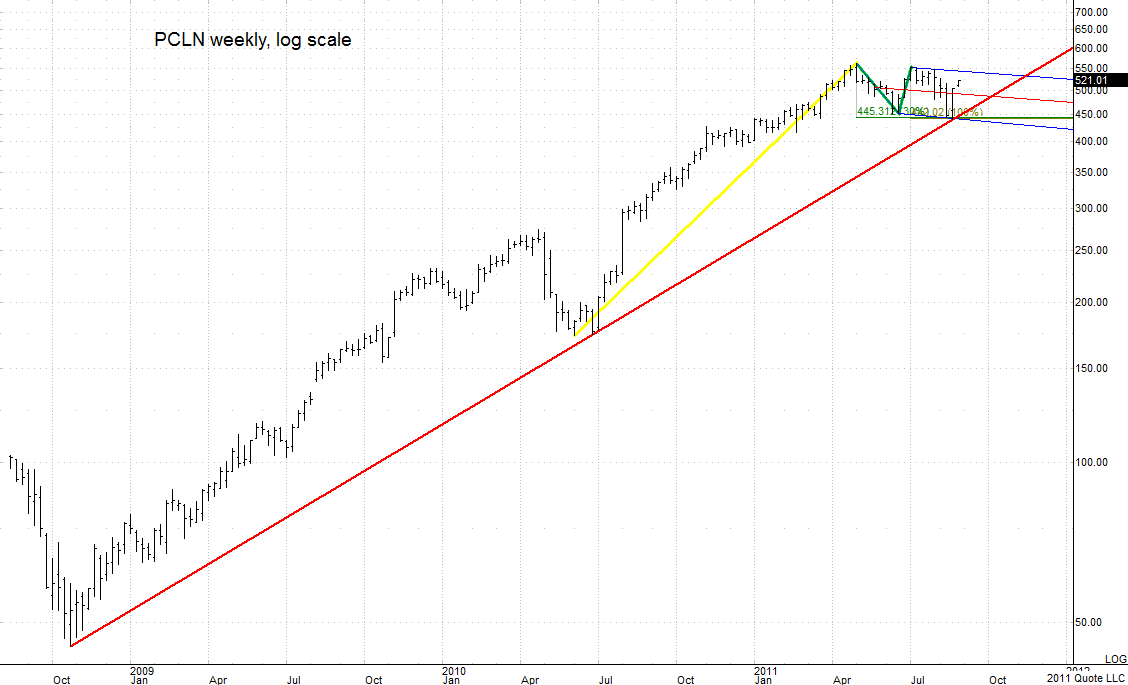
PCLN weekly 082811-2


Well, now, isn't that interesting. This is something I want to be checking for. It gave me the line I needed to consider this as a potential trade setup. I find log scale lines extremely valuable.


Charts courtesy QCharts.
JI
jimkane
Rep: 3,058
Posts: 33,089
If you find this kind of post useful, vote it up. If I don't get a slew of votes on this, I'm not going to do posts like this anymore. I need to know if I'm wasting my time or not. Let me have some feedback.
RO
roofer
Rep: 3,689
Posts: 3,574
jim my only reply would be to show my trades in pcln this month which were based on tools shown here before.. linear not log../ if you are saying you have done the research and are about to show a whole new area... i will certainly vote it up!
TO
TonyC
Rep: 99
Posts: 471
nice refresher J, Log charts are often overlooked and I admit guilt on this one as I rarely use this tool in my game plan anymore. We've discussed this a few years back you and I, but mostly for context analysis not for synergy support but I can see this being very useful on very large range of price data. Those who rely much on linear geometry in their chart analysis might miss valuable information without the log version on.
You've just shown us something practical that actually WORKS!
U've got my vote J.
T
RO
roofer
Rep: 3,689
Posts: 3,574
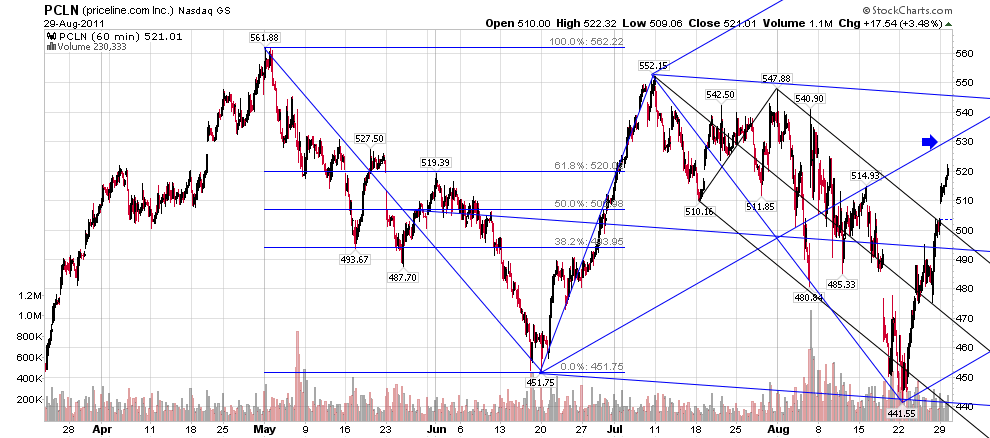
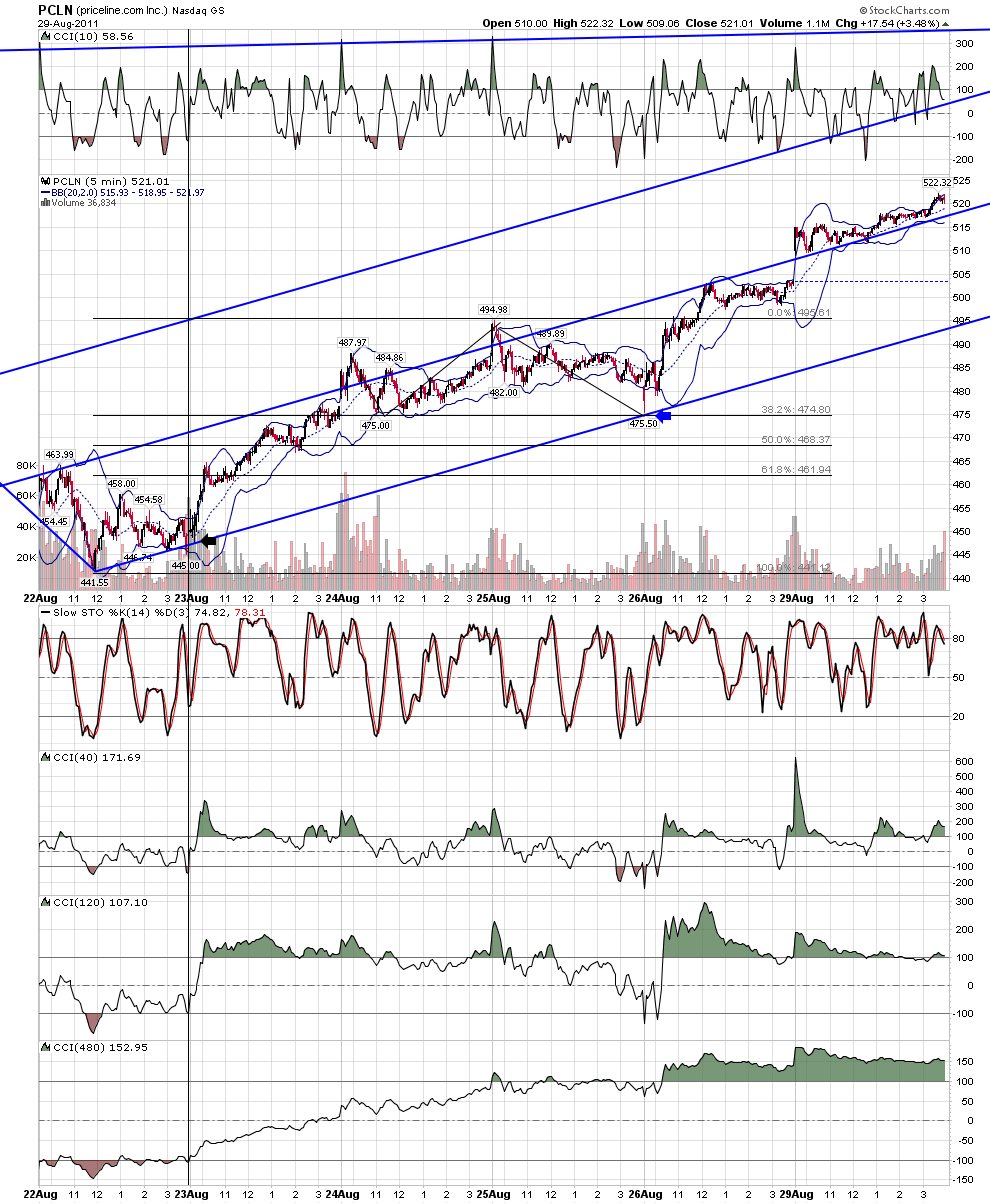
went short at .886 on gap on 5. covered at 62... not happy that i left 20 on table.... drew in modified schiff.. saw turn... saw that NON LINEAR indicator setup was ideal as i have shown before... bought retest at arrow...looking to dump @530 or better tomorrow. just a different view... that includes non linear..
Click image for original size

Click image for original size

Click image for original size
JI
jimkane
Rep: 3,058
Posts: 33,089
Nah, roofer, I don't have anything new to present from a research standpoint. I'm just saying that for higher timeframe setups (and even some lower timeframe ones) with a wide price scale range, I have found it useful, when drawing lines, to make sure I look at log scale also, as seen in my example. I've found it useful, so I'm just passing the concept on. My comment on votes was just to remind people, unless you tell me if something I post is useful, I don't know, and hence I am not inclined to keep posting those types of things if I get no feedback.


Originally posted by roofer

jim my only reply would be to show my trades in pcln this month which were based on tools shown here before.. linear not log../ if you are saying you have done the research and are about to show a whole new area... i will certainly vote it up!