ES SRs and Fibs 11/08/11
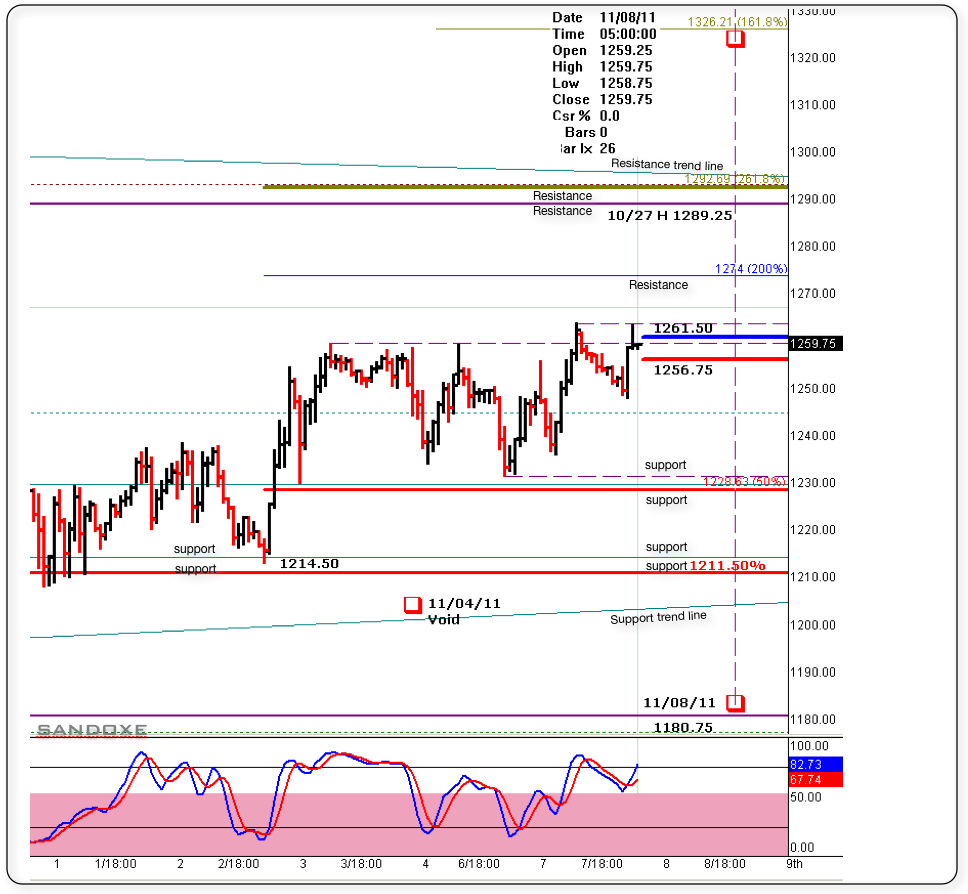
Below is a 60 minutes chart with today's session set-up. The blue (1261.50) and red line (1256.75) are my guide lines to focus on buying or selling. If the price is above 1261.50 I will focus on buying set-ups till it gets to some type of resistance. Conversely, if the price is below 1256.75, I will focus on short set-ups till the price gets to some type of support and so on.
I'm so far from my objectives and time is running out! But, I never know what the market is going to do. I just do the best that I can with what the market gives me.
P.s. I'm still dealing with MF Global about my money, so posting is a bit slow for me.
As always, the market has the last word and in due time will show us the way.
Right now, next hours, next days, next weeks, next months and next years to come, I see for you the same I see for my self: Having the very best of luck, fun, awesome, incredibly profitable trading experience!!
Click image for original size
Here is a short video that explains how I use the S/Rs posted here. In this video you are going to see, what usually happens to traders, no matter what time frame is being used. The name of the video is " SP 500 ES trading WTF HAPPEN????"
(I like making them, much easier for me, and fun!)
enjoy!
(I like making them, much easier for me, and fun!)
enjoy!
Above both the 1250 and 1258.50 62% retrace levels.
1263 the 68% retrace level(1208-1289).It was the first high in ON, followed by a correction to 1250. Then double topped(imo) with a subsequent retest of 1258.50- reconfirmed relevant fib levels from above in addition to yesterdays confirmations on the lift.
1267,1271.50,1274 and 1283 above with 83 being the fib target.
At 64.75 and needs to break and hold.
1267 the baseline previously noted for the H&S pattern from first half of the year. Will see how it behaves with that line.
Below, the levels noted. Under 1258.50 and 1250 not a positive.
My open line at 1264.75
Top of the first 1 min candle after 9:30
working on the gap
partial filling would be positive
comlete is neutral to me
63 now R
Top of the first 1 min candle after 9:30
working on the gap
partial filling would be positive
comlete is neutral to me
63 now R
Originally posted by DavidS
My open line at 1264.75
Top of the first 1 min candle after 9:30
working on the gap
partial filling would be positive
complete is neutral to me
63 now R
same day- same setup as the AM
1264.75 has to hold for higher
higher low above 63, but not yet imo for 64.75
same levels except add 61.50 for this wave up
otherwise we're just bumping that baseline from beneath-1267 area
maybe different result???
1268.50 S/R level here
definitely don't want to lose the higher low above 63
I'm staying with the baseline theory as it's an ascending line and a couple of points higher okay,
higher low above 1270, I might convert
I have a trendline from O/N high to todays high above for reference and so far holding
fib target 1283 and disappointment is punished
1268.25 a higher low while I typed above 64.75
needs to hold and doing so here, so far
needs to hold and doing so here, so far
didn't take entry off the 71.50 higher low above 70, just couldn't do it'
sometimes it's what you feel
I'm not talking gut instinct
More like your brain has more info than you can process while conscious.
Like taking a test,go with what you brain tells you first kind of thing, if in doubt.
later all.
sometimes it's what you feel
I'm not talking gut instinct
More like your brain has more info than you can process while conscious.
Like taking a test,go with what you brain tells you first kind of thing, if in doubt.
later all.
Emini Day Trading /
Daily Notes /
Forecast /
Economic Events /
Search /
Terms and Conditions /
Disclaimer /
Books /
Online Books /
Site Map /
Contact /
Privacy Policy /
Links /
About /
Day Trading Forum /
Investment Calculators /
Pivot Point Calculator /
Market Profile Generator /
Fibonacci Calculator /
Mailing List /
Advertise Here /
Articles /
Financial Terms /
Brokers /
Software /
Holidays /
Stock Split Calendar /
Mortgage Calculator /
Donate
Copyright © 2004-2023, MyPivots. All rights reserved.
Copyright © 2004-2023, MyPivots. All rights reserved.