ES Wednesday 11-30-11
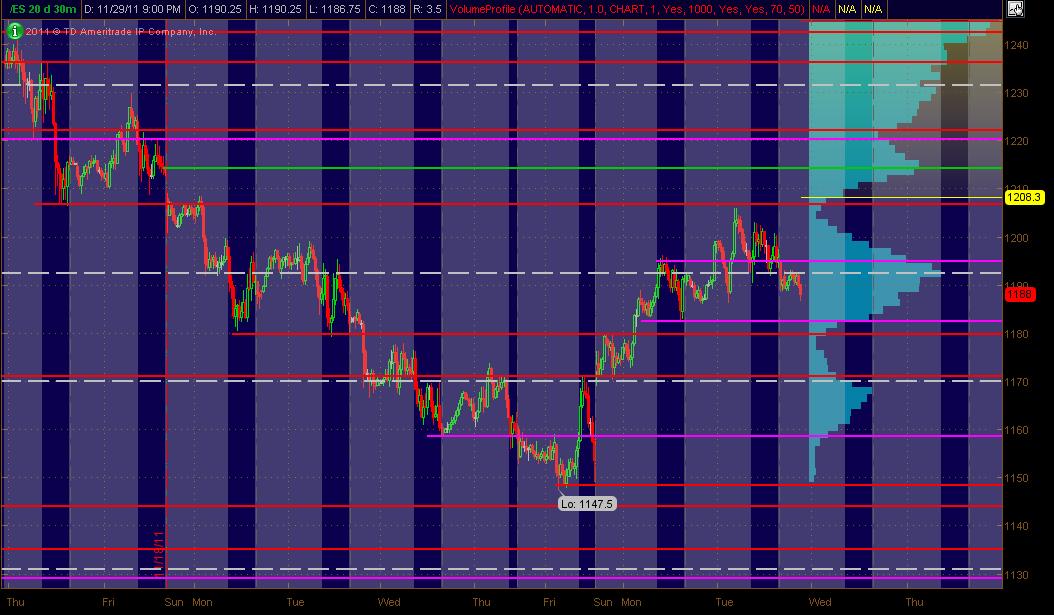
Here's what I've got for my ES MAP of PASR ZONES using a 30min chart of 20 days of data coming into Wednesday's trading. The Red lines are potential significant levels with Magenta lines as semi-significant. The White dashed lines are the Weekly Pivots and the Green line is an unfilled Gap. The Light Blue Volume Profile of the past "rolling" 20 days is displayed on the right vertical axis. The Gray background shows non-RTH price activity. Hope this is helpful to some as a "MAP"
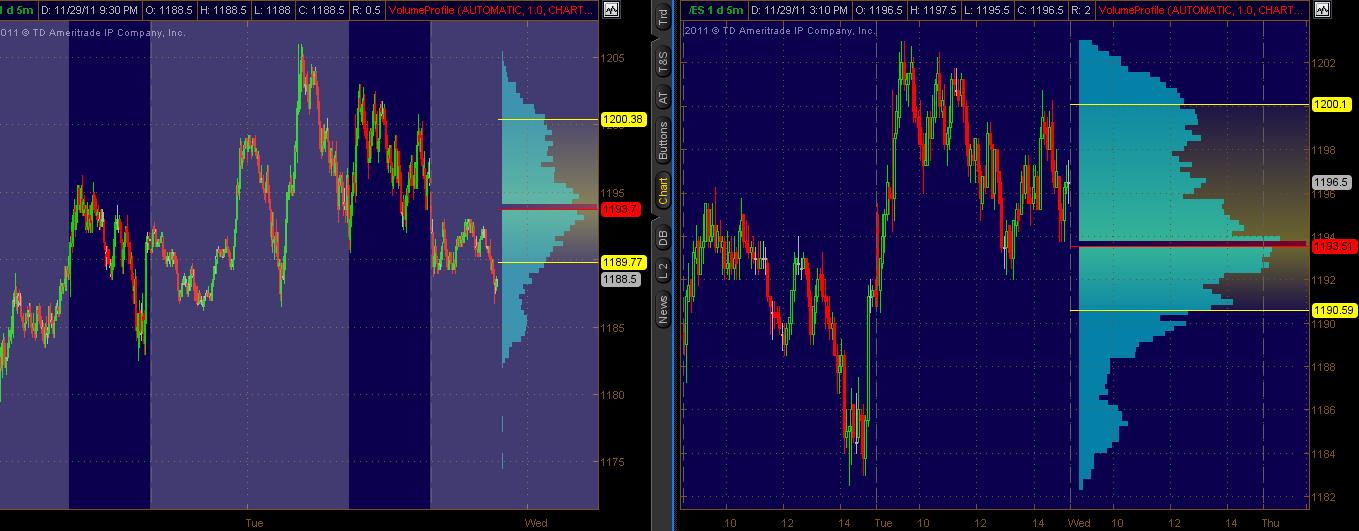
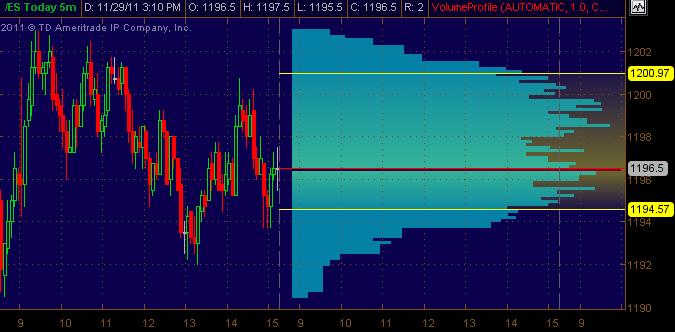
Here are two 5min charts showing Volume Profile ... 2 days worth, with the one on the left incorporating (in gray background) All Trading Hours ... with the one on the right showing 2 days of RTH. This is using Thinkorswim software.
where is everyone? is there a new Forum?
Good to see your back!
scott, what happend to the Forum? has it moved?
I can only speculate but I think that sandoxe was challenging some of bruce's calls....and bruce didn't appreciate his comments. I always appreciate his insight and your charts....
hi lisa
no it hasnt gone anywhere got rid of the paper traders as bruce called
Ive had a very sick wife and dog so im in and out Il post tomorrow
how was south ???
no it hasnt gone anywhere got rid of the paper traders as bruce called
Ive had a very sick wife and dog so im in and out Il post tomorrow
how was south ???
Hi All,
I joined this site about a year ago... quit coming here and then got interested again a couple of weeks back. The (non-antagonistic)commentary is great. I hope the regulars post more frequently.
I joined this site about a year ago... quit coming here and then got interested again a couple of weeks back. The (non-antagonistic)commentary is great. I hope the regulars post more frequently.
Emini Day Trading /
Daily Notes /
Forecast /
Economic Events /
Search /
Terms and Conditions /
Disclaimer /
Books /
Online Books /
Site Map /
Contact /
Privacy Policy /
Links /
About /
Day Trading Forum /
Investment Calculators /
Pivot Point Calculator /
Market Profile Generator /
Fibonacci Calculator /
Mailing List /
Advertise Here /
Articles /
Financial Terms /
Brokers /
Software /
Holidays /
Stock Split Calendar /
Mortgage Calculator /
Donate
Copyright © 2004-2023, MyPivots. All rights reserved.
Copyright © 2004-2023, MyPivots. All rights reserved.


