SI
sirios
Rep: 0
Posts: 157
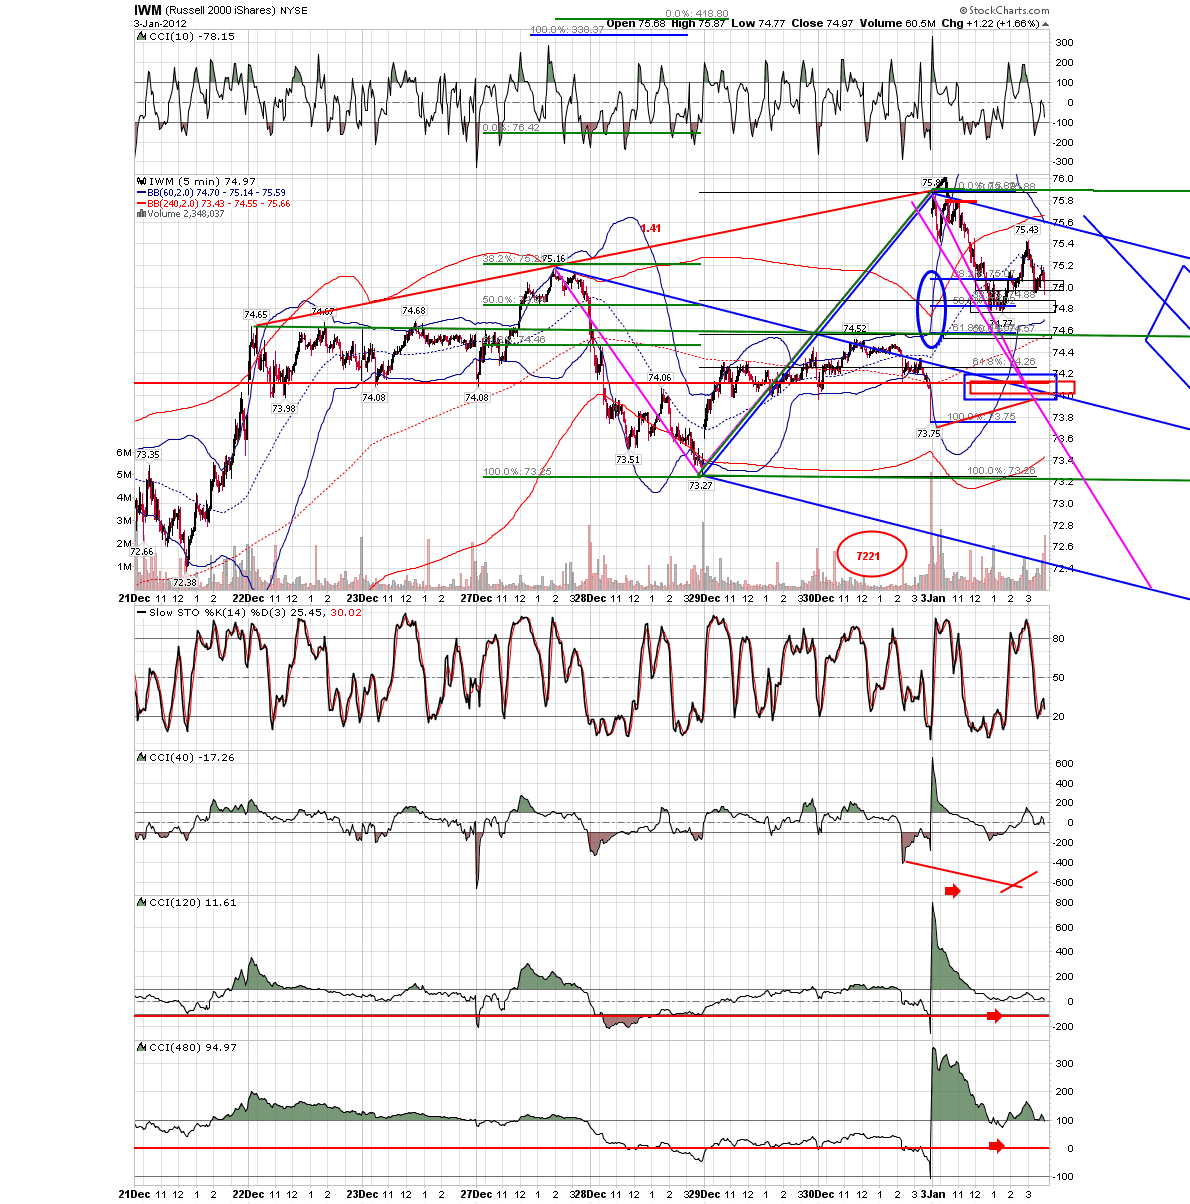
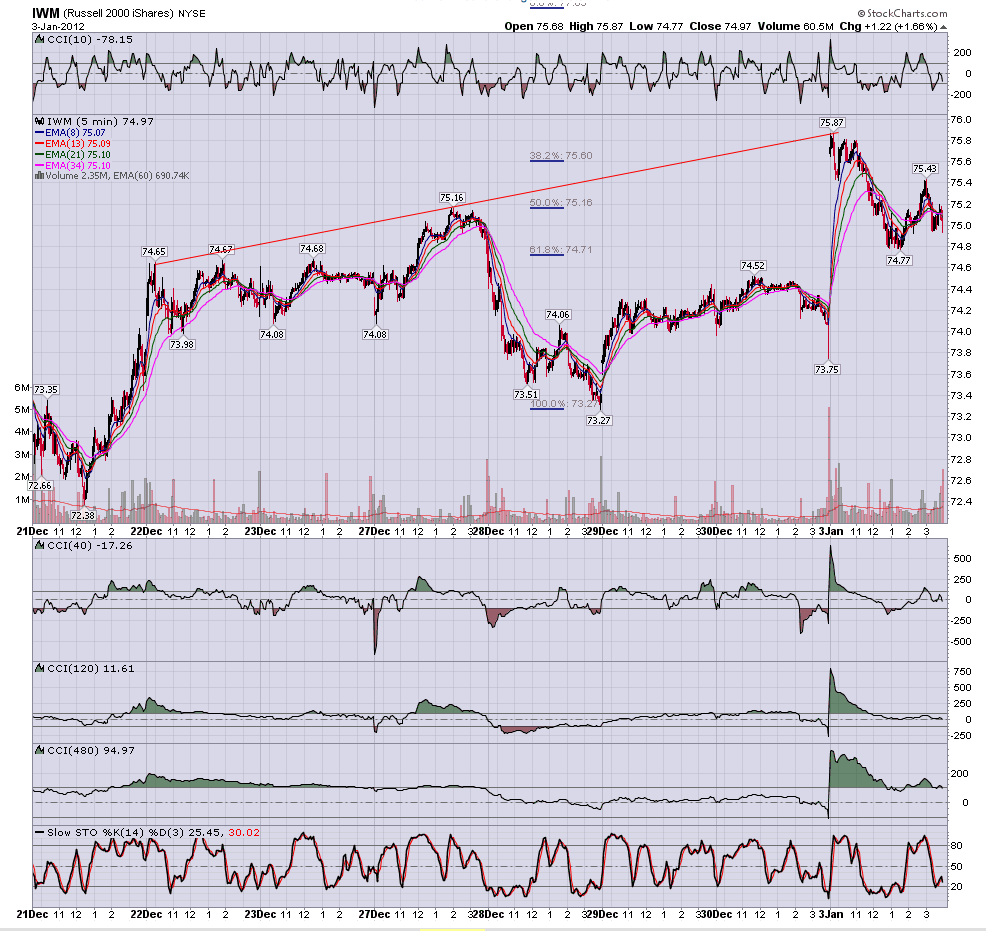
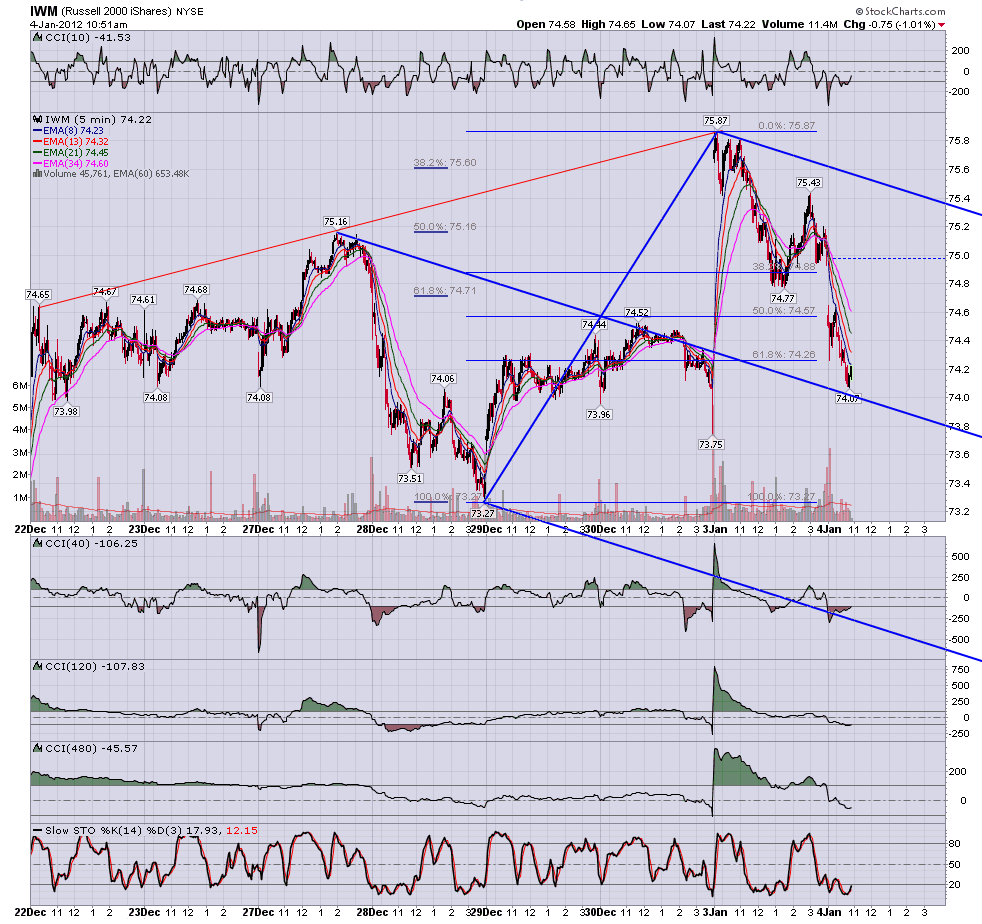
I see the line and area 61,8.
Originally posted by jimkane
P.S.S. I hope everyone who worked up the initial high area can see the line that stopped the drop, dead in its tracks.
AL
albert
Rep: 99
Posts: 3,094
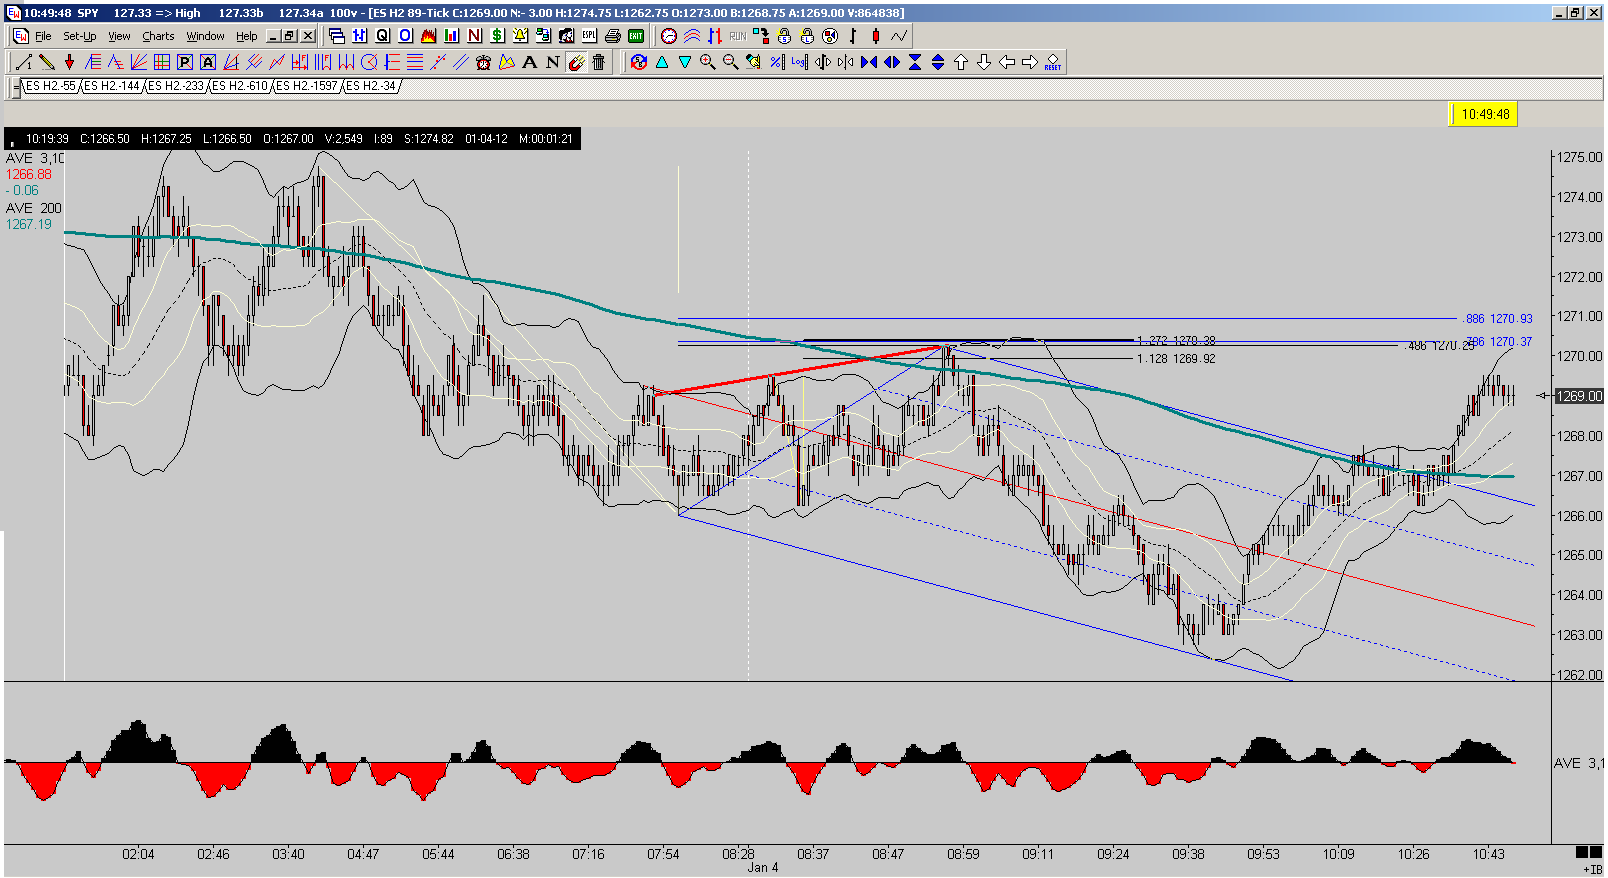
That red line on the previous chart was a 1.272 DBS too. My apologies.
Al Kamego
Al Kamego
JI
jimkane
Rep: 3,058
Posts: 33,089
Trouble here at this 73.00 might imply some selling. I'm watching this very cautiously.
SI
sirios
Rep: 0
Posts: 157
In my opinion they did what wanted to do. Last move up before close was to keep faith into rising. Globex will sent SPY back below 200 daily moving average. We will also see pretty “island reversal” on daily chart.
They have long term plan and executing it. I think currently they have full wallet of shorts. Probably they see bigger money in bankruptcy European Countries then in printing money.
Of course „We will see”
They have long term plan and executing it. I think currently they have full wallet of shorts. Probably they see bigger money in bankruptcy European Countries then in printing money.
Of course „We will see”